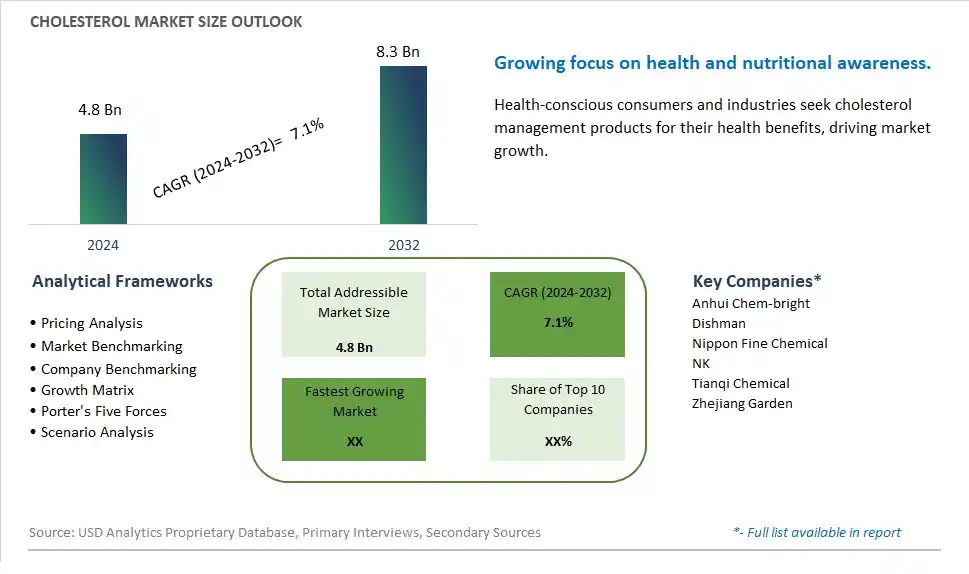
Global Cholesterol Market Size is valued at $4.8 Billion in 2024 and is forecast to register a growth rate (CAGR) of 7.1% to reach $8.3 Billion by 2032.
The global Cholesterol Market Comprehensive Study analyzes and forecasts the market size across 6 regions and 24 countries for diverse segments -By Type (NF Grade Cholesterol, BP Grade Cholesterol, Others), By Application (Pharmaceuticals, Feeds, Cosmetics, Others)
An Introduction to Cholesterol Market
The Cholesterol market in 2024 is witnessing steady growth, driven by the demand for cholesterol in various industrial applications, including pharmaceuticals, cosmetics, and food production. Cholesterol, a crucial component in cell membrane structure and precursor for the synthesis of steroid hormones, is used in the formulation of certain medications, skincare products, and nutritional supplements. The market is supported by advancements in biotechnology and synthesis methods that enhance the purity and availability of cholesterol. The market is also benefiting from the trend towards health-conscious and scientifically backed ingredients in pharmaceuticals and cosmetics, appealing to manufacturers seeking high-quality and effective components.
Cholesterol Competitive Landscape
The market report analyses the leading companies in the industry including Anhui Chem-bright, Dishman, Nippon Fine Chemical, NK, Tianqi Chemical, Zhejiang Garden, and Others.
Cholesterol Market Dynamics
Cholesterol Market Trend: Increasing Awareness and Focus on Heart Health
A prominent market trend for cholesterol is the increasing awareness and focus among consumers on heart health. With rising concerns about cardiovascular diseases and related risk factors, there's a growing emphasis on monitoring and managing cholesterol levels through lifestyle changes, dietary adjustments, and preventive healthcare measures. Consumers are seeking information, products, and services that help them maintain healthy cholesterol levels and support overall cardiovascular wellness.
Cholesterol Market Driver: Health-conscious Lifestyle Choices and Dietary Trends
A key driver fueling the market for cholesterol-related products and services is the adoption of health-conscious lifestyle choices and dietary trends. As more individuals prioritize wellness, nutrition, and preventive healthcare, there's a demand for cholesterol-lowering foods, supplements, medications, and diagnostic tests. The market responds to consumer needs by offering a range of cholesterol management solutions, including low-cholesterol diets, plant-based alternatives, cholesterol-lowering medications, and health education programs.
Cholesterol Market Opportunity: Development of Functional Foods and Nutritional Supplements
An opportunity within the cholesterol market lies in the development of functional foods and nutritional supplements targeting cholesterol management. Manufacturers can innovate and formulate products enriched with ingredients known to promote healthy cholesterol levels, such as soluble fibers, plant sterols, omega-3 fatty acids, antioxidants, and bioactive compounds. Additionally, exploring personalized nutrition solutions, digital health platforms for cholesterol tracking, and educational resources for lifestyle modifications presents opportunities to engage consumers and empower them in managing their cholesterol health effectively. By leveraging advancements in nutrition science and consumer-centric approaches, companies can capitalize on the market opportunity presented by the growing interest in cholesterol management and heart-healthy lifestyles.
Cholesterol Market Share Analysis: NF Grade Cholesterol segment generated the highest revenue share in the industry
NF Grade Cholesterol is the largest segment in the Cholesterol Market by type. This segment's dominance is driven by the extensive use of NF (National Formulary) Grade Cholesterol in pharmaceutical and medical applications. NF Grade Cholesterol meets the stringent quality and purity standards required for medical and pharmaceutical use, making it a critical ingredient in the formulation of various medications, including lipid-regulating drugs and hormone therapies. Its high purity and quality ensure its effectiveness and safety in pharmaceutical applications, which is essential for regulatory approval and patient safety. The increasing prevalence of cardiovascular diseases and other cholesterol-related health conditions drives the demand for effective pharmaceutical treatments, further boosting the need for NF Grade Cholesterol. Additionally, the growth of the global pharmaceutical industry and the ongoing research and development in drug formulation contribute to the sustained demand for NF Grade Cholesterol, solidifying its position as the largest segment in the cholesterol market.
Cholesterol Market Share Analysis: Pharmaceuticals is the fastest growing segment over the forecast period to 2032
The Pharmaceuticals segment is projected to be the fastest growing in the Cholesterol Market by application through 2032. This growth is primarily driven by the increasing demand for cholesterol in the production of essential medications and therapeutic formulations. Cholesterol plays a crucial role in the development of lipid-based drug delivery systems, which enhance the bioavailability and efficacy of various drugs. The rising prevalence of chronic diseases, such as cardiovascular diseases, diabetes, and obesity, has led to an increased focus on developing effective treatments that often require cholesterol as a key ingredient. Furthermore, advancements in biotechnology and pharmaceutical research are driving the innovation of new drug formulations that utilize cholesterol, particularly in targeted drug delivery and vaccine development. The global aging population and the subsequent rise in age-related health conditions also contribute to the growing demand for pharmaceuticals that incorporate cholesterol. As the pharmaceutical industry continues to expand and innovate, the demand for cholesterol in drug development and production is expected to increase significantly, making the Pharmaceuticals segment the fastest growing application in the cholesterol market.
Cholesterol Market Segmentation
By Type
NF Grade Cholesterol
BP Grade Cholesterol
Others
By Application
Pharmaceuticals
Feeds
Cosmetics
Others
Countries Analyzed
North America (US, Canada, Mexico)
Europe (Germany, UK, France, Spain, Italy, Russia, Rest of Europe)
Asia Pacific (China, India, Japan, South Korea, Australia, South East Asia, Rest of Asia)
South America (Brazil, Argentina, Rest of South America)
Middle East and Africa (Saudi Arabia, UAE, Rest of Middle East, South Africa, Egypt, Rest of Africa)
Cholesterol Companies Profiled in the Study
Anhui Chem-bright
Dishman
Nippon Fine Chemical
NK
Tianqi Chemical
Zhejiang Garden
*- List Not Exhaustive
Chapter 1. TABLE OF CONTENTS
Chapter 2. Introduction to Cholesterol Market
2.1. Market Overview
2.2. Key Statistics and Report Highlights
2.3. Scope of the Comprehensive Study
2.3.1. Market Definition
2.3.2 Countries and Regions Covered
2.3.3 Research Objective
2.3.4 Units, Currency, and Conversions
2.3.5 Industry Value Chain
2.4. Key Market Segments
2.5. Key Companies
2.6. Study Period
Chapter 3. Strategic Analysis Review
3.1. Cholesterol Pricing Analysis and Forecast
3.2. Porter’s Five Forces
3.3. Market Ecosystem
3.4. SWOT Analysis
3.5. Regulatory Scenario
3.3. Effects of Inflation, Russia-Ukraine War, moderating economic growth, and other macroeconomic factors
Chapter 4. Competitive Landscape
4.1. Market Share Analysis
4.1.1. Global Cholesterol Market Share by Company, 2023
4.1.2. Product Offerings of Leading Cholesterol Companies
4.2. Market Entropy
4.2.1. New Product Launches in the Industry
4.2.2. Mergers, Acquisitions, Joint ventures, and Partnerships
4.3. Key Strategies and Best Practices
Chapter 5. Global Market Projections: Best, Reference, and Low Case Scenarios
5.1. Growth Analysis- Case Scenario Definitions
5.2. Low Growth Case Scenario Forecasts
5.3. Reference Growth Case Scenario Forecasts
5.4. High Growth Case Scenario Forecasts
Chapter 6. Market Dynamics
6.1. Cholesterol Market Drivers
6.2. Cholesterol Market Challenges
6.6. Cholesterol Market Opportunities
6.4. Cholesterol Market Trends
Chapter 7. Global Cholesterol Market Outlook Trends
7.1. Global Cholesterol Revenue (USD Million) and CAGR (%) by Type (2021-2032)
7.2. Global Cholesterol Revenue (USD Million) and CAGR (%) by Application (2021-2032)
7.3. Global Cholesterol Revenue (USD Million) and CAGR (%) by Product (2021-2032)
By Type
NF Grade Cholesterol
BP Grade Cholesterol
Others
By Application
Pharmaceuticals
Feeds
Cosmetics
Others
Chapter 8. Global Cholesterol Regional Analysis and Outlook
8.1. Global Cholesterol Revenue (USD Million) By Regions (2021- 2032)
8.2. North America Cholesterol Revenue (USD Million) by Country (2021-2032)
8.2.1. United States Cholesterol Regional Analysis and Outlook
8.2.2. Canada Cholesterol Regional Analysis and Outlook
8.2.3. Mexico Cholesterol Regional Analysis and Outlook
8.3. Europe Cholesterol Revenue (USD Million), by Country (2021-2032)
8.3.1. Germany Cholesterol Regional Analysis and Outlook
8.3.2. France Cholesterol Regional Analysis and Outlook
8.3.3. United Kingdom Cholesterol Regional Analysis and Outlook
8.3.4. Spain Cholesterol Regional Analysis and Outlook
8.3.5. Italy Cholesterol Regional Analysis and Outlook
8.3.6. Russia Cholesterol Regional Analysis and Outlook
8.3.7. Rest of Europe Cholesterol Regional Analysis and Outlook
8.4. Asia Pacific Cholesterol Revenue (USD Million) by Country (2021-2032)
8.4.1. China Cholesterol Regional Analysis and Outlook
8.4.2. Japan Cholesterol Regional Analysis and Outlook
8.4.3. India Cholesterol Regional Analysis and Outlook
8.4.4. South Korea Cholesterol Regional Analysis and Outlook
8.4.5. Australia Cholesterol Regional Analysis and Outlook
8.4.6. South East Asia Cholesterol Regional Analysis and Outlook
8.4.7. Rest of Asia Pacific Cholesterol Regional Analysis and Outlook
8.5. South America Cholesterol Revenue (USD Million), by Country (2021-2032)
8.5.1. Brazil Cholesterol Regional Analysis and Outlook
8.5.2. Argentina Cholesterol Regional Analysis and Outlook
8.5.3. Rest of South America Cholesterol Regional Analysis and Outlook
8.6. Middle East and Africa Cholesterol Revenue (USD Million) by Country (2021-2032)
8.6.1. Middle East Cholesterol Regional Analysis and Outlook
8.6.2. Africa Cholesterol Regional Analysis and Outlook
Chapter 9. North America Cholesterol Analysis and Outlook
9.1. North America Cholesterol Revenue (USD Million) by Segments (2021-2032)
9.1.1. North America Cholesterol Revenue (USD Million) by Type (2021-2032)
9.1.2. North America Cholesterol Revenue (USD Million) by Application (2021-2032)
9.1.3. North America Cholesterol Revenue (USD Million) by Product (2021-2032)
By Type
NF Grade Cholesterol
BP Grade Cholesterol
Others
By Application
Pharmaceuticals
Feeds
Cosmetics
Others
Chapter 10. Europe Cholesterol Analysis and Outlook
10.1. Europe Cholesterol Revenue (USD Million), by Segments (USD Million) (2021-2032)
10.1.1. Europe Cholesterol Revenue (USD Million) by Type (2021-2032)
10.1.2. Europe Cholesterol Revenue (USD Million) by Application (2021-2032)
10.1.3. Europe Cholesterol Revenue (USD Million) by Product (2021-2032)
By Type
NF Grade Cholesterol
BP Grade Cholesterol
Others
By Application
Pharmaceuticals
Feeds
Cosmetics
Others
Chapter 11. Asia Pacific Cholesterol Analysis and Outlook
11.1. Asia Pacific Cholesterol Revenue (USD Million), and Revenue (USD Million) by Segments (2021-2032)
11.1.1. Asia Pacific Cholesterol Revenue (USD Million) by Type (2021-2032)
11.1.2. Asia Pacific Cholesterol Revenue (USD Million) by Application (2021-2032)
11.1.3. Asia Pacific Cholesterol Revenue (USD Million) by Product (2021-2032)
By Type
NF Grade Cholesterol
BP Grade Cholesterol
Others
By Application
Pharmaceuticals
Feeds
Cosmetics
Others
Chapter 12. South America Cholesterol Analysis and Outlook
12.1. South America Cholesterol Revenue (USD Million), by Segments (2021-2032)
12.1.1. South America Cholesterol Revenue (USD Million) by Type (2021-2032)
12.1.2. South America Cholesterol Revenue (USD Million) by Application (2021-2032)
12.1.3. South America Cholesterol Revenue (USD Million) by Product (2021-2032)
By Type
NF Grade Cholesterol
BP Grade Cholesterol
Others
By Application
Pharmaceuticals
Feeds
Cosmetics
Others
Chapter 13. Middle East and Africa Cholesterol Analysis and Outlook
13.1. Middle East and Africa Cholesterol Revenue (USD Million), by Segments (2021-2032)
13.1.1. Middle East and Africa Cholesterol Revenue (USD Million) by Type (2021-2032)
13.1.2. Middle East and Africa Cholesterol Revenue (USD Million) by Application (2021-2032)
13.1.3. Middle East and Africa Cholesterol Revenue (USD Million) by Product (2021-2032)
By Type
NF Grade Cholesterol
BP Grade Cholesterol
Others
By Application
Pharmaceuticals
Feeds
Cosmetics
Others
Chapter 14. Cholesterol Company Profiles
14.1 Business Overview
14.2 Product Profiles
14.3 SWOT Profiles
14.5 Recent Developments
14.6 Financial Profile
List of Companies
Anhui Chem-bright
Dishman
Nippon Fine Chemical
NK
Tianqi Chemical
Zhejiang Garden
15. Methodology and Data Sources
15.1 Customization Offerings
15.2 Subscription Services
15.3 Related Reports
15.4 Publisher Expertise
LIST OF TABLES
Table 1 Market Segmentation Analysis
Table 2 Global Cholesterol Market Share of Leading Companies, 2023
Table 3 Product Offerings of Leading Companies
Table 4 Low Growth Scenario Forecasts
Table 5 Reference Case Growth Scenario
Table 6 High Growth Case Scenario
Table 7 Global Cholesterol Revenue (USD Million) And CAGR (%) By Type (2021-2032)
Table 8 Global Cholesterol Revenue (USD Million) And CAGR (%) By Application (2021-2032)
Table 9 Global Cholesterol Revenue (USD Million) And CAGR (%) By Product (2021-2032)
Table 10 Global Cholesterol Market Revenue (USD Million) By Regions (2021-2032)
Table 11 Global Cholesterol Market Share (%) By Regions (2021-2032)
Table 12 North America Cholesterol Revenue (USD Million) By Country (2021-2032)
Table 13 Europe Cholesterol Revenue (USD Million) By Country (2021-2032)
Table 14 Asia Pacific Cholesterol Revenue (USD Million) By Country (2021-2032)
Table 15 South America Cholesterol Revenue (USD Million) By Country (2021-2032)
Table 16 Middle East and Africa Cholesterol Revenue (USD Million) By Region (2021-2032)
Table 17 North America Cholesterol Revenue (USD Million) By Type (2021-2032)
Table 18 North America Cholesterol Revenue (USD Million) By Application (2021-2032)
Table 19 North America Cholesterol Revenue (USD Million) By Product (2021-2032)
Table 20 Europe Cholesterol Revenue (USD Million) By Type (2021-2032)
Table 21 Europe Cholesterol Revenue (USD Million) By Application (2021-2032)
Table 22 Europe Cholesterol Revenue (USD Million) By Product (2021-2032)
Table 23 Asia Pacific Cholesterol Revenue (USD Million) By Type (2021-2032)
Table 24 Asia Pacific Cholesterol Revenue (USD Million) By Application (2021-2032)
Table 25 Asia Pacific Cholesterol Revenue (USD Million) By Product (2021-2032)
Table 26 South America Cholesterol Revenue (USD Million) By Type (2021-2032)
Table 27 South America Cholesterol Revenue (USD Million) By Application (2021-2032)
Table 28 South America Cholesterol Revenue (USD Million) By Product (2021-2032)
Table 29 Middle East and Africa Cholesterol Revenue (USD Million) By Type (2021-2032)
Table 30 Middle East and Africa Cholesterol Revenue (USD Million) By Application (2021-2032)
Table 31 Middle East and Africa Cholesterol Revenue (USD Million) By Product (2021-2032)
LIST OF FIGURES
Figure 1. Market Scope
Figure 2. Pricing Forecasts Per Unit, 2023- 2032
Figure 3. Porter’s Five Forces
Figure 4. Global Cholesterol Market Revenue (USD Million) By Regions (2021-2032)
Figure 5. Global Cholesterol Market Share (%) By Regions (2023)
Figure 6. North America Cholesterol Revenue (USD Million) By Country (2021-2032)
Figure 7. United States Cholesterol Revenue (USD Million) By Country (2021-2032)
Figure 8. Canada Cholesterol Revenue (USD Million) By Country (2021-2032)
Figure 9. Mexico Cholesterol Revenue (USD Million) By Country (2021-2032)
Figure 10. Europe Cholesterol Revenue (USD Million) By Country (2021-2032)
Figure 11. Germany Cholesterol Revenue (USD Million) By Country (2021-2032)
Figure 12. France Cholesterol Revenue (USD Million) By Country (2021-2032)
Figure 13. United Kingdom Cholesterol Revenue (USD Million) By Country (2021-2032)
Figure 14. Spain Cholesterol Revenue (USD Million) By Country (2021-2032)
Figure 15. Italy Cholesterol Revenue (USD Million) By Country (2021-2032)
Figure 16. Russia Cholesterol Revenue (USD Million) By Country (2021-2032)
Figure 17. Rest of Europe Cholesterol Revenue (USD Million) By Country (2021-2032)
Figure 11. Asia Pacific Cholesterol Revenue (USD Million) By Country (2021-2032)
Figure 12. China Cholesterol Revenue (USD Million) By Country (2021-2032)
Figure 13. Japan Cholesterol Revenue (USD Million) By Country (2021-2032)
Figure 14. India Cholesterol Revenue (USD Million) By Country (2021-2032)
Figure 15. South Korea Cholesterol Revenue (USD Million) By Country (2021-2032)
Figure 16. Australia Cholesterol Revenue (USD Million) By Country (2021-2032)
Figure 17. South East Asia Cholesterol Revenue (USD Million) By Country (2021-2032)
Figure 18. South America Cholesterol Revenue (USD Million) By Country (2021-2032)
Figure 19. Brazil Cholesterol Revenue (USD Million) By Country (2021-2032)
Figure 20. Argentina Cholesterol Revenue (USD Million) By Country (2021-2032)
Figure 21. Rest of Asia Pacific Cholesterol Revenue (USD Million) By Country (2021-2032)
Figure 22. Middle East and Africa Cholesterol Revenue (USD Million) By Region (2021-2032)
Figure 23. Saudi Arabia Cholesterol Revenue (USD Million) By Region (2021-2032)
Figure 24. The UAE Cholesterol Revenue (USD Million) By Region (2021-2032)
Figure 25. Rest of Middle East Cholesterol Revenue (USD Million) By Region (2021-2032)
Figure 26. South Africa Cholesterol Revenue (USD Million) By Region (2021-2032)
Figure 27. Africa Cholesterol Revenue (USD Million) By Region (2021-2032)
Figure 28. North America Cholesterol Revenue (USD Million) By Type (2021-2032)
Figure 29. North America Cholesterol Revenue (USD Million) By Application (2021-2032)
Figure 30. North America Cholesterol Revenue (USD Million) By Product (2021-2032)
Figure 31. Europe Cholesterol Revenue (USD Million) By Type (2021-2032)
Figure 32. Europe Cholesterol Revenue (USD Million) By Application (2021-2032)
Figure 33. Europe Cholesterol Revenue (USD Million) By Product (2021-2032)
Figure 34. Asia Pacific Cholesterol Revenue (USD Million) By Type (2021-2032)
Figure 35. Asia Pacific Cholesterol Revenue (USD Million) By Application (2021-2032)
Figure 36. Asia Pacific Cholesterol Revenue (USD Million) By Product (2021-2032)
Figure 37. South America Cholesterol Revenue (USD Million) By Type (2021-2032)
Figure 38. South America Cholesterol Revenue (USD Million) By Application (2021-2032)
Figure 39. South America Cholesterol Revenue (USD Million) By Product (2021-2032)
Figure 40. Middle East and Africa Cholesterol Revenue (USD Million) By Type (2021-2032)
Figure 41. Middle East and Africa Cholesterol Revenue (USD Million) By Application (2021-2032)
Figure 42. Middle East and Africa Cholesterol Revenue (USD Million) By Product (2021-2032)
By Type
NF Grade Cholesterol
BP Grade Cholesterol
Others
By Application
Pharmaceuticals
Feeds
Cosmetics
Others
Countries Analyzed
North America (US, Canada, Mexico)
Europe (Germany, UK, France, Spain, Italy, Russia, Rest of Europe)
Asia Pacific (China, India, Japan, South Korea, Australia, South East Asia, Rest of Asia)
South America (Brazil, Argentina, Rest of South America)
Middle East and Africa (Saudi Arabia, UAE, Rest of Middle East, South Africa, Egypt, Rest of Africa)
