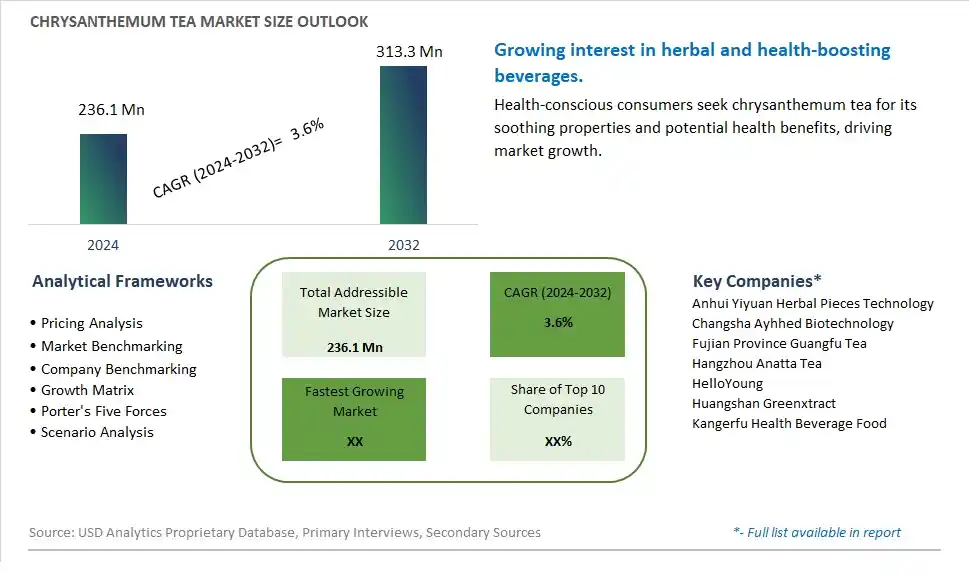
Global Chrysanthemum Tea Market Size is valued at $236.1 Million in 2024 and is forecast to register a growth rate (CAGR) of 3.6% to reach $313.3 Million by 2032.
The global Chrysanthemum Tea Market Comprehensive Study analyzes and forecasts the market size across 6 regions and 24 countries for diverse segments -By Type (Chrysanthemum Indicum, Chrysanthemum Morifolium), By Application (Retail, Catering)
An Introduction to Chrysanthemum Tea Market
In 2024, the Chrysanthemum Tea market is witnessing significant growth, driven by the increasing popularity of herbal and functional teas. Chrysanthemum tea, known for its delicate flavor and health benefits such as aiding digestion, reducing inflammation, and promoting relaxation, is gaining traction among health-conscious consumers. The market is supported by the growing trend towards natural and holistic wellness products. Advances in cultivation and drying technologies are enhancing the quality, flavor, and shelf life of chrysanthemum tea. The market is also benefiting from the trend towards clean-label and organic beverages, appealing to consumers seeking natural and beneficial tea options.
Chrysanthemum Tea Competitive Landscape
The market report analyses the leading companies in the industry including Anhui Yiyuan Herbal Pieces Technology, Changsha Ayhhed Biotechnology, Fujian Province Guangfu Tea, Hangzhou Anatta Tea, HelloYoung, Huangshan Greenxtract, Kangerfu Health Beverage Food, and Others.
Chrysanthemum Tea Market Dynamics
Chrysanthemum Tea Market Trend: Rising Popularity of Herbal and Functional Beverages
A prominent market trend for chrysanthemum tea is the rising popularity of herbal and functional beverages among consumers. With increasing awareness of health benefits associated with herbal remedies and natural ingredients, there's a growing preference for chrysanthemum tea due to its perceived therapeutic properties, including relaxation, stress relief, and immune system support. Consumers are seeking beverages that not only taste good but also offer functional benefits for overall well-being.
Chrysanthemum Tea Market Driver: Health and Wellness Consciousness
A key driver fueling the market for chrysanthemum tea is the growing health and wellness consciousness among consumers. As people prioritize self-care, stress management, and preventive healthcare, there's a demand for beverages that promote relaxation, boost immunity, and contribute to a balanced lifestyle. Chrysanthemum tea's reputation as a soothing and health-promoting drink aligns with these wellness trends, driving its consumption among health-conscious individuals.
Chrysanthemum Tea Market Opportunity: Expansion into Functional Beverage Segments
An opportunity within the chrysanthemum tea market lies in expansion into functional beverage segments. Manufacturers can innovate by introducing chrysanthemum tea variants enriched with additional functional ingredients such as vitamin C, antioxidants, adaptogens, or botanical extracts known for their health-enhancing properties. Additionally, exploring ready-to-drink formats, convenient packaging options, and targeting specific consumer segments such as athletes, busy professionals, or seniors can further expand the market reach of chrysanthemum tea as a functional and refreshing beverage choice. By capitalizing on its natural health benefits and adapting to consumer preferences for functional beverages, companies can seize the market opportunity presented by the growing demand for chrysanthemum tea.
Chrysanthemum Tea Market Share Analysis: Chrysanthemum Morifolium segment generated the highest revenue share in the industry
Chrysanthemum Morifolium is the largest segment in the Chrysanthemum Tea Market by type. This segment's dominance is driven by its widespread popularity and extensive use in traditional Chinese medicine and everyday consumption. Chrysanthemum Morifolium is known for its delicate flavor and numerous health benefits, including its ability to reduce inflammation, relieve headaches, and improve vision. These medicinal properties make it a preferred choice among consumers who seek both flavor and health benefits in their tea. The ease of cultivation and the high yield of Chrysanthemum Morifolium also contribute to its widespread availability and affordability, further solidifying its position as the largest segment in the market. The extensive marketing and promotion of Chrysanthemum Morifolium as a premium and beneficial tea option have also played a significant role in its market dominance.
Chrysanthemum Tea Market Share Analysis: Catering is the fastest growing segment over the forecast period to 2032
The Catering segment is projected to be the fastest growing in the Chrysanthemum Tea Market by application through 2032. This rapid growth is driven by the increasing demand for unique and healthy beverage options in the hospitality industry. Restaurants, hotels, and cafes are incorporating chrysanthemum tea into their menus to cater to the growing health-conscious consumer base. The tea's refreshing taste and health benefits make it a popular choice for catering services looking to offer distinctive and wellness-oriented beverage options. Additionally, the rise of wellness and health-focused dining experiences has led to an increased adoption of chrysanthemum tea in catering. Events and gatherings, such as weddings and corporate meetings, are also seeing a higher demand for chrysanthemum tea as part of their beverage offerings. As the trend towards healthy and unique beverages continues to rise, the catering segment is expected to experience significant growth, making it the fastest growing application in the chrysanthemum tea market.
Chrysanthemum Tea Market Segmentation
By Type
Chrysanthemum Indicum
Chrysanthemum Morifolium
By Application
Retail
Catering
Countries Analyzed
North America (US, Canada, Mexico)
Europe (Germany, UK, France, Spain, Italy, Russia, Rest of Europe)
Asia Pacific (China, India, Japan, South Korea, Australia, South East Asia, Rest of Asia)
South America (Brazil, Argentina, Rest of South America)
Middle East and Africa (Saudi Arabia, UAE, Rest of Middle East, South Africa, Egypt, Rest of Africa)
Chrysanthemum Tea Companies Profiled in the Study
Anhui Yiyuan Herbal Pieces Technology
Changsha Ayhhed Biotechnology
Fujian Province Guangfu Tea
Hangzhou Anatta Tea
HelloYoung
Huangshan Greenxtract
Kangerfu Health Beverage Food
*- List Not Exhaustive
Chapter 1. TABLE OF CONTENTS
Chapter 2. Introduction to Chrysanthemum Tea Market
2.1. Market Overview
2.2. Key Statistics and Report Highlights
2.3. Scope of the Comprehensive Study
2.3.1. Market Definition
2.3.2 Countries and Regions Covered
2.3.3 Research Objective
2.3.4 Units, Currency, and Conversions
2.3.5 Industry Value Chain
2.4. Key Market Segments
2.5. Key Companies
2.6. Study Period
Chapter 3. Strategic Analysis Review
3.1. Chrysanthemum Tea Pricing Analysis and Forecast
3.2. Porter’s Five Forces
3.3. Market Ecosystem
3.4. SWOT Analysis
3.5. Regulatory Scenario
3.3. Effects of Inflation, Russia-Ukraine War, moderating economic growth, and other macroeconomic factors
Chapter 4. Competitive Landscape
4.1. Market Share Analysis
4.1.1. Global Chrysanthemum Tea Market Share by Company, 2023
4.1.2. Product Offerings of Leading Chrysanthemum Tea Companies
4.2. Market Entropy
4.2.1. New Product Launches in the Industry
4.2.2. Mergers, Acquisitions, Joint ventures, and Partnerships
4.3. Key Strategies and Best Practices
Chapter 5. Global Market Projections: Best, Reference, and Low Case Scenarios
5.1. Growth Analysis- Case Scenario Definitions
5.2. Low Growth Case Scenario Forecasts
5.3. Reference Growth Case Scenario Forecasts
5.4. High Growth Case Scenario Forecasts
Chapter 6. Market Dynamics
6.1. Chrysanthemum Tea Market Drivers
6.2. Chrysanthemum Tea Market Challenges
6.6. Chrysanthemum Tea Market Opportunities
6.4. Chrysanthemum Tea Market Trends
Chapter 7. Global Chrysanthemum Tea Market Outlook Trends
7.1. Global Chrysanthemum Tea Revenue (USD Million) and CAGR (%) by Type (2021-2032)
7.2. Global Chrysanthemum Tea Revenue (USD Million) and CAGR (%) by Application (2021-2032)
7.3. Global Chrysanthemum Tea Revenue (USD Million) and CAGR (%) by Product (2021-2032)
By Type
Chrysanthemum Indicum
Chrysanthemum Morifolium
By Application
Retail
Catering
Chapter 8. Global Chrysanthemum Tea Regional Analysis and Outlook
8.1. Global Chrysanthemum Tea Revenue (USD Million) By Regions (2021- 2032)
8.2. North America Chrysanthemum Tea Revenue (USD Million) by Country (2021-2032)
8.2.1. United States Chrysanthemum Tea Regional Analysis and Outlook
8.2.2. Canada Chrysanthemum Tea Regional Analysis and Outlook
8.2.3. Mexico Chrysanthemum Tea Regional Analysis and Outlook
8.3. Europe Chrysanthemum Tea Revenue (USD Million), by Country (2021-2032)
8.3.1. Germany Chrysanthemum Tea Regional Analysis and Outlook
8.3.2. France Chrysanthemum Tea Regional Analysis and Outlook
8.3.3. United Kingdom Chrysanthemum Tea Regional Analysis and Outlook
8.3.4. Spain Chrysanthemum Tea Regional Analysis and Outlook
8.3.5. Italy Chrysanthemum Tea Regional Analysis and Outlook
8.3.6. Russia Chrysanthemum Tea Regional Analysis and Outlook
8.3.7. Rest of Europe Chrysanthemum Tea Regional Analysis and Outlook
8.4. Asia Pacific Chrysanthemum Tea Revenue (USD Million) by Country (2021-2032)
8.4.1. China Chrysanthemum Tea Regional Analysis and Outlook
8.4.2. Japan Chrysanthemum Tea Regional Analysis and Outlook
8.4.3. India Chrysanthemum Tea Regional Analysis and Outlook
8.4.4. South Korea Chrysanthemum Tea Regional Analysis and Outlook
8.4.5. Australia Chrysanthemum Tea Regional Analysis and Outlook
8.4.6. South East Asia Chrysanthemum Tea Regional Analysis and Outlook
8.4.7. Rest of Asia Pacific Chrysanthemum Tea Regional Analysis and Outlook
8.5. South America Chrysanthemum Tea Revenue (USD Million), by Country (2021-2032)
8.5.1. Brazil Chrysanthemum Tea Regional Analysis and Outlook
8.5.2. Argentina Chrysanthemum Tea Regional Analysis and Outlook
8.5.3. Rest of South America Chrysanthemum Tea Regional Analysis and Outlook
8.6. Middle East and Africa Chrysanthemum Tea Revenue (USD Million) by Country (2021-2032)
8.6.1. Middle East Chrysanthemum Tea Regional Analysis and Outlook
8.6.2. Africa Chrysanthemum Tea Regional Analysis and Outlook
Chapter 9. North America Chrysanthemum Tea Analysis and Outlook
9.1. North America Chrysanthemum Tea Revenue (USD Million) by Segments (2021-2032)
9.1.1. North America Chrysanthemum Tea Revenue (USD Million) by Type (2021-2032)
9.1.2. North America Chrysanthemum Tea Revenue (USD Million) by Application (2021-2032)
9.1.3. North America Chrysanthemum Tea Revenue (USD Million) by Product (2021-2032)
By Type
Chrysanthemum Indicum
Chrysanthemum Morifolium
By Application
Retail
Catering
Chapter 10. Europe Chrysanthemum Tea Analysis and Outlook
10.1. Europe Chrysanthemum Tea Revenue (USD Million), by Segments (USD Million) (2021-2032)
10.1.1. Europe Chrysanthemum Tea Revenue (USD Million) by Type (2021-2032)
10.1.2. Europe Chrysanthemum Tea Revenue (USD Million) by Application (2021-2032)
10.1.3. Europe Chrysanthemum Tea Revenue (USD Million) by Product (2021-2032)
By Type
Chrysanthemum Indicum
Chrysanthemum Morifolium
By Application
Retail
Catering
Chapter 11. Asia Pacific Chrysanthemum Tea Analysis and Outlook
11.1. Asia Pacific Chrysanthemum Tea Revenue (USD Million), and Revenue (USD Million) by Segments (2021-2032)
11.1.1. Asia Pacific Chrysanthemum Tea Revenue (USD Million) by Type (2021-2032)
11.1.2. Asia Pacific Chrysanthemum Tea Revenue (USD Million) by Application (2021-2032)
11.1.3. Asia Pacific Chrysanthemum Tea Revenue (USD Million) by Product (2021-2032)
By Type
Chrysanthemum Indicum
Chrysanthemum Morifolium
By Application
Retail
Catering
Chapter 12. South America Chrysanthemum Tea Analysis and Outlook
12.1. South America Chrysanthemum Tea Revenue (USD Million), by Segments (2021-2032)
12.1.1. South America Chrysanthemum Tea Revenue (USD Million) by Type (2021-2032)
12.1.2. South America Chrysanthemum Tea Revenue (USD Million) by Application (2021-2032)
12.1.3. South America Chrysanthemum Tea Revenue (USD Million) by Product (2021-2032)
By Type
Chrysanthemum Indicum
Chrysanthemum Morifolium
By Application
Retail
Catering
Chapter 13. Middle East and Africa Chrysanthemum Tea Analysis and Outlook
13.1. Middle East and Africa Chrysanthemum Tea Revenue (USD Million), by Segments (2021-2032)
13.1.1. Middle East and Africa Chrysanthemum Tea Revenue (USD Million) by Type (2021-2032)
13.1.2. Middle East and Africa Chrysanthemum Tea Revenue (USD Million) by Application (2021-2032)
13.1.3. Middle East and Africa Chrysanthemum Tea Revenue (USD Million) by Product (2021-2032)
By Type
Chrysanthemum Indicum
Chrysanthemum Morifolium
By Application
Retail
Catering
Chapter 14. Chrysanthemum Tea Company Profiles
14.1 Business Overview
14.2 Product Profiles
14.3 SWOT Profiles
14.5 Recent Developments
14.6 Financial Profile
List of Companies
Anhui Yiyuan Herbal Pieces Technology
Changsha Ayhhed Biotechnology
Fujian Province Guangfu Tea
Hangzhou Anatta Tea
HelloYoung
Huangshan Greenxtract
Kangerfu Health Beverage Food
15. Methodology and Data Sources
15.1 Customization Offerings
15.2 Subscription Services
15.3 Related Reports
15.4 Publisher Expertise
LIST OF TABLES
Table 1 Market Segmentation Analysis
Table 2 Global Chrysanthemum Tea Market Share of Leading Companies, 2023
Table 3 Product Offerings of Leading Companies
Table 4 Low Growth Scenario Forecasts
Table 5 Reference Case Growth Scenario
Table 6 High Growth Case Scenario
Table 7 Global Chrysanthemum Tea Revenue (USD Million) And CAGR (%) By Type (2021-2032)
Table 8 Global Chrysanthemum Tea Revenue (USD Million) And CAGR (%) By Application (2021-2032)
Table 9 Global Chrysanthemum Tea Revenue (USD Million) And CAGR (%) By Product (2021-2032)
Table 10 Global Chrysanthemum Tea Market Revenue (USD Million) By Regions (2021-2032)
Table 11 Global Chrysanthemum Tea Market Share (%) By Regions (2021-2032)
Table 12 North America Chrysanthemum Tea Revenue (USD Million) By Country (2021-2032)
Table 13 Europe Chrysanthemum Tea Revenue (USD Million) By Country (2021-2032)
Table 14 Asia Pacific Chrysanthemum Tea Revenue (USD Million) By Country (2021-2032)
Table 15 South America Chrysanthemum Tea Revenue (USD Million) By Country (2021-2032)
Table 16 Middle East and Africa Chrysanthemum Tea Revenue (USD Million) By Region (2021-2032)
Table 17 North America Chrysanthemum Tea Revenue (USD Million) By Type (2021-2032)
Table 18 North America Chrysanthemum Tea Revenue (USD Million) By Application (2021-2032)
Table 19 North America Chrysanthemum Tea Revenue (USD Million) By Product (2021-2032)
Table 20 Europe Chrysanthemum Tea Revenue (USD Million) By Type (2021-2032)
Table 21 Europe Chrysanthemum Tea Revenue (USD Million) By Application (2021-2032)
Table 22 Europe Chrysanthemum Tea Revenue (USD Million) By Product (2021-2032)
Table 23 Asia Pacific Chrysanthemum Tea Revenue (USD Million) By Type (2021-2032)
Table 24 Asia Pacific Chrysanthemum Tea Revenue (USD Million) By Application (2021-2032)
Table 25 Asia Pacific Chrysanthemum Tea Revenue (USD Million) By Product (2021-2032)
Table 26 South America Chrysanthemum Tea Revenue (USD Million) By Type (2021-2032)
Table 27 South America Chrysanthemum Tea Revenue (USD Million) By Application (2021-2032)
Table 28 South America Chrysanthemum Tea Revenue (USD Million) By Product (2021-2032)
Table 29 Middle East and Africa Chrysanthemum Tea Revenue (USD Million) By Type (2021-2032)
Table 30 Middle East and Africa Chrysanthemum Tea Revenue (USD Million) By Application (2021-2032)
Table 31 Middle East and Africa Chrysanthemum Tea Revenue (USD Million) By Product (2021-2032)
LIST OF FIGURES
Figure 1. Market Scope
Figure 2. Pricing Forecasts Per Unit, 2023- 2032
Figure 3. Porter’s Five Forces
Figure 4. Global Chrysanthemum Tea Market Revenue (USD Million) By Regions (2021-2032)
Figure 5. Global Chrysanthemum Tea Market Share (%) By Regions (2023)
Figure 6. North America Chrysanthemum Tea Revenue (USD Million) By Country (2021-2032)
Figure 7. United States Chrysanthemum Tea Revenue (USD Million) By Country (2021-2032)
Figure 8. Canada Chrysanthemum Tea Revenue (USD Million) By Country (2021-2032)
Figure 9. Mexico Chrysanthemum Tea Revenue (USD Million) By Country (2021-2032)
Figure 10. Europe Chrysanthemum Tea Revenue (USD Million) By Country (2021-2032)
Figure 11. Germany Chrysanthemum Tea Revenue (USD Million) By Country (2021-2032)
Figure 12. France Chrysanthemum Tea Revenue (USD Million) By Country (2021-2032)
Figure 13. United Kingdom Chrysanthemum Tea Revenue (USD Million) By Country (2021-2032)
Figure 14. Spain Chrysanthemum Tea Revenue (USD Million) By Country (2021-2032)
Figure 15. Italy Chrysanthemum Tea Revenue (USD Million) By Country (2021-2032)
Figure 16. Russia Chrysanthemum Tea Revenue (USD Million) By Country (2021-2032)
Figure 17. Rest of Europe Chrysanthemum Tea Revenue (USD Million) By Country (2021-2032)
Figure 11. Asia Pacific Chrysanthemum Tea Revenue (USD Million) By Country (2021-2032)
Figure 12. China Chrysanthemum Tea Revenue (USD Million) By Country (2021-2032)
Figure 13. Japan Chrysanthemum Tea Revenue (USD Million) By Country (2021-2032)
Figure 14. India Chrysanthemum Tea Revenue (USD Million) By Country (2021-2032)
Figure 15. South Korea Chrysanthemum Tea Revenue (USD Million) By Country (2021-2032)
Figure 16. Australia Chrysanthemum Tea Revenue (USD Million) By Country (2021-2032)
Figure 17. South East Asia Chrysanthemum Tea Revenue (USD Million) By Country (2021-2032)
Figure 18. South America Chrysanthemum Tea Revenue (USD Million) By Country (2021-2032)
Figure 19. Brazil Chrysanthemum Tea Revenue (USD Million) By Country (2021-2032)
Figure 20. Argentina Chrysanthemum Tea Revenue (USD Million) By Country (2021-2032)
Figure 21. Rest of Asia Pacific Chrysanthemum Tea Revenue (USD Million) By Country (2021-2032)
Figure 22. Middle East and Africa Chrysanthemum Tea Revenue (USD Million) By Region (2021-2032)
Figure 23. Saudi Arabia Chrysanthemum Tea Revenue (USD Million) By Region (2021-2032)
Figure 24. The UAE Chrysanthemum Tea Revenue (USD Million) By Region (2021-2032)
Figure 25. Rest of Middle East Chrysanthemum Tea Revenue (USD Million) By Region (2021-2032)
Figure 26. South Africa Chrysanthemum Tea Revenue (USD Million) By Region (2021-2032)
Figure 27. Africa Chrysanthemum Tea Revenue (USD Million) By Region (2021-2032)
Figure 28. North America Chrysanthemum Tea Revenue (USD Million) By Type (2021-2032)
Figure 29. North America Chrysanthemum Tea Revenue (USD Million) By Application (2021-2032)
Figure 30. North America Chrysanthemum Tea Revenue (USD Million) By Product (2021-2032)
Figure 31. Europe Chrysanthemum Tea Revenue (USD Million) By Type (2021-2032)
Figure 32. Europe Chrysanthemum Tea Revenue (USD Million) By Application (2021-2032)
Figure 33. Europe Chrysanthemum Tea Revenue (USD Million) By Product (2021-2032)
Figure 34. Asia Pacific Chrysanthemum Tea Revenue (USD Million) By Type (2021-2032)
Figure 35. Asia Pacific Chrysanthemum Tea Revenue (USD Million) By Application (2021-2032)
Figure 36. Asia Pacific Chrysanthemum Tea Revenue (USD Million) By Product (2021-2032)
Figure 37. South America Chrysanthemum Tea Revenue (USD Million) By Type (2021-2032)
Figure 38. South America Chrysanthemum Tea Revenue (USD Million) By Application (2021-2032)
Figure 39. South America Chrysanthemum Tea Revenue (USD Million) By Product (2021-2032)
Figure 40. Middle East and Africa Chrysanthemum Tea Revenue (USD Million) By Type (2021-2032)
Figure 41. Middle East and Africa Chrysanthemum Tea Revenue (USD Million) By Application (2021-2032)
Figure 42. Middle East and Africa Chrysanthemum Tea Revenue (USD Million) By Product (2021-2032)
By Type
Chrysanthemum Indicum
Chrysanthemum Morifolium
By Application
Retail
Catering
Countries Analyzed
North America (US, Canada, Mexico)
Europe (Germany, UK, France, Spain, Italy, Russia, Rest of Europe)
Asia Pacific (China, India, Japan, South Korea, Australia, South East Asia, Rest of Asia)
South America (Brazil, Argentina, Rest of South America)
Middle East and Africa (Saudi Arabia, UAE, Rest of Middle East, South Africa, Egypt, Rest of Africa)
