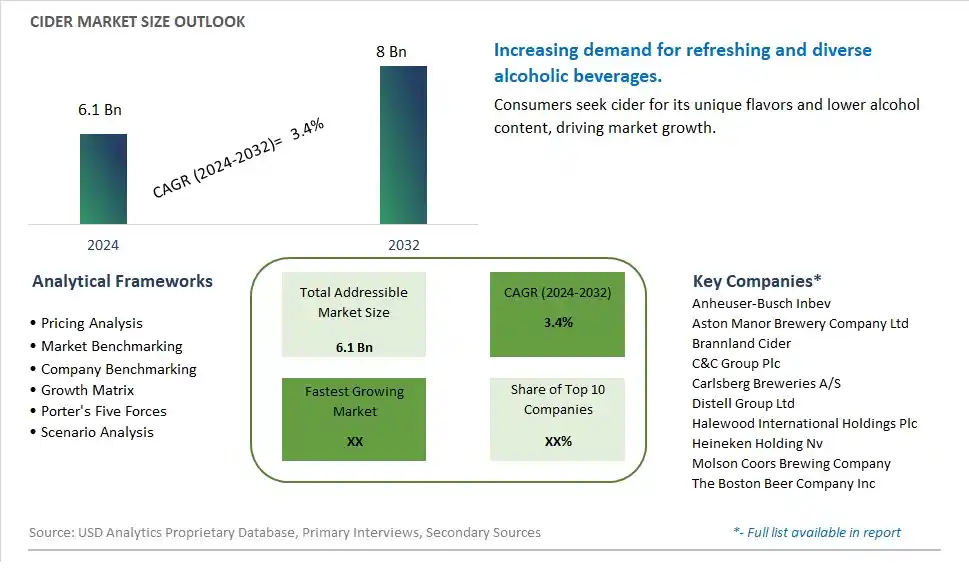
Global Cider Market Size is valued at $6.1 Billion in 2024 and is forecast to register a growth rate (CAGR) of 3.4% to reach $8 Billion by 2032.
The global Cider Market Comprehensive Study analyzes and forecasts the market size across 6 regions and 24 countries for diverse segments -By Type (Apple Flavored, Fruit Flavored, Perry), By Distribution Channel (On-trade, Off-trade), By Packaging (Draught, Cans, Glass Bottles, Plastic Bottles, Others)
An Introduction to Cider Market
The cider market continues to flourish in 2024, driven by evolving consumer preferences, the growing popularity of craft beverages, and the expanding market reach beyond traditional cider-producing regions. Cider, an alcoholic beverage made from fermented apple juice, appeals to a broad demographic with its refreshing taste, diverse flavor profiles, and artisanal appeal. With an increasing focus on premiumization and flavor innovation, cider producers are introducing a wide range of artisanal and flavored ciders to cater to changing consumer tastes and preferences. Furthermore, the rising demand for gluten-free and natural beverages is driving the adoption of cider as a healthier alternative to beer and wine, fueling market growth. As the cider market continues to evolve, manufacturers are leveraging sustainability initiatives, local sourcing, and eco-friendly packaging to differentiate their products and capture a larger market share.
Cider Competitive Landscape
The market report analyses the leading companies in the industry including Anheuser-Busch Inbev, Aston Manor Brewery Company Ltd, Brannland Cider, C&C Group Plc, Carlsberg Breweries A/S, Distell Group Ltd, Halewood International Holdings Plc, Heineken Holding Nv, Molson Coors Brewing Company, The Boston Beer Company Inc, and Others.
Cider Market Dynamics
Cider Market Trend: Increasing Consumer Preference for Craft and Artisanal Beverages
One prominent trend in the cider market is the increasing consumer preference for craft and artisanal beverages. As consumers seek unique and authentic drinking experiences, there's a growing interest in locally produced ciders made with high-quality ingredients and traditional production methods. Craft ciders, often crafted in small batches by independent producers, offer diverse flavor profiles, ranging from dry and crisp to sweet and fruity, appealing to a wide range of palates. This trend is driving the growth of the craft cider segment as consumers seek out premium and differentiated options in the cider market.
Market Driver: Health-Conscious Lifestyle Choices and Demand for Low-Alcohol Alternatives
A key driver in the cider market is the health-conscious lifestyle choices and the demand for low-alcohol alternatives. With increasing awareness of the impact of alcohol consumption on health and wellness, there's a rising interest in lower-alcohol beverages that offer a lighter drinking experience. Cider, with its lower alcohol content compared to many other alcoholic beverages such as beer and wine, is positioned as a favorable option for consumers seeking moderation without sacrificing flavor or enjoyment. This driver fuels market growth as cider brands innovate with lower-alcohol and sessionable cider variants, catering to health-conscious consumers looking for refreshing and sociable drink options.
Market Opportunity: Expansion into Flavored and Premium Cider Offerings
An emerging opportunity in the cider market is the expansion into flavored and premium cider offerings. Beyond traditional apple cider, there's potential to diversify product offerings with flavored ciders that appeal to evolving consumer preferences for variety and innovation. Flavored ciders, such as berry-infused, citrus-infused, or spiced variants, offer new taste experiences and broaden the appeal of cider to a wider audience, including younger consumers and those with adventurous palates. Additionally, there's an opportunity to target the premium segment of the market with high-quality, artisanal ciders made from specialty apple varieties and aged in oak barrels or infused with botanicals and herbs. By exploring new flavor profiles and premiumization strategies, cider producers can differentiate their offerings and capture market share in the competitive landscape of the cider market.
Cider Market Share Analysis: Apple Flavored held the dominant market share in 2024
In the diverse landscape of ciders, the Apple Flavored segment is the largest, commanding prominence due to its classic appeal, widespread availability, and longstanding popularity among consumers. Apple flavored cider, crafted primarily from fermented apple juice, embodies the quintessential essence of traditional cider-making techniques, offering a crisp and refreshing beverage experience cherished by cider enthusiasts. The natural sweetness and tartness of apples, coupled with the nuances of fermentation, create a balanced and flavorful profile that appeals to a broad spectrum of palates. Further, the established infrastructure of apple orchards and cider production facilities ensures consistent quality and availability of apple flavored ciders, further solidifying their dominance in the market. While fruit flavored ciders and perry offer unique taste profiles and artisanal variations, the Apple Flavored segment remains the cornerstone of the cider market, shaping consumer preferences and cider-making traditions globally.
Cider Market Share Analysis: Off-trade market is poised to register the fastest growth rae over the forecast period to 2032
Among the segments of the cider market, the Off-trade distribution channel is the fastest-growing, driven by shifting consumer preferences towards convenient at-home consumption and the increasing availability of cider in retail outlets. The Off-trade channel includes supermarkets/hypermarkets, specialist retailers, convenience stores, and online platforms, offering consumers a wide range of cider options for purchase outside of traditional bars and restaurants (On-trade). The convenience and accessibility of purchasing cider from Off-trade channels align with evolving consumer lifestyles and preferences, particularly amidst the COVID-19 pandemic, where at-home consumption has surged. Additionally, supermarkets and online retailers often provide a diverse selection of ciders from different brands and flavors, catering to various consumer tastes and preferences. As consumers continue to seek convenient and flexible shopping experiences, the Off-trade distribution channel of the cider market stands poised for continued growth, reshaping the way consumers access and enjoy their favorite beverages.
Cider Market Share Analysis: Glass Bottles held the dominant market share in 2024
In the dynamic landscape of cider packaging, the Glass Bottles segment is the largest, commanding prominence due to its traditional appeal, premium image, and environmental sustainability. Glass bottles have long been synonymous with cider packaging, embodying the craftsmanship and heritage of cider-making traditions. The transparency and clarity of glass showcase the vibrant colors and clarity of cider, enhancing its visual appeal and inviting consumers to savor the beverage within. Further, glass bottles are preferred by cider producers and consumers alike for their ability to preserve the taste and freshness of cider, as glass is impermeable to oxygen and other external factors that may affect flavor. Additionally, glass bottles are fully recyclable, aligning with the growing consumer preference for sustainable packaging options. While cans and plastic bottles offer convenience and portability, glass bottles remain the preferred choice for premium and artisanal ciders, solidifying their dominance in the market.
Cider Market Segmentation
By Type
Apple Flavored
Fruit Flavored
Perry
By Distribution Channel
On-trade
Off-trade
-Supermarkets/Hypermarkets
-Specialist Retailers
-Convenience Stores
-Others
By Packaging
Draught
Cans
Glass Bottles
Plastic Bottles
Others
Countries Analyzed
North America (US, Canada, Mexico)
Europe (Germany, UK, France, Spain, Italy, Russia, Rest of Europe)
Asia Pacific (China, India, Japan, South Korea, Australia, South East Asia, Rest of Asia)
South America (Brazil, Argentina, Rest of South America)
Middle East and Africa (Saudi Arabia, UAE, Rest of Middle East, South Africa, Egypt, Rest of Africa)
Cider Companies Profiled in the Study
Anheuser-Busch Inbev
Aston Manor Brewery Company Ltd
Brannland Cider
C&C Group Plc
Carlsberg Breweries A/S
Distell Group Ltd
Halewood International Holdings Plc
Heineken Holding Nv
Molson Coors Brewing Company
The Boston Beer Company Inc
*- List Not Exhaustive
Chapter 1. TABLE OF CONTENTS
Chapter 2. Introduction to Cider Market
2.1. Market Overview
2.2. Key Statistics and Report Highlights
2.3. Scope of the Comprehensive Study
2.3.1. Market Definition
2.3.2 Countries and Regions Covered
2.3.3 Research Objective
2.3.4 Units, Currency, and Conversions
2.3.5 Industry Value Chain
2.4. Key Market Segments
2.5. Key Companies
2.6. Study Period
Chapter 3. Strategic Analysis Review
3.1. Cider Pricing Analysis and Forecast
3.2. Porter’s Five Forces
3.3. Market Ecosystem
3.4. SWOT Analysis
3.5. Regulatory Scenario
3.3. Effects of Inflation, Russia-Ukraine War, moderating economic growth, and other macroeconomic factors
Chapter 4. Competitive Landscape
4.1. Market Share Analysis
4.1.1. Global Cider Market Share by Company, 2023
4.1.2. Product Offerings of Leading Cider Companies
4.2. Market Entropy
4.2.1. New Product Launches in the Industry
4.2.2. Mergers, Acquisitions, Joint ventures, and Partnerships
4.3. Key Strategies and Best Practices
Chapter 5. Global Market Projections: Best, Reference, and Low Case Scenarios
5.1. Growth Analysis- Case Scenario Definitions
5.2. Low Growth Case Scenario Forecasts
5.3. Reference Growth Case Scenario Forecasts
5.4. High Growth Case Scenario Forecasts
Chapter 6. Market Dynamics
6.1. Cider Market Drivers
6.2. Cider Market Challenges
6.6. Cider Market Opportunities
6.4. Cider Market Trends
Chapter 7. Global Cider Market Outlook Trends
7.1. Global Cider Revenue (USD Million) and CAGR (%) by Type (2021-2032)
7.2. Global Cider Revenue (USD Million) and CAGR (%) by Application (2021-2032)
7.3. Global Cider Revenue (USD Million) and CAGR (%) by Product (2021-2032)
By Type
Apple Flavored
Fruit Flavored
Perry
By Distribution Channel
On-trade
Off-trade
-Supermarkets/Hypermarkets
-Specialist Retailers
-Convenience Stores
-Others
By Packaging
Draught
Cans
Glass Bottles
Plastic Bottles
Others
Chapter 8. Global Cider Regional Analysis and Outlook
8.1. Global Cider Revenue (USD Million) By Regions (2021- 2032)
8.2. North America Cider Revenue (USD Million) by Country (2021-2032)
8.2.1. United States Cider Regional Analysis and Outlook
8.2.2. Canada Cider Regional Analysis and Outlook
8.2.3. Mexico Cider Regional Analysis and Outlook
8.3. Europe Cider Revenue (USD Million), by Country (2021-2032)
8.3.1. Germany Cider Regional Analysis and Outlook
8.3.2. France Cider Regional Analysis and Outlook
8.3.3. United Kingdom Cider Regional Analysis and Outlook
8.3.4. Spain Cider Regional Analysis and Outlook
8.3.5. Italy Cider Regional Analysis and Outlook
8.3.6. Russia Cider Regional Analysis and Outlook
8.3.7. Rest of Europe Cider Regional Analysis and Outlook
8.4. Asia Pacific Cider Revenue (USD Million) by Country (2021-2032)
8.4.1. China Cider Regional Analysis and Outlook
8.4.2. Japan Cider Regional Analysis and Outlook
8.4.3. India Cider Regional Analysis and Outlook
8.4.4. South Korea Cider Regional Analysis and Outlook
8.4.5. Australia Cider Regional Analysis and Outlook
8.4.6. South East Asia Cider Regional Analysis and Outlook
8.4.7. Rest of Asia Pacific Cider Regional Analysis and Outlook
8.5. South America Cider Revenue (USD Million), by Country (2021-2032)
8.5.1. Brazil Cider Regional Analysis and Outlook
8.5.2. Argentina Cider Regional Analysis and Outlook
8.5.3. Rest of South America Cider Regional Analysis and Outlook
8.6. Middle East and Africa Cider Revenue (USD Million) by Country (2021-2032)
8.6.1. Middle East Cider Regional Analysis and Outlook
8.6.2. Africa Cider Regional Analysis and Outlook
Chapter 9. North America Cider Analysis and Outlook
9.1. North America Cider Revenue (USD Million) by Segments (2021-2032)
9.1.1. North America Cider Revenue (USD Million) by Type (2021-2032)
9.1.2. North America Cider Revenue (USD Million) by Application (2021-2032)
9.1.3. North America Cider Revenue (USD Million) by Product (2021-2032)
By Type
Apple Flavored
Fruit Flavored
Perry
By Distribution Channel
On-trade
Off-trade
-Supermarkets/Hypermarkets
-Specialist Retailers
-Convenience Stores
-Others
By Packaging
Draught
Cans
Glass Bottles
Plastic Bottles
Others
Chapter 10. Europe Cider Analysis and Outlook
10.1. Europe Cider Revenue (USD Million), by Segments (USD Million) (2021-2032)
10.1.1. Europe Cider Revenue (USD Million) by Type (2021-2032)
10.1.2. Europe Cider Revenue (USD Million) by Application (2021-2032)
10.1.3. Europe Cider Revenue (USD Million) by Product (2021-2032)
By Type
Apple Flavored
Fruit Flavored
Perry
By Distribution Channel
On-trade
Off-trade
-Supermarkets/Hypermarkets
-Specialist Retailers
-Convenience Stores
-Others
By Packaging
Draught
Cans
Glass Bottles
Plastic Bottles
Others
Chapter 11. Asia Pacific Cider Analysis and Outlook
11.1. Asia Pacific Cider Revenue (USD Million), and Revenue (USD Million) by Segments (2021-2032)
11.1.1. Asia Pacific Cider Revenue (USD Million) by Type (2021-2032)
11.1.2. Asia Pacific Cider Revenue (USD Million) by Application (2021-2032)
11.1.3. Asia Pacific Cider Revenue (USD Million) by Product (2021-2032)
By Type
Apple Flavored
Fruit Flavored
Perry
By Distribution Channel
On-trade
Off-trade
-Supermarkets/Hypermarkets
-Specialist Retailers
-Convenience Stores
-Others
By Packaging
Draught
Cans
Glass Bottles
Plastic Bottles
Others
Chapter 12. South America Cider Analysis and Outlook
12.1. South America Cider Revenue (USD Million), by Segments (2021-2032)
12.1.1. South America Cider Revenue (USD Million) by Type (2021-2032)
12.1.2. South America Cider Revenue (USD Million) by Application (2021-2032)
12.1.3. South America Cider Revenue (USD Million) by Product (2021-2032)
By Type
Apple Flavored
Fruit Flavored
Perry
By Distribution Channel
On-trade
Off-trade
-Supermarkets/Hypermarkets
-Specialist Retailers
-Convenience Stores
-Others
By Packaging
Draught
Cans
Glass Bottles
Plastic Bottles
Others
Chapter 13. Middle East and Africa Cider Analysis and Outlook
13.1. Middle East and Africa Cider Revenue (USD Million), by Segments (2021-2032)
13.1.1. Middle East and Africa Cider Revenue (USD Million) by Type (2021-2032)
13.1.2. Middle East and Africa Cider Revenue (USD Million) by Application (2021-2032)
13.1.3. Middle East and Africa Cider Revenue (USD Million) by Product (2021-2032)
By Type
Apple Flavored
Fruit Flavored
Perry
By Distribution Channel
On-trade
Off-trade
-Supermarkets/Hypermarkets
-Specialist Retailers
-Convenience Stores
-Others
By Packaging
Draught
Cans
Glass Bottles
Plastic Bottles
Others
Chapter 14. Cider Company Profiles
14.1 Business Overview
14.2 Product Profiles
14.3 SWOT Profiles
14.5 Recent Developments
14.6 Financial Profile
List of Companies
Anheuser-Busch Inbev
Aston Manor Brewery Company Ltd
Brannland Cider
C&C Group Plc
Carlsberg Breweries A/S
Distell Group Ltd
Halewood International Holdings Plc
Heineken Holding Nv
Molson Coors Brewing Company
The Boston Beer Company Inc
15. Methodology and Data Sources
15.1 Customization Offerings
15.2 Subscription Services
15.3 Related Reports
15.4 Publisher Expertise
LIST OF TABLES
Table 1 Market Segmentation Analysis
Table 2 Global Cider Market Share of Leading Companies, 2023
Table 3 Product Offerings of Leading Companies
Table 4 Low Growth Scenario Forecasts
Table 5 Reference Case Growth Scenario
Table 6 High Growth Case Scenario
Table 7 Global Cider Revenue (USD Million) And CAGR (%) By Type (2021-2032)
Table 8 Global Cider Revenue (USD Million) And CAGR (%) By Application (2021-2032)
Table 9 Global Cider Revenue (USD Million) And CAGR (%) By Product (2021-2032)
Table 10 Global Cider Market Revenue (USD Million) By Regions (2021-2032)
Table 11 Global Cider Market Share (%) By Regions (2021-2032)
Table 12 North America Cider Revenue (USD Million) By Country (2021-2032)
Table 13 Europe Cider Revenue (USD Million) By Country (2021-2032)
Table 14 Asia Pacific Cider Revenue (USD Million) By Country (2021-2032)
Table 15 South America Cider Revenue (USD Million) By Country (2021-2032)
Table 16 Middle East and Africa Cider Revenue (USD Million) By Region (2021-2032)
Table 17 North America Cider Revenue (USD Million) By Type (2021-2032)
Table 18 North America Cider Revenue (USD Million) By Application (2021-2032)
Table 19 North America Cider Revenue (USD Million) By Product (2021-2032)
Table 20 Europe Cider Revenue (USD Million) By Type (2021-2032)
Table 21 Europe Cider Revenue (USD Million) By Application (2021-2032)
Table 22 Europe Cider Revenue (USD Million) By Product (2021-2032)
Table 23 Asia Pacific Cider Revenue (USD Million) By Type (2021-2032)
Table 24 Asia Pacific Cider Revenue (USD Million) By Application (2021-2032)
Table 25 Asia Pacific Cider Revenue (USD Million) By Product (2021-2032)
Table 26 South America Cider Revenue (USD Million) By Type (2021-2032)
Table 27 South America Cider Revenue (USD Million) By Application (2021-2032)
Table 28 South America Cider Revenue (USD Million) By Product (2021-2032)
Table 29 Middle East and Africa Cider Revenue (USD Million) By Type (2021-2032)
Table 30 Middle East and Africa Cider Revenue (USD Million) By Application (2021-2032)
Table 31 Middle East and Africa Cider Revenue (USD Million) By Product (2021-2032)
LIST OF FIGURES
Figure 1. Market Scope
Figure 2. Pricing Forecasts Per Unit, 2023- 2032
Figure 3. Porter’s Five Forces
Figure 4. Global Cider Market Revenue (USD Million) By Regions (2021-2032)
Figure 5. Global Cider Market Share (%) By Regions (2023)
Figure 6. North America Cider Revenue (USD Million) By Country (2021-2032)
Figure 7. United States Cider Revenue (USD Million) By Country (2021-2032)
Figure 8. Canada Cider Revenue (USD Million) By Country (2021-2032)
Figure 9. Mexico Cider Revenue (USD Million) By Country (2021-2032)
Figure 10. Europe Cider Revenue (USD Million) By Country (2021-2032)
Figure 11. Germany Cider Revenue (USD Million) By Country (2021-2032)
Figure 12. France Cider Revenue (USD Million) By Country (2021-2032)
Figure 13. United Kingdom Cider Revenue (USD Million) By Country (2021-2032)
Figure 14. Spain Cider Revenue (USD Million) By Country (2021-2032)
Figure 15. Italy Cider Revenue (USD Million) By Country (2021-2032)
Figure 16. Russia Cider Revenue (USD Million) By Country (2021-2032)
Figure 17. Rest of Europe Cider Revenue (USD Million) By Country (2021-2032)
Figure 11. Asia Pacific Cider Revenue (USD Million) By Country (2021-2032)
Figure 12. China Cider Revenue (USD Million) By Country (2021-2032)
Figure 13. Japan Cider Revenue (USD Million) By Country (2021-2032)
Figure 14. India Cider Revenue (USD Million) By Country (2021-2032)
Figure 15. South Korea Cider Revenue (USD Million) By Country (2021-2032)
Figure 16. Australia Cider Revenue (USD Million) By Country (2021-2032)
Figure 17. South East Asia Cider Revenue (USD Million) By Country (2021-2032)
Figure 18. South America Cider Revenue (USD Million) By Country (2021-2032)
Figure 19. Brazil Cider Revenue (USD Million) By Country (2021-2032)
Figure 20. Argentina Cider Revenue (USD Million) By Country (2021-2032)
Figure 21. Rest of Asia Pacific Cider Revenue (USD Million) By Country (2021-2032)
Figure 22. Middle East and Africa Cider Revenue (USD Million) By Region (2021-2032)
Figure 23. Saudi Arabia Cider Revenue (USD Million) By Region (2021-2032)
Figure 24. The UAE Cider Revenue (USD Million) By Region (2021-2032)
Figure 25. Rest of Middle East Cider Revenue (USD Million) By Region (2021-2032)
Figure 26. South Africa Cider Revenue (USD Million) By Region (2021-2032)
Figure 27. Africa Cider Revenue (USD Million) By Region (2021-2032)
Figure 28. North America Cider Revenue (USD Million) By Type (2021-2032)
Figure 29. North America Cider Revenue (USD Million) By Application (2021-2032)
Figure 30. North America Cider Revenue (USD Million) By Product (2021-2032)
Figure 31. Europe Cider Revenue (USD Million) By Type (2021-2032)
Figure 32. Europe Cider Revenue (USD Million) By Application (2021-2032)
Figure 33. Europe Cider Revenue (USD Million) By Product (2021-2032)
Figure 34. Asia Pacific Cider Revenue (USD Million) By Type (2021-2032)
Figure 35. Asia Pacific Cider Revenue (USD Million) By Application (2021-2032)
Figure 36. Asia Pacific Cider Revenue (USD Million) By Product (2021-2032)
Figure 37. South America Cider Revenue (USD Million) By Type (2021-2032)
Figure 38. South America Cider Revenue (USD Million) By Application (2021-2032)
Figure 39. South America Cider Revenue (USD Million) By Product (2021-2032)
Figure 40. Middle East and Africa Cider Revenue (USD Million) By Type (2021-2032)
Figure 41. Middle East and Africa Cider Revenue (USD Million) By Application (2021-2032)
Figure 42. Middle East and Africa Cider Revenue (USD Million) By Product (2021-2032)
By Type
Apple Flavored
Fruit Flavored
Perry
By Distribution Channel
On-trade
Off-trade
-Supermarkets/Hypermarkets
-Specialist Retailers
-Convenience Stores
-Others
By Packaging
Draught
Cans
Glass Bottles
Plastic Bottles
Others
Countries Analyzed
North America (US, Canada, Mexico)
Europe (Germany, UK, France, Spain, Italy, Russia, Rest of Europe)
Asia Pacific (China, India, Japan, South Korea, Australia, South East Asia, Rest of Asia)
South America (Brazil, Argentina, Rest of South America)
Middle East and Africa (Saudi Arabia, UAE, Rest of Middle East, South Africa, Egypt, Rest of Africa)
