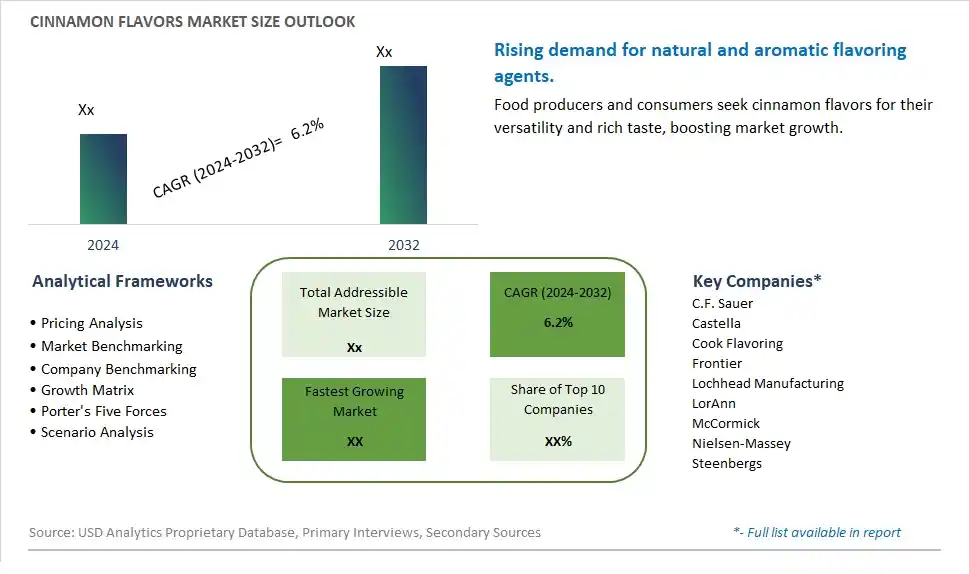
Global Cinnamon Flavors Market Size is valued at $XX Million in 2024 and is forecast to register a growth rate (CAGR) of 6.2% to reach $XX Million by 2032.
The global Cinnamon Flavors Market Comprehensive Study analyzes and forecasts the market size across 6 regions and 24 countries for diverse segments -By Type (Liquid, Powder), By Application (Food Processing, Commercial, Residential)
An Introduction to Cinnamon Flavors Market
In 2024, the Cinnamon Flavors market is witnessing significant growth, driven by the increasing demand for warm, aromatic flavors in various culinary and beverage applications. Cinnamon flavors, used in products such as baked goods, beverages, confections, and savory dishes, are popular for their versatile and comforting taste. The market is supported by the growing trend towards clean-label and natural flavorings. Advances in flavor formulation and delivery technologies are enhancing the quality, intensity, and stability of cinnamon flavors. The market is also benefiting from the trend towards premium and artisanal food products, appealing to consumers seeking high-quality and authentic cinnamon flavors.
Cinnamon Flavors Competitive Landscape
The market report analyses the leading companies in the industry including C.F. Sauer, Castella, Cook Flavoring, Frontier, Lochhead Manufacturing, LorAnn, McCormick, Nielsen-Massey, Steenbergs, and Others.
Cinnamon Flavors Market Dynamics
Cinnamon Flavors Market Trend: Growing Preference for Natural and Authentic Flavors
A prominent market trend for cinnamon flavors is the growing preference among consumers for natural and authentic flavors in food and beverages. With increasing demand for clean label products and transparency in ingredient sourcing, there's a rising popularity of cinnamon flavors derived from real cinnamon extracts or natural sources. Consumers seek genuine and rich cinnamon taste profiles in various culinary creations, including bakery items, desserts, beverages, and savory dishes, driving the demand for authentic cinnamon flavors in the market.
Cinnamon Flavors Market Driver: Culinary Innovation and Flavor Diversification
A key driver fueling the market for cinnamon flavors is culinary innovation and flavor diversification in the food and beverage industry. Chefs, food manufacturers, and beverage companies are incorporating cinnamon flavors into their products to add warmth, depth, and complexity to recipes. The versatility of cinnamon flavors allows for creative applications in sweet and savory dishes, seasonal offerings, and specialty beverages, meeting consumer expectations for unique taste experiences and sensory enjoyment.
Cinnamon Flavors Market Opportunity: Expansion into Plant-Based and Health-Conscious Markets
An opportunity within the cinnamon flavors market lies in expansion into plant-based and health-conscious markets. Manufacturers can develop cinnamon flavor formulations using natural extracts, essential oils, or plant-derived compounds to cater to consumers seeking plant-based alternatives and clean label products. Additionally, exploring cinnamon flavors with added health benefits, such as antioxidants, anti-inflammatory properties, or blood sugar management support, can target health-conscious consumers looking for functional ingredients in their food and beverage choices. By tapping into the demand for authentic, plant-based, and health-promoting cinnamon flavors, companies can capitalize on the market opportunity presented by evolving consumer preferences and industry trends.
Cinnamon Flavors Market Share Analysis: Powder segment generated the highest revenue share in the industry
The Powder segment is the largest in the Cinnamon Flavors Market by type. This segment's dominance is driven by the extensive use and versatility of cinnamon powder in various culinary applications. Cinnamon powder is a popular ingredient in baking, cooking, and beverage preparation due to its ease of use and ability to blend seamlessly into recipes. It is widely utilized in baked goods, desserts, cereals, spice blends, and even in savory dishes. The long shelf life of cinnamon powder and its intense flavor make it a preferred choice for both home cooks and commercial food producers. Additionally, the health benefits associated with cinnamon, such as its antioxidant and anti-inflammatory properties, further boost its popularity. The widespread availability and convenience of cinnamon powder solidify its position as the largest segment in the cinnamon flavors market.
Cinnamon Flavors Market Share Analysis: Food Processing is the fastest growing segment over the forecast period to 2032
The Food Processing segment is projected to be the fastest growing in the Cinnamon Flavors Market by application through 2032. This rapid growth is driven by the increasing demand for natural and flavorful ingredients in the food industry. Cinnamon flavors are extensively used in food processing to enhance the taste and aroma of a wide range of products, including baked goods, confectionery, dairy products, beverages, and snacks. The trend towards clean label products, where consumers seek natural and recognizable ingredients, is a significant factor driving the demand for cinnamon flavors in food processing. Further, the growing awareness of the health benefits of cinnamon, such as its potential to regulate blood sugar levels and provide antioxidant support, makes it an attractive ingredient for health-oriented food products. Food manufacturers are increasingly incorporating cinnamon flavors to meet consumer preferences for tasty yet healthy options. As the food processing industry continues to innovate and cater to evolving consumer tastes, the use of cinnamon flavors is expected to grow significantly, making the Food Processing segment the fastest growing application in the market.
Cinnamon Flavors Market Segmentation
By Type
Liquid
Powder
By Application
Food Processing
Commercial
Residential
Countries Analyzed
North America (US, Canada, Mexico)
Europe (Germany, UK, France, Spain, Italy, Russia, Rest of Europe)
Asia Pacific (China, India, Japan, South Korea, Australia, South East Asia, Rest of Asia)
South America (Brazil, Argentina, Rest of South America)
Middle East and Africa (Saudi Arabia, UAE, Rest of Middle East, South Africa, Egypt, Rest of Africa)
Cinnamon Flavors Companies Profiled in the Study
C.F. Sauer
Castella
Cook Flavoring
Frontier
Lochhead Manufacturing
LorAnn
McCormick
Nielsen-Massey
Steenbergs
*- List Not Exhaustive
Chapter 1. TABLE OF CONTENTS
Chapter 2. Introduction to Cinnamon Flavors Market
2.1. Market Overview
2.2. Key Statistics and Report Highlights
2.3. Scope of the Comprehensive Study
2.3.1. Market Definition
2.3.2 Countries and Regions Covered
2.3.3 Research Objective
2.3.4 Units, Currency, and Conversions
2.3.5 Industry Value Chain
2.4. Key Market Segments
2.5. Key Companies
2.6. Study Period
Chapter 3. Strategic Analysis Review
3.1. Cinnamon Flavors Pricing Analysis and Forecast
3.2. Porter’s Five Forces
3.3. Market Ecosystem
3.4. SWOT Analysis
3.5. Regulatory Scenario
3.3. Effects of Inflation, Russia-Ukraine War, moderating economic growth, and other macroeconomic factors
Chapter 4. Competitive Landscape
4.1. Market Share Analysis
4.1.1. Global Cinnamon Flavors Market Share by Company, 2023
4.1.2. Product Offerings of Leading Cinnamon Flavors Companies
4.2. Market Entropy
4.2.1. New Product Launches in the Industry
4.2.2. Mergers, Acquisitions, Joint ventures, and Partnerships
4.3. Key Strategies and Best Practices
Chapter 5. Global Market Projections: Best, Reference, and Low Case Scenarios
5.1. Growth Analysis- Case Scenario Definitions
5.2. Low Growth Case Scenario Forecasts
5.3. Reference Growth Case Scenario Forecasts
5.4. High Growth Case Scenario Forecasts
Chapter 6. Market Dynamics
6.1. Cinnamon Flavors Market Drivers
6.2. Cinnamon Flavors Market Challenges
6.6. Cinnamon Flavors Market Opportunities
6.4. Cinnamon Flavors Market Trends
Chapter 7. Global Cinnamon Flavors Market Outlook Trends
7.1. Global Cinnamon Flavors Revenue (USD Million) and CAGR (%) by Type (2021-2032)
7.2. Global Cinnamon Flavors Revenue (USD Million) and CAGR (%) by Application (2021-2032)
7.3. Global Cinnamon Flavors Revenue (USD Million) and CAGR (%) by Product (2021-2032)
By Type
Liquid
Powder
By Application
Food Processing
Commercial
Residential
Chapter 8. Global Cinnamon Flavors Regional Analysis and Outlook
8.1. Global Cinnamon Flavors Revenue (USD Million) By Regions (2021- 2032)
8.2. North America Cinnamon Flavors Revenue (USD Million) by Country (2021-2032)
8.2.1. United States Cinnamon Flavors Regional Analysis and Outlook
8.2.2. Canada Cinnamon Flavors Regional Analysis and Outlook
8.2.3. Mexico Cinnamon Flavors Regional Analysis and Outlook
8.3. Europe Cinnamon Flavors Revenue (USD Million), by Country (2021-2032)
8.3.1. Germany Cinnamon Flavors Regional Analysis and Outlook
8.3.2. France Cinnamon Flavors Regional Analysis and Outlook
8.3.3. United Kingdom Cinnamon Flavors Regional Analysis and Outlook
8.3.4. Spain Cinnamon Flavors Regional Analysis and Outlook
8.3.5. Italy Cinnamon Flavors Regional Analysis and Outlook
8.3.6. Russia Cinnamon Flavors Regional Analysis and Outlook
8.3.7. Rest of Europe Cinnamon Flavors Regional Analysis and Outlook
8.4. Asia Pacific Cinnamon Flavors Revenue (USD Million) by Country (2021-2032)
8.4.1. China Cinnamon Flavors Regional Analysis and Outlook
8.4.2. Japan Cinnamon Flavors Regional Analysis and Outlook
8.4.3. India Cinnamon Flavors Regional Analysis and Outlook
8.4.4. South Korea Cinnamon Flavors Regional Analysis and Outlook
8.4.5. Australia Cinnamon Flavors Regional Analysis and Outlook
8.4.6. South East Asia Cinnamon Flavors Regional Analysis and Outlook
8.4.7. Rest of Asia Pacific Cinnamon Flavors Regional Analysis and Outlook
8.5. South America Cinnamon Flavors Revenue (USD Million), by Country (2021-2032)
8.5.1. Brazil Cinnamon Flavors Regional Analysis and Outlook
8.5.2. Argentina Cinnamon Flavors Regional Analysis and Outlook
8.5.3. Rest of South America Cinnamon Flavors Regional Analysis and Outlook
8.6. Middle East and Africa Cinnamon Flavors Revenue (USD Million) by Country (2021-2032)
8.6.1. Middle East Cinnamon Flavors Regional Analysis and Outlook
8.6.2. Africa Cinnamon Flavors Regional Analysis and Outlook
Chapter 9. North America Cinnamon Flavors Analysis and Outlook
9.1. North America Cinnamon Flavors Revenue (USD Million) by Segments (2021-2032)
9.1.1. North America Cinnamon Flavors Revenue (USD Million) by Type (2021-2032)
9.1.2. North America Cinnamon Flavors Revenue (USD Million) by Application (2021-2032)
9.1.3. North America Cinnamon Flavors Revenue (USD Million) by Product (2021-2032)
By Type
Liquid
Powder
By Application
Food Processing
Commercial
Residential
Chapter 10. Europe Cinnamon Flavors Analysis and Outlook
10.1. Europe Cinnamon Flavors Revenue (USD Million), by Segments (USD Million) (2021-2032)
10.1.1. Europe Cinnamon Flavors Revenue (USD Million) by Type (2021-2032)
10.1.2. Europe Cinnamon Flavors Revenue (USD Million) by Application (2021-2032)
10.1.3. Europe Cinnamon Flavors Revenue (USD Million) by Product (2021-2032)
By Type
Liquid
Powder
By Application
Food Processing
Commercial
Residential
Chapter 11. Asia Pacific Cinnamon Flavors Analysis and Outlook
11.1. Asia Pacific Cinnamon Flavors Revenue (USD Million), and Revenue (USD Million) by Segments (2021-2032)
11.1.1. Asia Pacific Cinnamon Flavors Revenue (USD Million) by Type (2021-2032)
11.1.2. Asia Pacific Cinnamon Flavors Revenue (USD Million) by Application (2021-2032)
11.1.3. Asia Pacific Cinnamon Flavors Revenue (USD Million) by Product (2021-2032)
By Type
Liquid
Powder
By Application
Food Processing
Commercial
Residential
Chapter 12. South America Cinnamon Flavors Analysis and Outlook
12.1. South America Cinnamon Flavors Revenue (USD Million), by Segments (2021-2032)
12.1.1. South America Cinnamon Flavors Revenue (USD Million) by Type (2021-2032)
12.1.2. South America Cinnamon Flavors Revenue (USD Million) by Application (2021-2032)
12.1.3. South America Cinnamon Flavors Revenue (USD Million) by Product (2021-2032)
By Type
Liquid
Powder
By Application
Food Processing
Commercial
Residential
Chapter 13. Middle East and Africa Cinnamon Flavors Analysis and Outlook
13.1. Middle East and Africa Cinnamon Flavors Revenue (USD Million), by Segments (2021-2032)
13.1.1. Middle East and Africa Cinnamon Flavors Revenue (USD Million) by Type (2021-2032)
13.1.2. Middle East and Africa Cinnamon Flavors Revenue (USD Million) by Application (2021-2032)
13.1.3. Middle East and Africa Cinnamon Flavors Revenue (USD Million) by Product (2021-2032)
By Type
Liquid
Powder
By Application
Food Processing
Commercial
Residential
Chapter 14. Cinnamon Flavors Company Profiles
14.1 Business Overview
14.2 Product Profiles
14.3 SWOT Profiles
14.5 Recent Developments
14.6 Financial Profile
List of Companies
C.F. Sauer
Castella
Cook Flavoring
Frontier
Lochhead Manufacturing
LorAnn
McCormick
Nielsen-Massey
Steenbergs
15. Methodology and Data Sources
15.1 Customization Offerings
15.2 Subscription Services
15.3 Related Reports
15.4 Publisher Expertise
LIST OF TABLES
Table 1 Market Segmentation Analysis
Table 2 Global Cinnamon Flavors Market Share of Leading Companies, 2023
Table 3 Product Offerings of Leading Companies
Table 4 Low Growth Scenario Forecasts
Table 5 Reference Case Growth Scenario
Table 6 High Growth Case Scenario
Table 7 Global Cinnamon Flavors Revenue (USD Million) And CAGR (%) By Type (2021-2032)
Table 8 Global Cinnamon Flavors Revenue (USD Million) And CAGR (%) By Application (2021-2032)
Table 9 Global Cinnamon Flavors Revenue (USD Million) And CAGR (%) By Product (2021-2032)
Table 10 Global Cinnamon Flavors Market Revenue (USD Million) By Regions (2021-2032)
Table 11 Global Cinnamon Flavors Market Share (%) By Regions (2021-2032)
Table 12 North America Cinnamon Flavors Revenue (USD Million) By Country (2021-2032)
Table 13 Europe Cinnamon Flavors Revenue (USD Million) By Country (2021-2032)
Table 14 Asia Pacific Cinnamon Flavors Revenue (USD Million) By Country (2021-2032)
Table 15 South America Cinnamon Flavors Revenue (USD Million) By Country (2021-2032)
Table 16 Middle East and Africa Cinnamon Flavors Revenue (USD Million) By Region (2021-2032)
Table 17 North America Cinnamon Flavors Revenue (USD Million) By Type (2021-2032)
Table 18 North America Cinnamon Flavors Revenue (USD Million) By Application (2021-2032)
Table 19 North America Cinnamon Flavors Revenue (USD Million) By Product (2021-2032)
Table 20 Europe Cinnamon Flavors Revenue (USD Million) By Type (2021-2032)
Table 21 Europe Cinnamon Flavors Revenue (USD Million) By Application (2021-2032)
Table 22 Europe Cinnamon Flavors Revenue (USD Million) By Product (2021-2032)
Table 23 Asia Pacific Cinnamon Flavors Revenue (USD Million) By Type (2021-2032)
Table 24 Asia Pacific Cinnamon Flavors Revenue (USD Million) By Application (2021-2032)
Table 25 Asia Pacific Cinnamon Flavors Revenue (USD Million) By Product (2021-2032)
Table 26 South America Cinnamon Flavors Revenue (USD Million) By Type (2021-2032)
Table 27 South America Cinnamon Flavors Revenue (USD Million) By Application (2021-2032)
Table 28 South America Cinnamon Flavors Revenue (USD Million) By Product (2021-2032)
Table 29 Middle East and Africa Cinnamon Flavors Revenue (USD Million) By Type (2021-2032)
Table 30 Middle East and Africa Cinnamon Flavors Revenue (USD Million) By Application (2021-2032)
Table 31 Middle East and Africa Cinnamon Flavors Revenue (USD Million) By Product (2021-2032)
LIST OF FIGURES
Figure 1. Market Scope
Figure 2. Pricing Forecasts Per Unit, 2023- 2032
Figure 3. Porter’s Five Forces
Figure 4. Global Cinnamon Flavors Market Revenue (USD Million) By Regions (2021-2032)
Figure 5. Global Cinnamon Flavors Market Share (%) By Regions (2023)
Figure 6. North America Cinnamon Flavors Revenue (USD Million) By Country (2021-2032)
Figure 7. United States Cinnamon Flavors Revenue (USD Million) By Country (2021-2032)
Figure 8. Canada Cinnamon Flavors Revenue (USD Million) By Country (2021-2032)
Figure 9. Mexico Cinnamon Flavors Revenue (USD Million) By Country (2021-2032)
Figure 10. Europe Cinnamon Flavors Revenue (USD Million) By Country (2021-2032)
Figure 11. Germany Cinnamon Flavors Revenue (USD Million) By Country (2021-2032)
Figure 12. France Cinnamon Flavors Revenue (USD Million) By Country (2021-2032)
Figure 13. United Kingdom Cinnamon Flavors Revenue (USD Million) By Country (2021-2032)
Figure 14. Spain Cinnamon Flavors Revenue (USD Million) By Country (2021-2032)
Figure 15. Italy Cinnamon Flavors Revenue (USD Million) By Country (2021-2032)
Figure 16. Russia Cinnamon Flavors Revenue (USD Million) By Country (2021-2032)
Figure 17. Rest of Europe Cinnamon Flavors Revenue (USD Million) By Country (2021-2032)
Figure 11. Asia Pacific Cinnamon Flavors Revenue (USD Million) By Country (2021-2032)
Figure 12. China Cinnamon Flavors Revenue (USD Million) By Country (2021-2032)
Figure 13. Japan Cinnamon Flavors Revenue (USD Million) By Country (2021-2032)
Figure 14. India Cinnamon Flavors Revenue (USD Million) By Country (2021-2032)
Figure 15. South Korea Cinnamon Flavors Revenue (USD Million) By Country (2021-2032)
Figure 16. Australia Cinnamon Flavors Revenue (USD Million) By Country (2021-2032)
Figure 17. South East Asia Cinnamon Flavors Revenue (USD Million) By Country (2021-2032)
Figure 18. South America Cinnamon Flavors Revenue (USD Million) By Country (2021-2032)
Figure 19. Brazil Cinnamon Flavors Revenue (USD Million) By Country (2021-2032)
Figure 20. Argentina Cinnamon Flavors Revenue (USD Million) By Country (2021-2032)
Figure 21. Rest of Asia Pacific Cinnamon Flavors Revenue (USD Million) By Country (2021-2032)
Figure 22. Middle East and Africa Cinnamon Flavors Revenue (USD Million) By Region (2021-2032)
Figure 23. Saudi Arabia Cinnamon Flavors Revenue (USD Million) By Region (2021-2032)
Figure 24. The UAE Cinnamon Flavors Revenue (USD Million) By Region (2021-2032)
Figure 25. Rest of Middle East Cinnamon Flavors Revenue (USD Million) By Region (2021-2032)
Figure 26. South Africa Cinnamon Flavors Revenue (USD Million) By Region (2021-2032)
Figure 27. Africa Cinnamon Flavors Revenue (USD Million) By Region (2021-2032)
Figure 28. North America Cinnamon Flavors Revenue (USD Million) By Type (2021-2032)
Figure 29. North America Cinnamon Flavors Revenue (USD Million) By Application (2021-2032)
Figure 30. North America Cinnamon Flavors Revenue (USD Million) By Product (2021-2032)
Figure 31. Europe Cinnamon Flavors Revenue (USD Million) By Type (2021-2032)
Figure 32. Europe Cinnamon Flavors Revenue (USD Million) By Application (2021-2032)
Figure 33. Europe Cinnamon Flavors Revenue (USD Million) By Product (2021-2032)
Figure 34. Asia Pacific Cinnamon Flavors Revenue (USD Million) By Type (2021-2032)
Figure 35. Asia Pacific Cinnamon Flavors Revenue (USD Million) By Application (2021-2032)
Figure 36. Asia Pacific Cinnamon Flavors Revenue (USD Million) By Product (2021-2032)
Figure 37. South America Cinnamon Flavors Revenue (USD Million) By Type (2021-2032)
Figure 38. South America Cinnamon Flavors Revenue (USD Million) By Application (2021-2032)
Figure 39. South America Cinnamon Flavors Revenue (USD Million) By Product (2021-2032)
Figure 40. Middle East and Africa Cinnamon Flavors Revenue (USD Million) By Type (2021-2032)
Figure 41. Middle East and Africa Cinnamon Flavors Revenue (USD Million) By Application (2021-2032)
Figure 42. Middle East and Africa Cinnamon Flavors Revenue (USD Million) By Product (2021-2032)
By Type
Liquid
Powder
By Application
Food Processing
Commercial
Residential
Countries Analyzed
North America (US, Canada, Mexico)
Europe (Germany, UK, France, Spain, Italy, Russia, Rest of Europe)
Asia Pacific (China, India, Japan, South Korea, Australia, South East Asia, Rest of Asia)
South America (Brazil, Argentina, Rest of South America)
Middle East and Africa (Saudi Arabia, UAE, Rest of Middle East, South Africa, Egypt, Rest of Africa)
