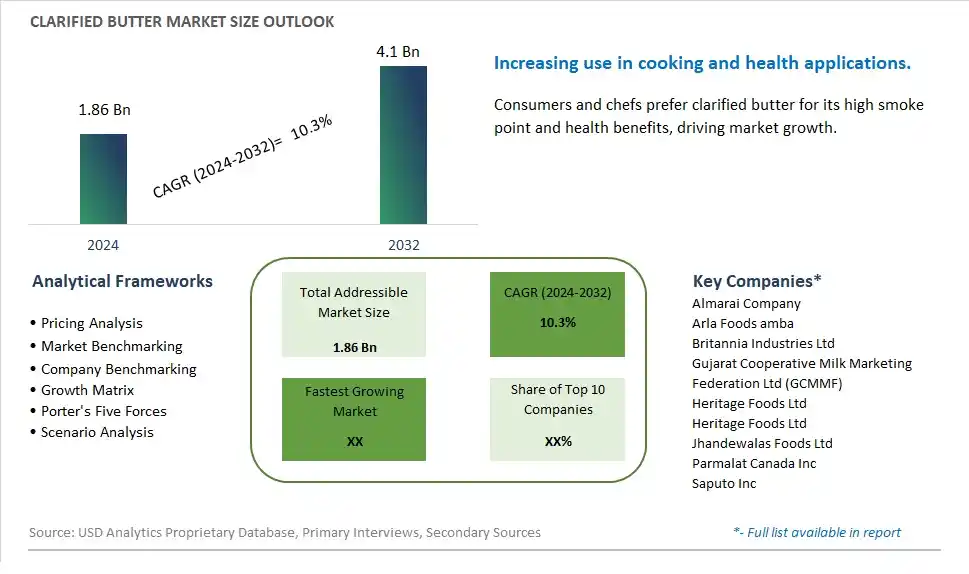
Global Clarified Butter Market Size is valued at $1.86 Billion in 2024 and is forecast to register a growth rate (CAGR) of 10.3% to reach $4.1 Billion by 2032.
The global Clarified Butter Market Comprehensive Study analyzes and forecasts the market size across 6 regions and 24 countries for diverse segments -By Product (Conventional, Flavored), By Application (B2B, B2C), By Distribution Channel (Online, Offline)
An Introduction to Clarified Butter Market
In 2024, the clarified butter market is flourishing as consumers increasingly seek out traditional and healthier cooking alternatives. Clarified butter, known for its rich, nutty flavor and higher smoke point compared to regular butter, is becoming a favorite among culinary enthusiasts and professional chefs alike. The market growth is also supported by the rising trend of ketogenic and paleo diets, which emphasize high-fat, low-carbohydrate food choices. Moreover, clarified butter's long shelf life and absence of lactose and casein make it a preferred option for those with dairy sensitivities. Innovations in packaging and the availability of organic and grass-fed options are further boosting its popularity.
Clarified Butter Competitive Landscape
The market report analyses the leading companies in the industry including Almarai Company, Arla Foods amba, Britannia Industries Ltd, Gujarat Cooperative Milk Marketing Federation Ltd (GCMMF), Heritage Foods Ltd, Heritage Foods Ltd, Jhandewalas Foods Ltd, Parmalat Canada Inc, Saputo Inc, and Others.
Clarified Butter Market Dynamics
Clarified Butter Market Trend: Growing Popularity of Traditional and Artisanal Food Products
The most prominent market trend in the clarified butter industry is the growing popularity of traditional and artisanal food products. As consumers seek authentic and natural ingredients with minimal processing, there is a resurgence of interest in traditional cooking methods and artisanal food products like clarified butter, also known as ghee. Clarified butter is revered for its rich, nutty flavor, high smoke point, and versatility in culinary applications. This trend is driven by consumers' desire for premium-quality ingredients, as well as their appreciation for the cultural heritage and culinary traditions associated with clarified butter in various cuisines worldwide.
Market Driver: Demand for Healthier Cooking Fats and Ingredients
The primary market driver for clarified butter is the increasing demand for healthier cooking fats and ingredients. Clarified butter is prized for its unique nutritional profile, containing higher levels of beneficial compounds such as conjugated linoleic acid (CLA) and butyric acid compared to regular butter. It is also free from lactose and casein, making it suitable for individuals with dairy sensitivities. As consumers become more health-conscious and seek alternatives to highly processed cooking oils and fats, clarified butter emerges as a natural and wholesome option that offers both flavor and functional benefits. This driver underscores the importance of health and wellness considerations in driving consumer preferences for cooking fats and ingredients.
Market Opportunity: Positioning Clarified Butter as a Premium Culinary Ingredient
An opportunity for the clarified butter market lies in positioning it as a premium culinary ingredient with diverse applications beyond traditional cooking. Manufacturers can leverage the unique flavor profile and functional properties of clarified butter to target both professional chefs and home cooks looking to elevate their culinary creations. By emphasizing the superior taste, aroma, and texture of clarified butter, companies can position it as a premium alternative to other cooking fats and oils in the market. Additionally, there is an opportunity to innovate with flavored and infused varieties of clarified butter, as well as ready-to-use culinary products such as clarified butter spreads, cooking sprays, and baking mixes. This approach can help expand the consumer base for clarified butter and unlock new opportunities for growth in the culinary and specialty food sectors.
Clarified Butter Market Share Analysis: Conventional held the dominant market share in 2024
Within the Clarified Butter Market, the Conventional segment stands out as the largest segment. Conventional clarified butter, also known as ghee, holds a dominant position due to its traditional use in various cuisines worldwide and its versatile applications in cooking, baking, and food preparation. It has been a staple ingredient in many cultures for centuries, valued for its rich flavor, high smoke point, and extended shelf life. Further, conventional clarified butter is widely preferred for its purity, as it undergoes a meticulous clarification process that removes milk solids and water content, resulting in a pure, golden liquid with a distinct nutty aroma. With consumers increasingly embracing natural and traditional food products, the demand for conventional clarified butter remains robust, contributing significantly to its prominence as the largest segment in the Clarified Butter Market.
Clarified Butter Market Share Analysis: B2C market is poised to register the fastest growth rae over the forecast period to 2032
The B2C segment is the fastest-growing segment in the Clarified Butter Market. This growth can be attributed to several factors, including the rising consumer awareness regarding the health benefits of clarified butter, such as its high smoke point and potential lactose intolerance compatibility. Additionally, the increasing popularity of traditional and ethnic cuisines in various regions around the globe has led to a surge in demand for clarified butter among households. Further, the convenience of purchasing clarified butter directly from retail outlets, supermarkets, and online platforms further fuels the growth of the B2C segment. As consumers seek high-quality, natural ingredients for their culinary endeavors, the demand for clarified butter in the retail sector continues to witness a steady rise, making the B2C segment a key driver of growth in the Clarified Butter Market.
Clarified Butter Market Share Analysis: Offline held the dominant market share in 2024
The Offline segment stands as the largest segment in the Clarified Butter Market. This dominance is primarily driven by the widespread availability of clarified butter through traditional brick-and-mortar retail channels such as supermarkets, hypermarkets, specialty stores, and local grocery stores. Offline distribution channels offer consumers the advantage of immediate access to a wide range of clarified butter products, allowing them to make informed purchasing decisions based on factors such as brand reputation, price, and product quality. Additionally, offline channels often provide personalized customer service, allowing consumers to seek advice and recommendations from store staff. Despite the increasing popularity of online shopping, particularly in urban areas, offline distribution channels continue to cater to a significant portion of the market, making it the largest segment in the Clarified Butter Market.
Clarified Butter Market Segmentation
By Product
Conventional
Flavored
By Application
B2B
B2C
By Distribution Channel
Online
Offline
Countries Analyzed
North America (US, Canada, Mexico)
Europe (Germany, UK, France, Spain, Italy, Russia, Rest of Europe)
Asia Pacific (China, India, Japan, South Korea, Australia, South East Asia, Rest of Asia)
South America (Brazil, Argentina, Rest of South America)
Middle East and Africa (Saudi Arabia, UAE, Rest of Middle East, South Africa, Egypt, Rest of Africa)
Clarified Butter Companies Profiled in the Study
Almarai Company
Arla Foods amba
Britannia Industries Ltd
Gujarat Cooperative Milk Marketing Federation Ltd (GCMMF)
Heritage Foods Ltd
Heritage Foods Ltd
Jhandewalas Foods Ltd
Parmalat Canada Inc
Saputo Inc
*- List Not Exhaustive
Chapter 1. TABLE OF CONTENTS
Chapter 2. Introduction to Clarified Butter Market
2.1. Market Overview
2.2. Key Statistics and Report Highlights
2.3. Scope of the Comprehensive Study
2.3.1. Market Definition
2.3.2 Countries and Regions Covered
2.3.3 Research Objective
2.3.4 Units, Currency, and Conversions
2.3.5 Industry Value Chain
2.4. Key Market Segments
2.5. Key Companies
2.6. Study Period
Chapter 3. Strategic Analysis Review
3.1. Clarified Butter Pricing Analysis and Forecast
3.2. Porter’s Five Forces
3.3. Market Ecosystem
3.4. SWOT Analysis
3.5. Regulatory Scenario
3.3. Effects of Inflation, Russia-Ukraine War, moderating economic growth, and other macroeconomic factors
Chapter 4. Competitive Landscape
4.1. Market Share Analysis
4.1.1. Global Clarified Butter Market Share by Company, 2023
4.1.2. Product Offerings of Leading Clarified Butter Companies
4.2. Market Entropy
4.2.1. New Product Launches in the Industry
4.2.2. Mergers, Acquisitions, Joint ventures, and Partnerships
4.3. Key Strategies and Best Practices
Chapter 5. Global Market Projections: Best, Reference, and Low Case Scenarios
5.1. Growth Analysis- Case Scenario Definitions
5.2. Low Growth Case Scenario Forecasts
5.3. Reference Growth Case Scenario Forecasts
5.4. High Growth Case Scenario Forecasts
Chapter 6. Market Dynamics
6.1. Clarified Butter Market Drivers
6.2. Clarified Butter Market Challenges
6.6. Clarified Butter Market Opportunities
6.4. Clarified Butter Market Trends
Chapter 7. Global Clarified Butter Market Outlook Trends
7.1. Global Clarified Butter Revenue (USD Million) and CAGR (%) by Type (2021-2032)
7.2. Global Clarified Butter Revenue (USD Million) and CAGR (%) by Application (2021-2032)
7.3. Global Clarified Butter Revenue (USD Million) and CAGR (%) by Product (2021-2032)
By Product
Conventional
Flavored
By Application
B2B
B2C
By Distribution Channel
Online
Offline
Chapter 8. Global Clarified Butter Regional Analysis and Outlook
8.1. Global Clarified Butter Revenue (USD Million) By Regions (2021- 2032)
8.2. North America Clarified Butter Revenue (USD Million) by Country (2021-2032)
8.2.1. United States Clarified Butter Regional Analysis and Outlook
8.2.2. Canada Clarified Butter Regional Analysis and Outlook
8.2.3. Mexico Clarified Butter Regional Analysis and Outlook
8.3. Europe Clarified Butter Revenue (USD Million), by Country (2021-2032)
8.3.1. Germany Clarified Butter Regional Analysis and Outlook
8.3.2. France Clarified Butter Regional Analysis and Outlook
8.3.3. United Kingdom Clarified Butter Regional Analysis and Outlook
8.3.4. Spain Clarified Butter Regional Analysis and Outlook
8.3.5. Italy Clarified Butter Regional Analysis and Outlook
8.3.6. Russia Clarified Butter Regional Analysis and Outlook
8.3.7. Rest of Europe Clarified Butter Regional Analysis and Outlook
8.4. Asia Pacific Clarified Butter Revenue (USD Million) by Country (2021-2032)
8.4.1. China Clarified Butter Regional Analysis and Outlook
8.4.2. Japan Clarified Butter Regional Analysis and Outlook
8.4.3. India Clarified Butter Regional Analysis and Outlook
8.4.4. South Korea Clarified Butter Regional Analysis and Outlook
8.4.5. Australia Clarified Butter Regional Analysis and Outlook
8.4.6. South East Asia Clarified Butter Regional Analysis and Outlook
8.4.7. Rest of Asia Pacific Clarified Butter Regional Analysis and Outlook
8.5. South America Clarified Butter Revenue (USD Million), by Country (2021-2032)
8.5.1. Brazil Clarified Butter Regional Analysis and Outlook
8.5.2. Argentina Clarified Butter Regional Analysis and Outlook
8.5.3. Rest of South America Clarified Butter Regional Analysis and Outlook
8.6. Middle East and Africa Clarified Butter Revenue (USD Million) by Country (2021-2032)
8.6.1. Middle East Clarified Butter Regional Analysis and Outlook
8.6.2. Africa Clarified Butter Regional Analysis and Outlook
Chapter 9. North America Clarified Butter Analysis and Outlook
9.1. North America Clarified Butter Revenue (USD Million) by Segments (2021-2032)
9.1.1. North America Clarified Butter Revenue (USD Million) by Type (2021-2032)
9.1.2. North America Clarified Butter Revenue (USD Million) by Application (2021-2032)
9.1.3. North America Clarified Butter Revenue (USD Million) by Product (2021-2032)
By Product
Conventional
Flavored
By Application
B2B
B2C
By Distribution Channel
Online
Offline
Chapter 10. Europe Clarified Butter Analysis and Outlook
10.1. Europe Clarified Butter Revenue (USD Million), by Segments (USD Million) (2021-2032)
10.1.1. Europe Clarified Butter Revenue (USD Million) by Type (2021-2032)
10.1.2. Europe Clarified Butter Revenue (USD Million) by Application (2021-2032)
10.1.3. Europe Clarified Butter Revenue (USD Million) by Product (2021-2032)
By Product
Conventional
Flavored
By Application
B2B
B2C
By Distribution Channel
Online
Offline
Chapter 11. Asia Pacific Clarified Butter Analysis and Outlook
11.1. Asia Pacific Clarified Butter Revenue (USD Million), and Revenue (USD Million) by Segments (2021-2032)
11.1.1. Asia Pacific Clarified Butter Revenue (USD Million) by Type (2021-2032)
11.1.2. Asia Pacific Clarified Butter Revenue (USD Million) by Application (2021-2032)
11.1.3. Asia Pacific Clarified Butter Revenue (USD Million) by Product (2021-2032)
By Product
Conventional
Flavored
By Application
B2B
B2C
By Distribution Channel
Online
Offline
Chapter 12. South America Clarified Butter Analysis and Outlook
12.1. South America Clarified Butter Revenue (USD Million), by Segments (2021-2032)
12.1.1. South America Clarified Butter Revenue (USD Million) by Type (2021-2032)
12.1.2. South America Clarified Butter Revenue (USD Million) by Application (2021-2032)
12.1.3. South America Clarified Butter Revenue (USD Million) by Product (2021-2032)
By Product
Conventional
Flavored
By Application
B2B
B2C
By Distribution Channel
Online
Offline
Chapter 13. Middle East and Africa Clarified Butter Analysis and Outlook
13.1. Middle East and Africa Clarified Butter Revenue (USD Million), by Segments (2021-2032)
13.1.1. Middle East and Africa Clarified Butter Revenue (USD Million) by Type (2021-2032)
13.1.2. Middle East and Africa Clarified Butter Revenue (USD Million) by Application (2021-2032)
13.1.3. Middle East and Africa Clarified Butter Revenue (USD Million) by Product (2021-2032)
By Product
Conventional
Flavored
By Application
B2B
B2C
By Distribution Channel
Online
Offline
Chapter 14. Clarified Butter Company Profiles
14.1 Business Overview
14.2 Product Profiles
14.3 SWOT Profiles
14.5 Recent Developments
14.6 Financial Profile
List of Companies
Almarai Company
Arla Foods amba
Britannia Industries Ltd
Gujarat Cooperative Milk Marketing Federation Ltd (GCMMF)
Heritage Foods Ltd
Heritage Foods Ltd
Jhandewalas Foods Ltd
Parmalat Canada Inc
Saputo Inc
15. Methodology and Data Sources
15.1 Customization Offerings
15.2 Subscription Services
15.3 Related Reports
15.4 Publisher Expertise
LIST OF TABLES
Table 1 Market Segmentation Analysis
Table 2 Global Clarified Butter Market Share of Leading Companies, 2023
Table 3 Product Offerings of Leading Companies
Table 4 Low Growth Scenario Forecasts
Table 5 Reference Case Growth Scenario
Table 6 High Growth Case Scenario
Table 7 Global Clarified Butter Revenue (USD Million) And CAGR (%) By Type (2021-2032)
Table 8 Global Clarified Butter Revenue (USD Million) And CAGR (%) By Application (2021-2032)
Table 9 Global Clarified Butter Revenue (USD Million) And CAGR (%) By Product (2021-2032)
Table 10 Global Clarified Butter Market Revenue (USD Million) By Regions (2021-2032)
Table 11 Global Clarified Butter Market Share (%) By Regions (2021-2032)
Table 12 North America Clarified Butter Revenue (USD Million) By Country (2021-2032)
Table 13 Europe Clarified Butter Revenue (USD Million) By Country (2021-2032)
Table 14 Asia Pacific Clarified Butter Revenue (USD Million) By Country (2021-2032)
Table 15 South America Clarified Butter Revenue (USD Million) By Country (2021-2032)
Table 16 Middle East and Africa Clarified Butter Revenue (USD Million) By Region (2021-2032)
Table 17 North America Clarified Butter Revenue (USD Million) By Type (2021-2032)
Table 18 North America Clarified Butter Revenue (USD Million) By Application (2021-2032)
Table 19 North America Clarified Butter Revenue (USD Million) By Product (2021-2032)
Table 20 Europe Clarified Butter Revenue (USD Million) By Type (2021-2032)
Table 21 Europe Clarified Butter Revenue (USD Million) By Application (2021-2032)
Table 22 Europe Clarified Butter Revenue (USD Million) By Product (2021-2032)
Table 23 Asia Pacific Clarified Butter Revenue (USD Million) By Type (2021-2032)
Table 24 Asia Pacific Clarified Butter Revenue (USD Million) By Application (2021-2032)
Table 25 Asia Pacific Clarified Butter Revenue (USD Million) By Product (2021-2032)
Table 26 South America Clarified Butter Revenue (USD Million) By Type (2021-2032)
Table 27 South America Clarified Butter Revenue (USD Million) By Application (2021-2032)
Table 28 South America Clarified Butter Revenue (USD Million) By Product (2021-2032)
Table 29 Middle East and Africa Clarified Butter Revenue (USD Million) By Type (2021-2032)
Table 30 Middle East and Africa Clarified Butter Revenue (USD Million) By Application (2021-2032)
Table 31 Middle East and Africa Clarified Butter Revenue (USD Million) By Product (2021-2032)
LIST OF FIGURES
Figure 1. Market Scope
Figure 2. Pricing Forecasts Per Unit, 2023- 2032
Figure 3. Porter’s Five Forces
Figure 4. Global Clarified Butter Market Revenue (USD Million) By Regions (2021-2032)
Figure 5. Global Clarified Butter Market Share (%) By Regions (2023)
Figure 6. North America Clarified Butter Revenue (USD Million) By Country (2021-2032)
Figure 7. United States Clarified Butter Revenue (USD Million) By Country (2021-2032)
Figure 8. Canada Clarified Butter Revenue (USD Million) By Country (2021-2032)
Figure 9. Mexico Clarified Butter Revenue (USD Million) By Country (2021-2032)
Figure 10. Europe Clarified Butter Revenue (USD Million) By Country (2021-2032)
Figure 11. Germany Clarified Butter Revenue (USD Million) By Country (2021-2032)
Figure 12. France Clarified Butter Revenue (USD Million) By Country (2021-2032)
Figure 13. United Kingdom Clarified Butter Revenue (USD Million) By Country (2021-2032)
Figure 14. Spain Clarified Butter Revenue (USD Million) By Country (2021-2032)
Figure 15. Italy Clarified Butter Revenue (USD Million) By Country (2021-2032)
Figure 16. Russia Clarified Butter Revenue (USD Million) By Country (2021-2032)
Figure 17. Rest of Europe Clarified Butter Revenue (USD Million) By Country (2021-2032)
Figure 11. Asia Pacific Clarified Butter Revenue (USD Million) By Country (2021-2032)
Figure 12. China Clarified Butter Revenue (USD Million) By Country (2021-2032)
Figure 13. Japan Clarified Butter Revenue (USD Million) By Country (2021-2032)
Figure 14. India Clarified Butter Revenue (USD Million) By Country (2021-2032)
Figure 15. South Korea Clarified Butter Revenue (USD Million) By Country (2021-2032)
Figure 16. Australia Clarified Butter Revenue (USD Million) By Country (2021-2032)
Figure 17. South East Asia Clarified Butter Revenue (USD Million) By Country (2021-2032)
Figure 18. South America Clarified Butter Revenue (USD Million) By Country (2021-2032)
Figure 19. Brazil Clarified Butter Revenue (USD Million) By Country (2021-2032)
Figure 20. Argentina Clarified Butter Revenue (USD Million) By Country (2021-2032)
Figure 21. Rest of Asia Pacific Clarified Butter Revenue (USD Million) By Country (2021-2032)
Figure 22. Middle East and Africa Clarified Butter Revenue (USD Million) By Region (2021-2032)
Figure 23. Saudi Arabia Clarified Butter Revenue (USD Million) By Region (2021-2032)
Figure 24. The UAE Clarified Butter Revenue (USD Million) By Region (2021-2032)
Figure 25. Rest of Middle East Clarified Butter Revenue (USD Million) By Region (2021-2032)
Figure 26. South Africa Clarified Butter Revenue (USD Million) By Region (2021-2032)
Figure 27. Africa Clarified Butter Revenue (USD Million) By Region (2021-2032)
Figure 28. North America Clarified Butter Revenue (USD Million) By Type (2021-2032)
Figure 29. North America Clarified Butter Revenue (USD Million) By Application (2021-2032)
Figure 30. North America Clarified Butter Revenue (USD Million) By Product (2021-2032)
Figure 31. Europe Clarified Butter Revenue (USD Million) By Type (2021-2032)
Figure 32. Europe Clarified Butter Revenue (USD Million) By Application (2021-2032)
Figure 33. Europe Clarified Butter Revenue (USD Million) By Product (2021-2032)
Figure 34. Asia Pacific Clarified Butter Revenue (USD Million) By Type (2021-2032)
Figure 35. Asia Pacific Clarified Butter Revenue (USD Million) By Application (2021-2032)
Figure 36. Asia Pacific Clarified Butter Revenue (USD Million) By Product (2021-2032)
Figure 37. South America Clarified Butter Revenue (USD Million) By Type (2021-2032)
Figure 38. South America Clarified Butter Revenue (USD Million) By Application (2021-2032)
Figure 39. South America Clarified Butter Revenue (USD Million) By Product (2021-2032)
Figure 40. Middle East and Africa Clarified Butter Revenue (USD Million) By Type (2021-2032)
Figure 41. Middle East and Africa Clarified Butter Revenue (USD Million) By Application (2021-2032)
Figure 42. Middle East and Africa Clarified Butter Revenue (USD Million) By Product (2021-2032)
By Product
Conventional
Flavored
By Application
B2B
B2C
By Distribution Channel
Online
Offline
Countries Analyzed
North America (US, Canada, Mexico)
Europe (Germany, UK, France, Spain, Italy, Russia, Rest of Europe)
Asia Pacific (China, India, Japan, South Korea, Australia, South East Asia, Rest of Asia)
South America (Brazil, Argentina, Rest of South America)
Middle East and Africa (Saudi Arabia, UAE, Rest of Middle East, South Africa, Egypt, Rest of Africa)
