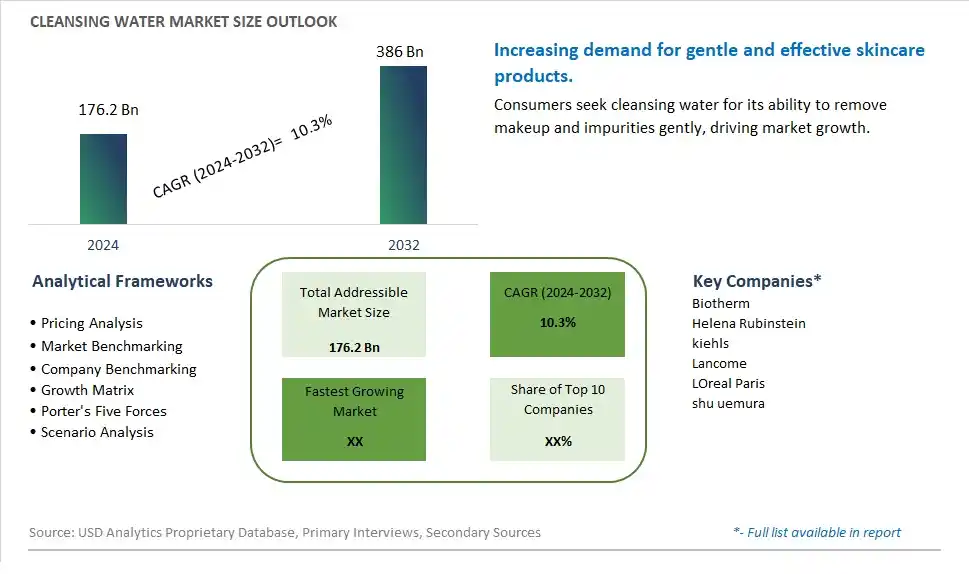
Global Cleansing Water Market Size is valued at $176.2 Billion in 2024 and is forecast to register a growth rate (CAGR) of 10.3% to reach $386 Billion by 2032.
The global Cleansing Water Market Comprehensive Study analyzes and forecasts the market size across 6 regions and 24 countries for diverse segments -By Type (Oily Skin, Dry Skin, Combination Skin), By Application (Male, Female)
An Introduction to Cleansing Water Market
In 2024, the Cleansing Water market is witnessing robust growth, driven by the increasing demand for gentle, effective, and convenient skincare solutions. Cleansing water, often referred to as micellar water, is popular for its ability to remove makeup, dirt, and impurities without the need for rinsing. The market is supported by the growing trend towards minimalistic skincare routines and the demand for multifunctional beauty products. Advances in formulation technology are enhancing the efficacy, safety, and skin-friendly properties of cleansing water. The market is also benefiting from the trend towards clean-label and natural skincare products, appealing to consumers seeking high-quality and gentle cleansing options.
Cleansing Water Competitive Landscape
The market report analyses the leading companies in the industry including Biotherm, Helena Rubinstein, kiehls, Lancome, LOreal Paris, shu uemura, and Others.
Cleansing Water Market Dynamics
Cleansing Water Market Trend: Shift Towards Gentle and Effective Skincare Solutions
A prominent market trend for cleansing water is the shift towards gentle and effective skincare solutions. With increasing awareness of skincare routines and the importance of gentle cleansing, there's a rising preference among consumers for cleansing water products that offer thorough yet gentle removal of dirt, oil, and makeup without stripping the skin's natural moisture. Consumers seek skincare products that promote skin health and hydration, driving the popularity of cleansing water in the market.
Cleansing Water Market Driver: Rise in Beauty and Self-Care Consciousness
A key driver fueling the market for cleansing water is the rise in beauty and self-care consciousness among consumers. As individuals prioritize skincare regimens and seek products that contribute to healthy, radiant skin, there's a demand for gentle yet effective cleansing options like cleansing water. The market responds to this driver by offering a variety of cleansing water formulations suitable for different skin types, concerns, and preferences, catering to the diverse needs of beauty-conscious consumers.
Cleansing Water Market Opportunity: Expansion into Sustainable and Eco-Friendly Skincare
An opportunity within the cleansing water market lies in expansion into sustainable and eco-friendly skincare solutions. Manufacturers can develop cleansing water products with sustainable packaging, natural and biodegradable ingredients, and eco-conscious production practices to appeal to environmentally aware consumers. Additionally, exploring innovative formulations with added skincare benefits such as hydration, soothing properties, or antioxidant protection can further enhance the market appeal and differentiate cleansing water products in the competitive skincare market. By aligning with sustainability trends and offering effective yet gentle cleansing solutions, companies can capitalize on the market opportunity presented by cleansing water and contribute to the growing demand for sustainable beauty products.
Cleansing Water Market Share Analysis: Oily Skin segment generated the highest revenue share in the industry
The Oily Skin segment emerges as the largest segment in the Cleansing Water Market. This segment's prominence is driven by several factors contributing to its substantial market share. Oily skin individuals often require specialized skincare products to effectively remove excess oil, dirt, and impurities without stripping away essential moisture. Cleansing water formulated specifically for oily skin addresses these concerns by providing a gentle yet effective cleansing action, helping to unclog pores and prevent breakouts. The growing awareness of skincare routines and the importance of maintaining balanced skin has propelled the demand for cleansing water tailored for oily skin types. Additionally, the rise in pollution levels and environmental factors affecting skin health has further boosted the adoption of cleansing water among consumers with oily skin concerns. With continuous product innovation and formulations targeting specific skin types, the Oily Skin segment is poised for sustained growth and market leadership in the Cleansing Water Market.
Cleansing Water Market Share Analysis: Female is the fastest growing segment over the forecast period to 2032
The Female segment is anticipated to be the fastest-growing segment in the Cleansing Water Market by 2032. This rapid growth can be attributed to several key factors driving the demand for cleansing water among women. Firstly, women are increasingly adopting comprehensive skincare routines, including cleansing, toning, and moisturizing, to maintain healthy and radiant skin. Cleansing water offers a convenient and effective solution for removing makeup, dirt, and impurities without harsh chemicals or excessive drying, making it a preferred choice among female consumers. Additionally, the rising focus on natural and gentle skincare products has boosted the popularity of cleansing water formulations tailored to different skin types and concerns, catering to the diverse needs of female consumers. Further, the increasing awareness of environmental factors and the importance of skincare as part of self-care routines have further contributed to the growth of the Female segment in the Cleansing Water Market. With continuous product innovation and marketing efforts targeting female demographics, this segment is poised for significant growth and market expansion in the coming years.
Cleansing Water Market Segmentation
By Type
Oily Skin
Dry Skin
Combination Skin
By Application
Male
Female
Countries Analyzed
North America (US, Canada, Mexico)
Europe (Germany, UK, France, Spain, Italy, Russia, Rest of Europe)
Asia Pacific (China, India, Japan, South Korea, Australia, South East Asia, Rest of Asia)
South America (Brazil, Argentina, Rest of South America)
Middle East and Africa (Saudi Arabia, UAE, Rest of Middle East, South Africa, Egypt, Rest of Africa)
Cleansing Water Companies Profiled in the Study
Biotherm
Helena Rubinstein
kiehls
Lancome
LOreal Paris
shu uemura
*- List Not Exhaustive
Chapter 1. TABLE OF CONTENTS
Chapter 2. Introduction to Cleansing Water Market
2.1. Market Overview
2.2. Key Statistics and Report Highlights
2.3. Scope of the Comprehensive Study
2.3.1. Market Definition
2.3.2 Countries and Regions Covered
2.3.3 Research Objective
2.3.4 Units, Currency, and Conversions
2.3.5 Industry Value Chain
2.4. Key Market Segments
2.5. Key Companies
2.6. Study Period
Chapter 3. Strategic Analysis Review
3.1. Cleansing Water Pricing Analysis and Forecast
3.2. Porter’s Five Forces
3.3. Market Ecosystem
3.4. SWOT Analysis
3.5. Regulatory Scenario
3.3. Effects of Inflation, Russia-Ukraine War, moderating economic growth, and other macroeconomic factors
Chapter 4. Competitive Landscape
4.1. Market Share Analysis
4.1.1. Global Cleansing Water Market Share by Company, 2023
4.1.2. Product Offerings of Leading Cleansing Water Companies
4.2. Market Entropy
4.2.1. New Product Launches in the Industry
4.2.2. Mergers, Acquisitions, Joint ventures, and Partnerships
4.3. Key Strategies and Best Practices
Chapter 5. Global Market Projections: Best, Reference, and Low Case Scenarios
5.1. Growth Analysis- Case Scenario Definitions
5.2. Low Growth Case Scenario Forecasts
5.3. Reference Growth Case Scenario Forecasts
5.4. High Growth Case Scenario Forecasts
Chapter 6. Market Dynamics
6.1. Cleansing Water Market Drivers
6.2. Cleansing Water Market Challenges
6.6. Cleansing Water Market Opportunities
6.4. Cleansing Water Market Trends
Chapter 7. Global Cleansing Water Market Outlook Trends
7.1. Global Cleansing Water Revenue (USD Million) and CAGR (%) by Type (2021-2032)
7.2. Global Cleansing Water Revenue (USD Million) and CAGR (%) by Application (2021-2032)
7.3. Global Cleansing Water Revenue (USD Million) and CAGR (%) by Product (2021-2032)
By Type
Oily Skin
Dry Skin
Combination Skin
By Application
Male
Female
Chapter 8. Global Cleansing Water Regional Analysis and Outlook
8.1. Global Cleansing Water Revenue (USD Million) By Regions (2021- 2032)
8.2. North America Cleansing Water Revenue (USD Million) by Country (2021-2032)
8.2.1. United States Cleansing Water Regional Analysis and Outlook
8.2.2. Canada Cleansing Water Regional Analysis and Outlook
8.2.3. Mexico Cleansing Water Regional Analysis and Outlook
8.3. Europe Cleansing Water Revenue (USD Million), by Country (2021-2032)
8.3.1. Germany Cleansing Water Regional Analysis and Outlook
8.3.2. France Cleansing Water Regional Analysis and Outlook
8.3.3. United Kingdom Cleansing Water Regional Analysis and Outlook
8.3.4. Spain Cleansing Water Regional Analysis and Outlook
8.3.5. Italy Cleansing Water Regional Analysis and Outlook
8.3.6. Russia Cleansing Water Regional Analysis and Outlook
8.3.7. Rest of Europe Cleansing Water Regional Analysis and Outlook
8.4. Asia Pacific Cleansing Water Revenue (USD Million) by Country (2021-2032)
8.4.1. China Cleansing Water Regional Analysis and Outlook
8.4.2. Japan Cleansing Water Regional Analysis and Outlook
8.4.3. India Cleansing Water Regional Analysis and Outlook
8.4.4. South Korea Cleansing Water Regional Analysis and Outlook
8.4.5. Australia Cleansing Water Regional Analysis and Outlook
8.4.6. South East Asia Cleansing Water Regional Analysis and Outlook
8.4.7. Rest of Asia Pacific Cleansing Water Regional Analysis and Outlook
8.5. South America Cleansing Water Revenue (USD Million), by Country (2021-2032)
8.5.1. Brazil Cleansing Water Regional Analysis and Outlook
8.5.2. Argentina Cleansing Water Regional Analysis and Outlook
8.5.3. Rest of South America Cleansing Water Regional Analysis and Outlook
8.6. Middle East and Africa Cleansing Water Revenue (USD Million) by Country (2021-2032)
8.6.1. Middle East Cleansing Water Regional Analysis and Outlook
8.6.2. Africa Cleansing Water Regional Analysis and Outlook
Chapter 9. North America Cleansing Water Analysis and Outlook
9.1. North America Cleansing Water Revenue (USD Million) by Segments (2021-2032)
9.1.1. North America Cleansing Water Revenue (USD Million) by Type (2021-2032)
9.1.2. North America Cleansing Water Revenue (USD Million) by Application (2021-2032)
9.1.3. North America Cleansing Water Revenue (USD Million) by Product (2021-2032)
By Type
Oily Skin
Dry Skin
Combination Skin
By Application
Male
Female
Chapter 10. Europe Cleansing Water Analysis and Outlook
10.1. Europe Cleansing Water Revenue (USD Million), by Segments (USD Million) (2021-2032)
10.1.1. Europe Cleansing Water Revenue (USD Million) by Type (2021-2032)
10.1.2. Europe Cleansing Water Revenue (USD Million) by Application (2021-2032)
10.1.3. Europe Cleansing Water Revenue (USD Million) by Product (2021-2032)
By Type
Oily Skin
Dry Skin
Combination Skin
By Application
Male
Female
Chapter 11. Asia Pacific Cleansing Water Analysis and Outlook
11.1. Asia Pacific Cleansing Water Revenue (USD Million), and Revenue (USD Million) by Segments (2021-2032)
11.1.1. Asia Pacific Cleansing Water Revenue (USD Million) by Type (2021-2032)
11.1.2. Asia Pacific Cleansing Water Revenue (USD Million) by Application (2021-2032)
11.1.3. Asia Pacific Cleansing Water Revenue (USD Million) by Product (2021-2032)
By Type
Oily Skin
Dry Skin
Combination Skin
By Application
Male
Female
Chapter 12. South America Cleansing Water Analysis and Outlook
12.1. South America Cleansing Water Revenue (USD Million), by Segments (2021-2032)
12.1.1. South America Cleansing Water Revenue (USD Million) by Type (2021-2032)
12.1.2. South America Cleansing Water Revenue (USD Million) by Application (2021-2032)
12.1.3. South America Cleansing Water Revenue (USD Million) by Product (2021-2032)
By Type
Oily Skin
Dry Skin
Combination Skin
By Application
Male
Female
Chapter 13. Middle East and Africa Cleansing Water Analysis and Outlook
13.1. Middle East and Africa Cleansing Water Revenue (USD Million), by Segments (2021-2032)
13.1.1. Middle East and Africa Cleansing Water Revenue (USD Million) by Type (2021-2032)
13.1.2. Middle East and Africa Cleansing Water Revenue (USD Million) by Application (2021-2032)
13.1.3. Middle East and Africa Cleansing Water Revenue (USD Million) by Product (2021-2032)
By Type
Oily Skin
Dry Skin
Combination Skin
By Application
Male
Female
Chapter 14. Cleansing Water Company Profiles
14.1 Business Overview
14.2 Product Profiles
14.3 SWOT Profiles
14.5 Recent Developments
14.6 Financial Profile
List of Companies
Biotherm
Helena Rubinstein
kiehls
Lancome
LOreal Paris
shu uemura
15. Methodology and Data Sources
15.1 Customization Offerings
15.2 Subscription Services
15.3 Related Reports
15.4 Publisher Expertise
LIST OF TABLES
Table 1 Market Segmentation Analysis
Table 2 Global Cleansing Water Market Share of Leading Companies, 2023
Table 3 Product Offerings of Leading Companies
Table 4 Low Growth Scenario Forecasts
Table 5 Reference Case Growth Scenario
Table 6 High Growth Case Scenario
Table 7 Global Cleansing Water Revenue (USD Million) And CAGR (%) By Type (2021-2032)
Table 8 Global Cleansing Water Revenue (USD Million) And CAGR (%) By Application (2021-2032)
Table 9 Global Cleansing Water Revenue (USD Million) And CAGR (%) By Product (2021-2032)
Table 10 Global Cleansing Water Market Revenue (USD Million) By Regions (2021-2032)
Table 11 Global Cleansing Water Market Share (%) By Regions (2021-2032)
Table 12 North America Cleansing Water Revenue (USD Million) By Country (2021-2032)
Table 13 Europe Cleansing Water Revenue (USD Million) By Country (2021-2032)
Table 14 Asia Pacific Cleansing Water Revenue (USD Million) By Country (2021-2032)
Table 15 South America Cleansing Water Revenue (USD Million) By Country (2021-2032)
Table 16 Middle East and Africa Cleansing Water Revenue (USD Million) By Region (2021-2032)
Table 17 North America Cleansing Water Revenue (USD Million) By Type (2021-2032)
Table 18 North America Cleansing Water Revenue (USD Million) By Application (2021-2032)
Table 19 North America Cleansing Water Revenue (USD Million) By Product (2021-2032)
Table 20 Europe Cleansing Water Revenue (USD Million) By Type (2021-2032)
Table 21 Europe Cleansing Water Revenue (USD Million) By Application (2021-2032)
Table 22 Europe Cleansing Water Revenue (USD Million) By Product (2021-2032)
Table 23 Asia Pacific Cleansing Water Revenue (USD Million) By Type (2021-2032)
Table 24 Asia Pacific Cleansing Water Revenue (USD Million) By Application (2021-2032)
Table 25 Asia Pacific Cleansing Water Revenue (USD Million) By Product (2021-2032)
Table 26 South America Cleansing Water Revenue (USD Million) By Type (2021-2032)
Table 27 South America Cleansing Water Revenue (USD Million) By Application (2021-2032)
Table 28 South America Cleansing Water Revenue (USD Million) By Product (2021-2032)
Table 29 Middle East and Africa Cleansing Water Revenue (USD Million) By Type (2021-2032)
Table 30 Middle East and Africa Cleansing Water Revenue (USD Million) By Application (2021-2032)
Table 31 Middle East and Africa Cleansing Water Revenue (USD Million) By Product (2021-2032)
LIST OF FIGURES
Figure 1. Market Scope
Figure 2. Pricing Forecasts Per Unit, 2023- 2032
Figure 3. Porter’s Five Forces
Figure 4. Global Cleansing Water Market Revenue (USD Million) By Regions (2021-2032)
Figure 5. Global Cleansing Water Market Share (%) By Regions (2023)
Figure 6. North America Cleansing Water Revenue (USD Million) By Country (2021-2032)
Figure 7. United States Cleansing Water Revenue (USD Million) By Country (2021-2032)
Figure 8. Canada Cleansing Water Revenue (USD Million) By Country (2021-2032)
Figure 9. Mexico Cleansing Water Revenue (USD Million) By Country (2021-2032)
Figure 10. Europe Cleansing Water Revenue (USD Million) By Country (2021-2032)
Figure 11. Germany Cleansing Water Revenue (USD Million) By Country (2021-2032)
Figure 12. France Cleansing Water Revenue (USD Million) By Country (2021-2032)
Figure 13. United Kingdom Cleansing Water Revenue (USD Million) By Country (2021-2032)
Figure 14. Spain Cleansing Water Revenue (USD Million) By Country (2021-2032)
Figure 15. Italy Cleansing Water Revenue (USD Million) By Country (2021-2032)
Figure 16. Russia Cleansing Water Revenue (USD Million) By Country (2021-2032)
Figure 17. Rest of Europe Cleansing Water Revenue (USD Million) By Country (2021-2032)
Figure 11. Asia Pacific Cleansing Water Revenue (USD Million) By Country (2021-2032)
Figure 12. China Cleansing Water Revenue (USD Million) By Country (2021-2032)
Figure 13. Japan Cleansing Water Revenue (USD Million) By Country (2021-2032)
Figure 14. India Cleansing Water Revenue (USD Million) By Country (2021-2032)
Figure 15. South Korea Cleansing Water Revenue (USD Million) By Country (2021-2032)
Figure 16. Australia Cleansing Water Revenue (USD Million) By Country (2021-2032)
Figure 17. South East Asia Cleansing Water Revenue (USD Million) By Country (2021-2032)
Figure 18. South America Cleansing Water Revenue (USD Million) By Country (2021-2032)
Figure 19. Brazil Cleansing Water Revenue (USD Million) By Country (2021-2032)
Figure 20. Argentina Cleansing Water Revenue (USD Million) By Country (2021-2032)
Figure 21. Rest of Asia Pacific Cleansing Water Revenue (USD Million) By Country (2021-2032)
Figure 22. Middle East and Africa Cleansing Water Revenue (USD Million) By Region (2021-2032)
Figure 23. Saudi Arabia Cleansing Water Revenue (USD Million) By Region (2021-2032)
Figure 24. The UAE Cleansing Water Revenue (USD Million) By Region (2021-2032)
Figure 25. Rest of Middle East Cleansing Water Revenue (USD Million) By Region (2021-2032)
Figure 26. South Africa Cleansing Water Revenue (USD Million) By Region (2021-2032)
Figure 27. Africa Cleansing Water Revenue (USD Million) By Region (2021-2032)
Figure 28. North America Cleansing Water Revenue (USD Million) By Type (2021-2032)
Figure 29. North America Cleansing Water Revenue (USD Million) By Application (2021-2032)
Figure 30. North America Cleansing Water Revenue (USD Million) By Product (2021-2032)
Figure 31. Europe Cleansing Water Revenue (USD Million) By Type (2021-2032)
Figure 32. Europe Cleansing Water Revenue (USD Million) By Application (2021-2032)
Figure 33. Europe Cleansing Water Revenue (USD Million) By Product (2021-2032)
Figure 34. Asia Pacific Cleansing Water Revenue (USD Million) By Type (2021-2032)
Figure 35. Asia Pacific Cleansing Water Revenue (USD Million) By Application (2021-2032)
Figure 36. Asia Pacific Cleansing Water Revenue (USD Million) By Product (2021-2032)
Figure 37. South America Cleansing Water Revenue (USD Million) By Type (2021-2032)
Figure 38. South America Cleansing Water Revenue (USD Million) By Application (2021-2032)
Figure 39. South America Cleansing Water Revenue (USD Million) By Product (2021-2032)
Figure 40. Middle East and Africa Cleansing Water Revenue (USD Million) By Type (2021-2032)
Figure 41. Middle East and Africa Cleansing Water Revenue (USD Million) By Application (2021-2032)
Figure 42. Middle East and Africa Cleansing Water Revenue (USD Million) By Product (2021-2032)
By Type
Oily Skin
Dry Skin
Combination Skin
By Application
Male
Female
Countries Analyzed
North America (US, Canada, Mexico)
Europe (Germany, UK, France, Spain, Italy, Russia, Rest of Europe)
Asia Pacific (China, India, Japan, South Korea, Australia, South East Asia, Rest of Asia)
South America (Brazil, Argentina, Rest of South America)
Middle East and Africa (Saudi Arabia, UAE, Rest of Middle East, South Africa, Egypt, Rest of Africa)
