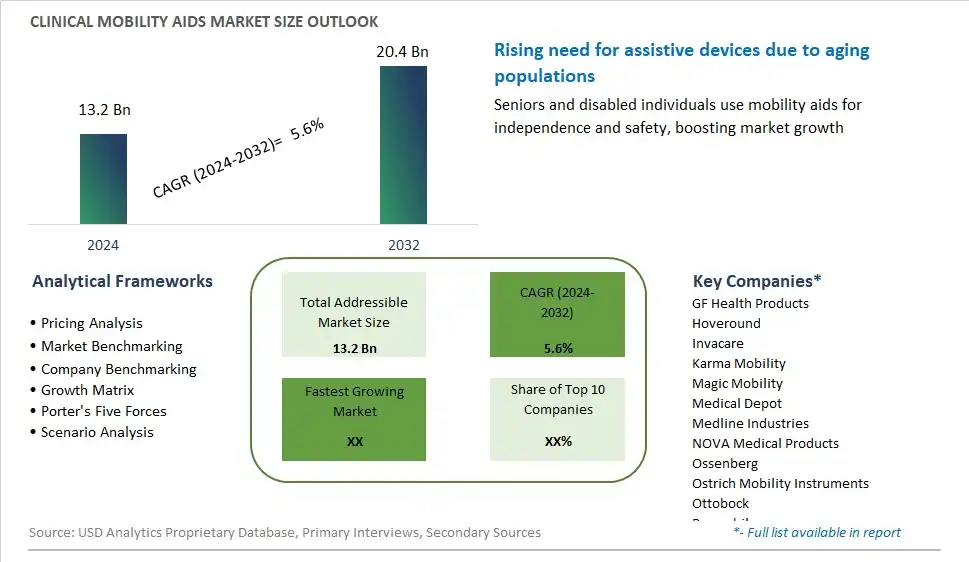
Global Clinical Mobility Aids Market Size is valued at $13.2 Billion in 2024 and is forecast to register a growth rate (CAGR) of 5.6% to reach $20.4 Billion by 2032.
The global Clinical Mobility Aids Market Comprehensive Study analyzes and forecasts the market size across 6 regions and 24 countries for diverse segments -By Product (Wheelchairs, Crutches, Walkers), By Application (Hospital, Clinic, Sanatorium, Others)
An Introduction to Clinical Mobility Aids Market
The clinical mobility aids market in 2024 is witnessing steady growth, driven by an aging population, increasing prevalence of chronic diseases and disabilities, and advancements in healthcare technologies. Clinical mobility aids encompass a wide range of devices and equipment designed to assist individuals with mobility impairments, including wheelchairs, walkers, mobility scooters, and crutches, among others. These aids play a crucial role in enhancing mobility, independence, and quality of life for individuals with mobility challenges, enabling them to participate more actively in daily activities and social interactions. With a growing emphasis on ergonomic design, lightweight materials, and customizable features, manufacturers are catering to the diverse needs and preferences of users across different age groups and mobility levels. Furthermore, the integration of smart technologies and connectivity features in clinical mobility aids, such as GPS tracking, remote monitoring, and fall detection, is revolutionizing the healthcare landscape, offering enhanced safety, convenience, and peace of mind for users and caregivers alike.
Clinical Mobility Aids Competitive Landscape
The market report analyses the leading companies in the industry including GF Health Products, Hoveround, Invacare, Karma Mobility, Magic Mobility, Medical Depot, Medline Industries, NOVA Medical Products, Ossenberg, Ostrich Mobility Instruments, Ottobock, Permobil, Pride Mobility Products, Sunrise Medical, and Others.
Clinical Mobility Aids Market Dynamics
Clinical Mobility Aids Market Trend: Aging Population and Increasing Mobility Needs
The prominent market trend for Clinical Mobility Aids is driven by the aging population and their increasing mobility needs. With a growing number of seniors and individuals with disabilities seeking to maintain independence and mobility, there's a rising demand for clinical mobility aids such as walkers, wheelchairs, and mobility scooters. This trend is fueled by the desire for products that enhance mobility, improve accessibility, and support daily activities, enabling individuals to maintain active and fulfilling lifestyles as they age or manage mobility challenges due to injury or illness.
Market Driver: Technological Advancements in Mobility Assistance Devices
A significant market driver for Clinical Mobility Aids is the continuous technological advancements in mobility assistance devices. As technology evolves, there's a shift towards more advanced and innovative solutions that offer enhanced functionality, comfort, and convenience for users. Features such as lightweight materials, ergonomic designs, foldable frames, adjustable heights, and smart connectivity options are driving the development of next-generation mobility aids that cater to diverse user needs and preferences. The driver is fueled by the desire for products that improve user experience, promote independence, and facilitate greater mobility and accessibility in both clinical and everyday settings.
Market Opportunity: Customization and Personalization of Mobility Solutions
An opportunity in the Clinical Mobility Aids market lies in the customization and personalization of mobility solutions to meet individualized needs and preferences. While there's a wide range of mobility aids available on the market, not all products may adequately address the unique requirements of every user. Companies can capitalize on this opportunity by offering customizable options such as adjustable features, customizable colors and designs, and tailored accessories to accommodate specific mobility challenges and personal preferences. Additionally, leveraging advancements in 3D printing and digital modeling technologies can enable the creation of bespoke mobility solutions that are precisely tailored to each user's body measurements and mobility requirements. By providing personalized mobility aids, companies can enhance user satisfaction, improve usability, and differentiate their offerings in a competitive market landscape, ultimately improving the quality of life for individuals with mobility impairments.
Clinical Mobility Aids Market Share Analysis: Wheelchairs held the dominant market share in 2024
Within the clinical mobility aids market, the Wheelchairs segment is the largest, commanding prominence due to its essential role in providing mobility and independence to individuals with mobility impairments. Wheelchairs are versatile devices designed to accommodate various needs, preferences, and levels of mobility, ranging from manual wheelchairs propelled by users to electric-powered models for enhanced mobility assistance. Their widespread usage across healthcare facilities, rehabilitation centers, and homes underscores their significance in facilitating daily activities and improving quality of life for users. Additionally, advancements in wheelchair design and technology, such as lightweight materials, ergonomic features, and customizable options, further contribute to their dominance in the market. While crutches and walkers offer mobility support for specific conditions, the Wheelchairs segment remains the cornerstone of the clinical mobility aids market, serving as a fundamental tool for individuals with mobility challenges.
Clinical Mobility Aids Market Share Analysis: Clinic market is poised to register the fastest growth rae over the forecast period to 2032
Among the applications of the clinical mobility aids market, the Clinic segment is the fastest-growing, driven by several factors contributing to increased demand for mobility aids in outpatient care settings. Clinics serve as essential healthcare facilities offering a wide range of medical services, including diagnostics, treatment, and rehabilitation, to patients with varying healthcare needs. As clinics strive to enhance patient care and improve accessibility, the adoption of clinical mobility aids becomes imperative in providing comprehensive support to patients with mobility impairments. These aids, such as wheelchairs, crutches, and walkers, enable patients to navigate clinic environments safely and comfortably, facilitating their access to medical appointments, consultations, and therapeutic interventions. Further, the growing emphasis on outpatient care and ambulatory services further amplifies the demand for clinical mobility aids in clinic settings. As clinics continue to prioritize patient-centered care and accessibility, the Clinic segment of the clinical mobility aids market stands poised for continued growth, driving innovation and advancements in mobility assistance technologies tailored to outpatient care needs.
Clinical Mobility Aids Market Segmentation
By Product
Wheelchairs
Crutches
Walkers
By Application
Hospital
Clinic
Sanatorium
Others
Countries Analyzed
North America (US, Canada, Mexico)
Europe (Germany, UK, France, Spain, Italy, Russia, Rest of Europe)
Asia Pacific (China, India, Japan, South Korea, Australia, South East Asia, Rest of Asia)
South America (Brazil, Argentina, Rest of South America)
Middle East and Africa (Saudi Arabia, UAE, Rest of Middle East, South Africa, Egypt, Rest of Africa)
Clinical Mobility Aids Companies Profiled in the Study
GF Health Products
Hoveround
Invacare
Karma Mobility
Magic Mobility
Medical Depot
Medline Industries
NOVA Medical Products
Ossenberg
Ostrich Mobility Instruments
Ottobock
Permobil
Pride Mobility Products
Sunrise Medical
*- List Not Exhaustive
Chapter 1. TABLE OF CONTENTS
Chapter 2. Introduction to Clinical Mobility Aids Market
2.1. Market Overview
2.2. Key Statistics and Report Highlights
2.3. Scope of the Comprehensive Study
2.3.1. Market Definition
2.3.2 Countries and Regions Covered
2.3.3 Research Objective
2.3.4 Units, Currency, and Conversions
2.3.5 Industry Value Chain
2.4. Key Market Segments
2.5. Key Companies
2.6. Study Period
Chapter 3. Strategic Analysis Review
3.1. Clinical Mobility Aids Pricing Analysis and Forecast
3.2. Porter’s Five Forces
3.3. Market Ecosystem
3.4. SWOT Analysis
3.5. Regulatory Scenario
3.3. Effects of Inflation, Russia-Ukraine War, moderating economic growth, and other macroeconomic factors
Chapter 4. Competitive Landscape
4.1. Market Share Analysis
4.1.1. Global Clinical Mobility Aids Market Share by Company, 2023
4.1.2. Product Offerings of Leading Clinical Mobility Aids Companies
4.2. Market Entropy
4.2.1. New Product Launches in the Industry
4.2.2. Mergers, Acquisitions, Joint ventures, and Partnerships
4.3. Key Strategies and Best Practices
Chapter 5. Global Market Projections: Best, Reference, and Low Case Scenarios
5.1. Growth Analysis- Case Scenario Definitions
5.2. Low Growth Case Scenario Forecasts
5.3. Reference Growth Case Scenario Forecasts
5.4. High Growth Case Scenario Forecasts
Chapter 6. Market Dynamics
6.1. Clinical Mobility Aids Market Drivers
6.2. Clinical Mobility Aids Market Challenges
6.6. Clinical Mobility Aids Market Opportunities
6.4. Clinical Mobility Aids Market Trends
Chapter 7. Global Clinical Mobility Aids Market Outlook Trends
7.1. Global Clinical Mobility Aids Revenue (USD Million) and CAGR (%) by Type (2021-2032)
7.2. Global Clinical Mobility Aids Revenue (USD Million) and CAGR (%) by Application (2021-2032)
7.3. Global Clinical Mobility Aids Revenue (USD Million) and CAGR (%) by Product (2021-2032)
By Product
Wheelchairs
Crutches
Walkers
By Application
Hospital
Clinic
Sanatorium
Others
Chapter 8. Global Clinical Mobility Aids Regional Analysis and Outlook
8.1. Global Clinical Mobility Aids Revenue (USD Million) By Regions (2021- 2032)
8.2. North America Clinical Mobility Aids Revenue (USD Million) by Country (2021-2032)
8.2.1. United States Clinical Mobility Aids Regional Analysis and Outlook
8.2.2. Canada Clinical Mobility Aids Regional Analysis and Outlook
8.2.3. Mexico Clinical Mobility Aids Regional Analysis and Outlook
8.3. Europe Clinical Mobility Aids Revenue (USD Million), by Country (2021-2032)
8.3.1. Germany Clinical Mobility Aids Regional Analysis and Outlook
8.3.2. France Clinical Mobility Aids Regional Analysis and Outlook
8.3.3. United Kingdom Clinical Mobility Aids Regional Analysis and Outlook
8.3.4. Spain Clinical Mobility Aids Regional Analysis and Outlook
8.3.5. Italy Clinical Mobility Aids Regional Analysis and Outlook
8.3.6. Russia Clinical Mobility Aids Regional Analysis and Outlook
8.3.7. Rest of Europe Clinical Mobility Aids Regional Analysis and Outlook
8.4. Asia Pacific Clinical Mobility Aids Revenue (USD Million) by Country (2021-2032)
8.4.1. China Clinical Mobility Aids Regional Analysis and Outlook
8.4.2. Japan Clinical Mobility Aids Regional Analysis and Outlook
8.4.3. India Clinical Mobility Aids Regional Analysis and Outlook
8.4.4. South Korea Clinical Mobility Aids Regional Analysis and Outlook
8.4.5. Australia Clinical Mobility Aids Regional Analysis and Outlook
8.4.6. South East Asia Clinical Mobility Aids Regional Analysis and Outlook
8.4.7. Rest of Asia Pacific Clinical Mobility Aids Regional Analysis and Outlook
8.5. South America Clinical Mobility Aids Revenue (USD Million), by Country (2021-2032)
8.5.1. Brazil Clinical Mobility Aids Regional Analysis and Outlook
8.5.2. Argentina Clinical Mobility Aids Regional Analysis and Outlook
8.5.3. Rest of South America Clinical Mobility Aids Regional Analysis and Outlook
8.6. Middle East and Africa Clinical Mobility Aids Revenue (USD Million) by Country (2021-2032)
8.6.1. Middle East Clinical Mobility Aids Regional Analysis and Outlook
8.6.2. Africa Clinical Mobility Aids Regional Analysis and Outlook
Chapter 9. North America Clinical Mobility Aids Analysis and Outlook
9.1. North America Clinical Mobility Aids Revenue (USD Million) by Segments (2021-2032)
9.1.1. North America Clinical Mobility Aids Revenue (USD Million) by Type (2021-2032)
9.1.2. North America Clinical Mobility Aids Revenue (USD Million) by Application (2021-2032)
9.1.3. North America Clinical Mobility Aids Revenue (USD Million) by Product (2021-2032)
By Product
Wheelchairs
Crutches
Walkers
By Application
Hospital
Clinic
Sanatorium
Others
Chapter 10. Europe Clinical Mobility Aids Analysis and Outlook
10.1. Europe Clinical Mobility Aids Revenue (USD Million), by Segments (USD Million) (2021-2032)
10.1.1. Europe Clinical Mobility Aids Revenue (USD Million) by Type (2021-2032)
10.1.2. Europe Clinical Mobility Aids Revenue (USD Million) by Application (2021-2032)
10.1.3. Europe Clinical Mobility Aids Revenue (USD Million) by Product (2021-2032)
By Product
Wheelchairs
Crutches
Walkers
By Application
Hospital
Clinic
Sanatorium
Others
Chapter 11. Asia Pacific Clinical Mobility Aids Analysis and Outlook
11.1. Asia Pacific Clinical Mobility Aids Revenue (USD Million), and Revenue (USD Million) by Segments (2021-2032)
11.1.1. Asia Pacific Clinical Mobility Aids Revenue (USD Million) by Type (2021-2032)
11.1.2. Asia Pacific Clinical Mobility Aids Revenue (USD Million) by Application (2021-2032)
11.1.3. Asia Pacific Clinical Mobility Aids Revenue (USD Million) by Product (2021-2032)
By Product
Wheelchairs
Crutches
Walkers
By Application
Hospital
Clinic
Sanatorium
Others
Chapter 12. South America Clinical Mobility Aids Analysis and Outlook
12.1. South America Clinical Mobility Aids Revenue (USD Million), by Segments (2021-2032)
12.1.1. South America Clinical Mobility Aids Revenue (USD Million) by Type (2021-2032)
12.1.2. South America Clinical Mobility Aids Revenue (USD Million) by Application (2021-2032)
12.1.3. South America Clinical Mobility Aids Revenue (USD Million) by Product (2021-2032)
By Product
Wheelchairs
Crutches
Walkers
By Application
Hospital
Clinic
Sanatorium
Others
Chapter 13. Middle East and Africa Clinical Mobility Aids Analysis and Outlook
13.1. Middle East and Africa Clinical Mobility Aids Revenue (USD Million), by Segments (2021-2032)
13.1.1. Middle East and Africa Clinical Mobility Aids Revenue (USD Million) by Type (2021-2032)
13.1.2. Middle East and Africa Clinical Mobility Aids Revenue (USD Million) by Application (2021-2032)
13.1.3. Middle East and Africa Clinical Mobility Aids Revenue (USD Million) by Product (2021-2032)
By Product
Wheelchairs
Crutches
Walkers
By Application
Hospital
Clinic
Sanatorium
Others
Chapter 14. Clinical Mobility Aids Company Profiles
14.1 Business Overview
14.2 Product Profiles
14.3 SWOT Profiles
14.5 Recent Developments
14.6 Financial Profile
List of Companies
GF Health Products
Hoveround
Invacare
Karma Mobility
Magic Mobility
Medical Depot
Medline Industries
NOVA Medical Products
Ossenberg
Ostrich Mobility Instruments
Ottobock
Permobil
Pride Mobility Products
Sunrise Medical
15. Methodology and Data Sources
15.1 Customization Offerings
15.2 Subscription Services
15.3 Related Reports
15.4 Publisher Expertise
LIST OF TABLES
Table 1 Market Segmentation Analysis
Table 2 Global Clinical Mobility Aids Market Share of Leading Companies, 2023
Table 3 Product Offerings of Leading Companies
Table 4 Low Growth Scenario Forecasts
Table 5 Reference Case Growth Scenario
Table 6 High Growth Case Scenario
Table 7 Global Clinical Mobility Aids Revenue (USD Million) And CAGR (%) By Type (2021-2032)
Table 8 Global Clinical Mobility Aids Revenue (USD Million) And CAGR (%) By Application (2021-2032)
Table 9 Global Clinical Mobility Aids Revenue (USD Million) And CAGR (%) By Product (2021-2032)
Table 10 Global Clinical Mobility Aids Market Revenue (USD Million) By Regions (2021-2032)
Table 11 Global Clinical Mobility Aids Market Share (%) By Regions (2021-2032)
Table 12 North America Clinical Mobility Aids Revenue (USD Million) By Country (2021-2032)
Table 13 Europe Clinical Mobility Aids Revenue (USD Million) By Country (2021-2032)
Table 14 Asia Pacific Clinical Mobility Aids Revenue (USD Million) By Country (2021-2032)
Table 15 South America Clinical Mobility Aids Revenue (USD Million) By Country (2021-2032)
Table 16 Middle East and Africa Clinical Mobility Aids Revenue (USD Million) By Region (2021-2032)
Table 17 North America Clinical Mobility Aids Revenue (USD Million) By Type (2021-2032)
Table 18 North America Clinical Mobility Aids Revenue (USD Million) By Application (2021-2032)
Table 19 North America Clinical Mobility Aids Revenue (USD Million) By Product (2021-2032)
Table 20 Europe Clinical Mobility Aids Revenue (USD Million) By Type (2021-2032)
Table 21 Europe Clinical Mobility Aids Revenue (USD Million) By Application (2021-2032)
Table 22 Europe Clinical Mobility Aids Revenue (USD Million) By Product (2021-2032)
Table 23 Asia Pacific Clinical Mobility Aids Revenue (USD Million) By Type (2021-2032)
Table 24 Asia Pacific Clinical Mobility Aids Revenue (USD Million) By Application (2021-2032)
Table 25 Asia Pacific Clinical Mobility Aids Revenue (USD Million) By Product (2021-2032)
Table 26 South America Clinical Mobility Aids Revenue (USD Million) By Type (2021-2032)
Table 27 South America Clinical Mobility Aids Revenue (USD Million) By Application (2021-2032)
Table 28 South America Clinical Mobility Aids Revenue (USD Million) By Product (2021-2032)
Table 29 Middle East and Africa Clinical Mobility Aids Revenue (USD Million) By Type (2021-2032)
Table 30 Middle East and Africa Clinical Mobility Aids Revenue (USD Million) By Application (2021-2032)
Table 31 Middle East and Africa Clinical Mobility Aids Revenue (USD Million) By Product (2021-2032)
LIST OF FIGURES
Figure 1. Market Scope
Figure 2. Pricing Forecasts Per Unit, 2023- 2032
Figure 3. Porter’s Five Forces
Figure 4. Global Clinical Mobility Aids Market Revenue (USD Million) By Regions (2021-2032)
Figure 5. Global Clinical Mobility Aids Market Share (%) By Regions (2023)
Figure 6. North America Clinical Mobility Aids Revenue (USD Million) By Country (2021-2032)
Figure 7. United States Clinical Mobility Aids Revenue (USD Million) By Country (2021-2032)
Figure 8. Canada Clinical Mobility Aids Revenue (USD Million) By Country (2021-2032)
Figure 9. Mexico Clinical Mobility Aids Revenue (USD Million) By Country (2021-2032)
Figure 10. Europe Clinical Mobility Aids Revenue (USD Million) By Country (2021-2032)
Figure 11. Germany Clinical Mobility Aids Revenue (USD Million) By Country (2021-2032)
Figure 12. France Clinical Mobility Aids Revenue (USD Million) By Country (2021-2032)
Figure 13. United Kingdom Clinical Mobility Aids Revenue (USD Million) By Country (2021-2032)
Figure 14. Spain Clinical Mobility Aids Revenue (USD Million) By Country (2021-2032)
Figure 15. Italy Clinical Mobility Aids Revenue (USD Million) By Country (2021-2032)
Figure 16. Russia Clinical Mobility Aids Revenue (USD Million) By Country (2021-2032)
Figure 17. Rest of Europe Clinical Mobility Aids Revenue (USD Million) By Country (2021-2032)
Figure 11. Asia Pacific Clinical Mobility Aids Revenue (USD Million) By Country (2021-2032)
Figure 12. China Clinical Mobility Aids Revenue (USD Million) By Country (2021-2032)
Figure 13. Japan Clinical Mobility Aids Revenue (USD Million) By Country (2021-2032)
Figure 14. India Clinical Mobility Aids Revenue (USD Million) By Country (2021-2032)
Figure 15. South Korea Clinical Mobility Aids Revenue (USD Million) By Country (2021-2032)
Figure 16. Australia Clinical Mobility Aids Revenue (USD Million) By Country (2021-2032)
Figure 17. South East Asia Clinical Mobility Aids Revenue (USD Million) By Country (2021-2032)
Figure 18. South America Clinical Mobility Aids Revenue (USD Million) By Country (2021-2032)
Figure 19. Brazil Clinical Mobility Aids Revenue (USD Million) By Country (2021-2032)
Figure 20. Argentina Clinical Mobility Aids Revenue (USD Million) By Country (2021-2032)
Figure 21. Rest of Asia Pacific Clinical Mobility Aids Revenue (USD Million) By Country (2021-2032)
Figure 22. Middle East and Africa Clinical Mobility Aids Revenue (USD Million) By Region (2021-2032)
Figure 23. Saudi Arabia Clinical Mobility Aids Revenue (USD Million) By Region (2021-2032)
Figure 24. The UAE Clinical Mobility Aids Revenue (USD Million) By Region (2021-2032)
Figure 25. Rest of Middle East Clinical Mobility Aids Revenue (USD Million) By Region (2021-2032)
Figure 26. South Africa Clinical Mobility Aids Revenue (USD Million) By Region (2021-2032)
Figure 27. Africa Clinical Mobility Aids Revenue (USD Million) By Region (2021-2032)
Figure 28. North America Clinical Mobility Aids Revenue (USD Million) By Type (2021-2032)
Figure 29. North America Clinical Mobility Aids Revenue (USD Million) By Application (2021-2032)
Figure 30. North America Clinical Mobility Aids Revenue (USD Million) By Product (2021-2032)
Figure 31. Europe Clinical Mobility Aids Revenue (USD Million) By Type (2021-2032)
Figure 32. Europe Clinical Mobility Aids Revenue (USD Million) By Application (2021-2032)
Figure 33. Europe Clinical Mobility Aids Revenue (USD Million) By Product (2021-2032)
Figure 34. Asia Pacific Clinical Mobility Aids Revenue (USD Million) By Type (2021-2032)
Figure 35. Asia Pacific Clinical Mobility Aids Revenue (USD Million) By Application (2021-2032)
Figure 36. Asia Pacific Clinical Mobility Aids Revenue (USD Million) By Product (2021-2032)
Figure 37. South America Clinical Mobility Aids Revenue (USD Million) By Type (2021-2032)
Figure 38. South America Clinical Mobility Aids Revenue (USD Million) By Application (2021-2032)
Figure 39. South America Clinical Mobility Aids Revenue (USD Million) By Product (2021-2032)
Figure 40. Middle East and Africa Clinical Mobility Aids Revenue (USD Million) By Type (2021-2032)
Figure 41. Middle East and Africa Clinical Mobility Aids Revenue (USD Million) By Application (2021-2032)
Figure 42. Middle East and Africa Clinical Mobility Aids Revenue (USD Million) By Product (2021-2032)
By Product
Wheelchairs
Crutches
Walkers
By Application
Hospital
Clinic
Sanatorium
Others
Countries Analyzed
North America (US, Canada, Mexico)
Europe (Germany, UK, France, Spain, Italy, Russia, Rest of Europe)
Asia Pacific (China, India, Japan, South Korea, Australia, South East Asia, Rest of Asia)
South America (Brazil, Argentina, Rest of South America)
Middle East and Africa (Saudi Arabia, UAE, Rest of Middle East, South Africa, Egypt, Rest of Africa)
