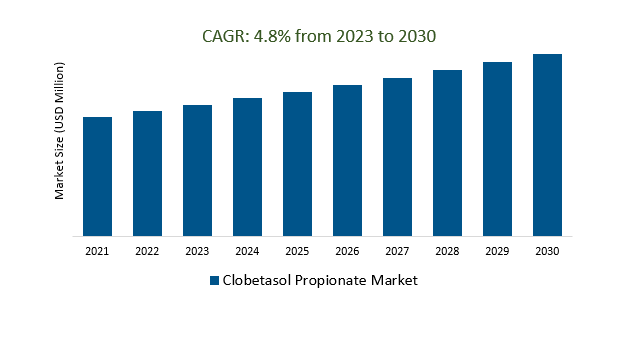
The Global Clobetasol Propionate Market Size is estimated to register 4.8% growth over the forecast period from 2023 to 2030.
The market growth is driven by an increasing awareness of skin conditions and their treatments encouraging patients to seek medical assistance, which can boost the market. Leading Companies focusing on Rising Incidence of Skin Disorders, Advancements in Formulations, Personalized Medicine, Global Expansion, Economic and Healthcare Spending Factors, Market Competition, Health Insurance Coverage, and others to boost market shares in the industry.
Market Overview
The Clobetasol Propionate market, a dermatological product for treating various skin conditions, has witnessed steady growth due to increasing skin disorder prevalence and patient awareness. Key players include Galderma, Perrigo, and Teva Pharmaceuticals. Market segmentation is based on product type, application, and distribution channel, with regional variations. Growing interest in skin health, advancements in formulations, and telemedicine's influence are notable trends, while regulatory changes and generic alternatives pose challenges. The future scope depends on ongoing innovations, patient education, regulatory updates, and global economic and environmental factors. For the latest data, consulting recent industry reports is recommended.
Market Dynamics
Market Trends- Clobetasol propionate is a topical medication that can be used to stimulate hair regrowth
Clobetasol propionate is a potent topical corticosteroid primarily used for various skin conditions and is not typically employed for hair regrowth. For addressing hair loss and stimulating hair regrowth, individuals often opt for specific medications such as minoxidil and finasteride, under the guidance of a dermatologist. These treatments have distinct mechanisms of action, with minoxidil as a topical solution promoting hair growth and finasteride, an oral medication, managing male pattern baldness by inhibiting the conversion of testosterone into dihydrotestosterone (DHT). The expertise of a dermatologist is crucial for assessing the underlying causes of hair loss and determining the most suitable treatment, whether for skin conditions with clobetasol propionate or hair regrowth with specialized medications, as individual responses may vary, necessitating professional supervision for safety and effectiveness.
Market Driver- The demand for clobetasol propionate in the cosmetic dermatology market is driven by its clinically proven efficacy in treating a variety of hair and skin conditions.
The demand for clobetasol propionate in the cosmetic dermatology market is increasing due to its clinically proven efficacy in treating hair and skin conditions, particularly in addressing issues like alopecia areata, psoriasis, and eczema. It is also frequently used in combination with other cosmetic dermatological procedures to prepare the skin for treatments such as chemical peels and laser therapy. With a growing interest in cosmetic enhancements and non-invasive treatments, clobetasol propionate is expected to maintain its presence and demand in the cosmetic dermatology sector.
Market Opportunity- Global skin health awareness campaigns are helping to increase awareness of clobetasol propionate and its potential benefits for a variety of hair and skin conditions.
Global skin health awareness campaigns are significantly increasing awareness of clobetasol propionate and its therapeutic benefits for various hair and skin conditions. These initiatives focus on educating the public about the importance of maintaining healthy skin and seeking professional treatment, emphasizing the role of dermatologists and healthcare professionals. This heightened awareness is encouraging individuals to consider clobetasol propionate as an effective option for conditions like psoriasis, eczema, and alopecia areata, facilitating proactive management of their skin health.
Market Share Analysis- Psoriasis the Clobetasol Propionate Market will register the fastest growth
The Global Clobetasol Propionate Market is analyzed across Psoriasis, Eczema, Dermatitis, and others. Psoriasis is poised to register the fastest growth. Psoriasis is a major driver of the Clobetasol Propionate Market. Clobetasol propionate, a potent topical corticosteroid, is frequently prescribed for managing psoriasis, a common autoimmune skin condition. Its anti-inflammatory properties help alleviate psoriasis symptoms, such as itching and redness. With the increasing global prevalence of psoriasis, the demand for clobetasol propionate as an effective treatment option is on the rise, making psoriasis a significant factor influencing the market. Continuous research and development aim to enhance clobetasol propionate's formulations and delivery methods to improve its effectiveness in managing psoriasis and related skin conditions.
Market Share Analysis- Creams held a significant market share in 2023
The Global Clobetasol Propionate Market is analyzed across various Formulations including Creams, Ointments, Solutions, and others. Of these, Creams held a significant market share in 2023. Clobetasol Propionate creams are a significant segment within the market, commonly prescribed for the treatment of various skin conditions like eczema, psoriasis, and dermatitis. These creams provide localized relief by delivering the medication directly to the affected skin areas, reducing inflammation and alleviating itching and redness. Available in various concentrations and formulations, they are widely used in clinical settings and play a pivotal role in managing dermatological conditions, with demand influenced by the prevalence of such skin disorders and the preference for targeted topical treatments.
Clobetasol Propionate Market Segmentation
By Application
- Psoriasis
- Eczema
- Dermatitis
- Others
By Formulation
- Creams
- Ointments
- Solutions
- Others
By Distribution Channel
- Retail Pharmacies
- Hospital Pharmacies
- Online Pharmacies
By Combination Drug
- Neomycin
- Miconazole
- Gentamicin
- Salicylic Acid
- Others
By Region
- North America (United States, Canada, Mexico)
- Europe (Germany, France, United Kingdom, Spain, Italy, Others)
- Asia Pacific (China, India, Japan, South Korea, Australia, Others)
- Latin America (Brazil, Argentina, Others)
- Middle East and Africa (Saudi Arabia, UAE, Kuwait, Other Middle East, South Africa, Nigeria, Other Africa)
Clobetasol Propionate Market Companies
- GlaxoSmithKline plc (United Kingdom)
- Mylan N.V. (United Kingdom)
- Pfizer Inc (United States)
- Zydus Cadila (India)
- LEO Pharma A/S (Denmark)
- Teva Pharmaceutical Industries Ltd (Israel)
- Lupin Limited (India)
- Glenmark Pharmaceuticals Ltd. (India)
- Perrigo Company plc (Ireland)
- Cipla Ltd. (India)
- Hikma Pharmaceuticals plc (United Kingdom)
- Sandoz International GmbH (Switzerland)
- Taro Pharmaceutical Industries Ltd (United States)
- Dr. Reddy's Laboratories Ltd. (India)
- Sun Pharmaceutical Industries Ltd (India)
*List not exhaustive
Clobetasol Propionate Market Outlook 2023
1 Market Overview
1.1 Introduction to the Clobetasol Propionate Market
1.2 Scope of the Study
1.3 Research Objective
1.3.1 Key Market Scope and Segments
1.3.2 Players Covered
1.3.3 Years Considered
2 Executive Summary
2.1 2023 Clobetasol Propionate Industry- Market Statistics
3 Market Dynamics
3.1 Market Drivers
3.2 Market Challenges
3.3 Market Opportunities
3.4 Market Trends
4 Market Factor Analysis
4.1 Porter’s Five Forces
4.2 Market Entropy
4.2.1 Global Clobetasol Propionate Market Companies with Area Served
4.2.2 Products Offerings Global Clobetasol Propionate Market
5 COVID-19 Impact Analysis and Outlook Scenarios
5.1.1 Covid-19 Impact Analysis
5.1.2 Post-COVID-19 Scenario- Low Growth Case
5.1.3 Post-COVID-19 Scenario- Reference Growth Case
5.1.4 Post-COVID-19 Scenario- Low Growth Case
6 Global Clobetasol Propionate Market Trends
6.1 Global Clobetasol Propionate Revenue (USD Million) and CAGR (%) by Type (2018-2030)
6.2 Global Clobetasol Propionate Revenue (USD Million) and CAGR (%) by Applications (2018-2030)
6.3 Global Clobetasol Propionate Revenue (USD Million) and CAGR (%) by Regions (2018-2030)
7 Global Clobetasol Propionate Market Revenue (USD Million) by Type, and Applications (2018-2022)
7.1 Global Clobetasol Propionate Revenue (USD Million) by Type (2018-2022)
7.1.1 Global Clobetasol Propionate Revenue (USD Million), Market Share (%) by Type (2018-2022)
7.2 Global Clobetasol Propionate Revenue (USD Million) by Applications (2018-2022)
7.2.1 Global Clobetasol Propionate Revenue (USD Million), Market Share (%) by Applications (2018-2022)
8 Global Clobetasol Propionate Development Regional Status and Outlook
8.1 Global Clobetasol Propionate Revenue (USD Million) By Regions (2018-2022)
8.2 North America Clobetasol Propionate Revenue (USD Million) by Type, and Application (2018-2022)
8.2.1 North America Clobetasol Propionate Revenue (USD Million) by Country (2018-2022)
8.2.2 North America Clobetasol Propionate Revenue (USD Million) by Type (2018-2022)
8.2.3 North America Clobetasol Propionate Revenue (USD Million) by Applications (2018-2022)
8.3 Europe Clobetasol Propionate Revenue (USD Million), by Type, and Applications (USD Million) (2018-2022)
8.3.1 Europe Clobetasol Propionate Revenue (USD Million), by Country (2018-2022)
8.3.2 Europe Clobetasol Propionate Revenue (USD Million) by Type (2018-2022)
8.3.3 Europe Clobetasol Propionate Revenue (USD Million) by Applications (2018-2022)
8.4 Asia Pacific Clobetasol Propionate Revenue (USD Million), and Revenue (USD Million) by Type, and Applications (2018-2022)
8.4.1 Asia Pacific Clobetasol Propionate Revenue (USD Million) by Country (2018-2022)
8.4.2 Asia Pacific Clobetasol Propionate Revenue (USD Million) by Type (2018-2022)
8.4.3 Asia Pacific Clobetasol Propionate Revenue (USD Million) by Applications (2018-2022)
8.5 South America Clobetasol Propionate Revenue (USD Million), by Type, and Applications (2018-2022)
8.5.1 South America Clobetasol Propionate Revenue (USD Million), by Country (2018-2022)
8.5.2 South America Clobetasol Propionate Revenue (USD Million) by Type (2018-2022)
8.5.3 South America Clobetasol Propionate Revenue (USD Million) by Applications (2018-2022)
8.6 Middle East and Africa Clobetasol Propionate Revenue (USD Million), by Type, Technology, Application, Thickness (2018-2022)
8.6.1 Middle East and Africa Clobetasol Propionate Revenue (USD Million) by Country (2018-2022)
8.6.2 Middle East and Africa Clobetasol Propionate Revenue (USD Million) by Type (2018-2022)
8.6.3 Middle East and Africa Clobetasol Propionate Revenue (USD Million) by Applications (2018-2022)
9 Company Profiles
10 Global Clobetasol Propionate Market Revenue (USD Million), by Type, and Applications (2023-2030)
10.1 Global Clobetasol Propionate Revenue (USD Million) and Market Share (%) by Type (2023-2030)
10.1.1 Global Clobetasol Propionate Revenue (USD Million), and Market Share (%) by Type (2023-2030)
10.2 Global Clobetasol Propionate Revenue (USD Million) and Market Share (%) by Applications (2023-2030)
10.2.1 Global Clobetasol Propionate Revenue (USD Million), and Market Share (%) by Applications (2023-2030)
11 Global Clobetasol Propionate Development Regional Status and Outlook Forecast
11.1 Global Clobetasol Propionate Revenue (USD Million) By Regions (2023-2030)
11.2 North America Clobetasol Propionate Revenue (USD Million) by Type, and Applications (2023-2030)
11.2.1 North America Clobetasol Propionate Revenue (USD) Million by Country (2023-2030)
11.2.2 North America Clobetasol Propionate Revenue (USD Million), by Type (2023-2030)
11.2.3 North America Clobetasol Propionate Revenue (USD Million), Market Share (%) by Applications (2023-2030)
11.3 Europe Clobetasol Propionate Revenue (USD Million), by Type, and Applications (2023-2030)
11.3.1 Europe Clobetasol Propionate Revenue (USD Million), by Country (2023-2030)
11.3.2 Europe Clobetasol Propionate Revenue (USD Million), by Type (2023-2030)
11.3.3 Europe Clobetasol Propionate Revenue (USD Million), by Applications (2023-2030)
11.4 Asia Pacific Clobetasol Propionate Revenue (USD Million) by Type, and Applications (2023-2030)
11.4.1 Asia Pacific Clobetasol Propionate Revenue (USD Million), by Country (2023-2030)
11.4.2 Asia Pacific Clobetasol Propionate Revenue (USD Million), by Type (2023-2030)
11.4.3 Asia Pacific Clobetasol Propionate Revenue (USD Million), by Applications (2023-2030)
11.5 South America Clobetasol Propionate Revenue (USD Million), by Type, and Applications (2023-2030)
11.5.1 South America Clobetasol Propionate Revenue (USD Million), by Country (2023-2030)
11.5.2 South America Clobetasol Propionate Revenue (USD Million), by Type (2023-2030)
11.5.3 South America Clobetasol Propionate Revenue (USD Million), by Applications (2023-2030)
11.6 Middle East and Africa Clobetasol Propionate Revenue (USD Million), by Type, and Applications (2023-2030)
11.6.1 Middle East and Africa Clobetasol Propionate Revenue (USD Million), by Region (2023-2030)
11.6.2 Middle East and Africa Clobetasol Propionate Revenue (USD Million), by Type (2023-2030)
11.6.3 Middle East and Africa Clobetasol Propionate Revenue (USD Million), by Applications (2023-2030)
12 Methodology and Data Sources
12.1 Methodology/Research Approach
12.1.1 Research Programs/Design
12.1.2 Market Size Estimation
12.1.3 Market Breakdown and Data Triangulation
12.2 Data Sources
12.2.1 Secondary Sources
12.2.2 Primary Sources
12.3 Disclaimer
List of Tables
Table 1 Market Segmentation Analysis
Table 2 Global Clobetasol Propionate Market Companies with Areas Served
Table 3 Products Offerings Global Clobetasol Propionate Market
Table 4 Low Growth Scenario Forecasts
Table 5 Reference Case Growth Scenario
Table 6 High Growth Case Scenario
Table 7 Global Clobetasol Propionate Revenue (USD Million) And CAGR (%) By Type (2018-2030)
Table 8 Global Clobetasol Propionate Revenue (USD Million) And CAGR (%) By Applications (2018-2030)
Table 9 Global Clobetasol Propionate Revenue (USD Million) And CAGR (%) By Regions (2018-2030)
Table 10 Global Clobetasol Propionate Revenue (USD Million) By Type (2018-2022)
Table 11 Global Clobetasol Propionate Revenue Market Share (%) By Type (2018-2022)
Table 12 Global Clobetasol Propionate Revenue (USD Million) By Applications (2018-2022)
Table 13 Global Clobetasol Propionate Revenue Market Share (%) By Applications (2018-2022)
Table 14 Global Clobetasol Propionate Market Revenue (USD Million) By Regions (2018-2022)
Table 15 Global Clobetasol Propionate Market Share (%) By Regions (2018-2022)
Table 16 North America Clobetasol Propionate Revenue (USD Million) By Country (2018-2022)
Table 17 North America Clobetasol Propionate Revenue (USD Million) By Type (2018-2022)
Table 18 North America Clobetasol Propionate Revenue (USD Million) By Applications (2018-2022)
Table 19 Europe Clobetasol Propionate Revenue (USD Million) By Country (2018-2022)
Table 20 Europe Clobetasol Propionate Revenue (USD Million) By Type (2018-2022)
Table 21 Europe Clobetasol Propionate Revenue (USD Million) By Applications (2018-2022)
Table 22 Asia Pacific Clobetasol Propionate Revenue (USD Million) By Country (2018-2022)
Table 23 Asia Pacific Clobetasol Propionate Revenue (USD Million) By Type (2018-2022)
Table 24 Asia Pacific Clobetasol Propionate Revenue (USD Million) By Applications (2018-2022)
Table 25 South America Clobetasol Propionate Revenue (USD Million) By Country (2018-2022)
Table 26 South America Clobetasol Propionate Revenue (USD Million) By Type (2018-2022)
Table 27 South America Clobetasol Propionate Revenue (USD Million) By Applications (2018-2022)
Table 28 Middle East and Africa Clobetasol Propionate Revenue (USD Million) By Region (2018-2022)
Table 29 Middle East and Africa Clobetasol Propionate Revenue (USD Million) By Type (2018-2022)
Table 30 Middle East and Africa Clobetasol Propionate Revenue (USD Million) By Applications (2018-2022)
Table 31 Financial Analysis
Table 32 Global Clobetasol Propionate Revenue (USD Million) By Type (2023-2030)
Table 33 Global Clobetasol Propionate Revenue Market Share (%) By Type (2023-2030)
Table 34 Global Clobetasol Propionate Revenue (USD Million) By Applications (2023-2030)
Table 35 Global Clobetasol Propionate Revenue Market Share (%) By Applications (2023-2030)
Table 36 Global Clobetasol Propionate Market Revenue (USD Million), And Revenue (USD Million) By Regions (2023-2030)
Table 37 North America Clobetasol Propionate Revenue (USD)By Country (2023-2030)
Table 38 North America Clobetasol Propionate Revenue (USD Million) By Type (2023-2030)
Table 39 North America Clobetasol Propionate Revenue (USD Million) By Applications (2023-2030)
Table 40 Europe Clobetasol Propionate Revenue (USD Million) By Country (2023-2030)
Table 41 Europe Clobetasol Propionate Revenue (USD Million) By Type (2023-2030)
Table 42 Europe Clobetasol Propionate Revenue (USD Million) By Applications (2023-2030)
Table 43 Asia Pacific Clobetasol Propionate Revenue (USD Million) By Country (2023-2030)
Table 44 Asia Pacific Clobetasol Propionate Revenue (USD Million) By Type (2023-2030)
Table 45 Asia Pacific Clobetasol Propionate Revenue (USD Million) By Applications (2023-2030)
Table 46 South America Clobetasol Propionate Revenue (USD Million) By Country (2023-2030)
Table 47 South America Clobetasol Propionate Revenue (USD Million) By Type (2023-2030)
Table 48 South America Clobetasol Propionate Revenue (USD Million) By Applications (2023-2030)
Table 49 Middle East and Africa Clobetasol Propionate Revenue (USD Million) By Region (2023-2030)
Table 50 Middle East and Africa Clobetasol Propionate Revenue (USD Million) By Region (2023-2030)
Table 51 Middle East and Africa Clobetasol Propionate Revenue (USD Million) By Type (2023-2030)
Table 52 Middle East and Africa Clobetasol Propionate Revenue (USD Million) By Applications (2023-2030)
Table 53 Research Programs/Design for This Report
Table 54 Key Data Information from Secondary Sources
Table 55 Key Data Information from Primary Sources
List of Figures
Figure 1 Market Scope
Figure 2 Porter’s Five Forces
Figure 3 Global Clobetasol Propionate Revenue (USD Million) By Type (2018-2022)
Figure 4 Global Clobetasol Propionate Revenue Market Share (%) By Type (2022)
Figure 5 Global Clobetasol Propionate Revenue (USD Million) By Applications (2018-2022)
Figure 6 Global Clobetasol Propionate Revenue Market Share (%) By Applications (2022)
Figure 7 Global Clobetasol Propionate Market Revenue (USD Million) By Regions (2018-2022)
Figure 8 Global Clobetasol Propionate Market Share (%) By Regions (2022)
Figure 9 North America Clobetasol Propionate Revenue (USD Million) By Country (2018-2022)
Figure 10 North America Clobetasol Propionate Revenue (USD Million) By Type (2018-2022)
Figure 11 North America Clobetasol Propionate Revenue (USD Million) By Applications (2018-2022)
Figure 12 Europe Clobetasol Propionate Revenue (USD Million) By Country (2018-2022)
Figure 13 Europe Clobetasol Propionate Revenue (USD Million) By Type (2018-2022)
Figure 14 Europe Clobetasol Propionate Revenue (USD Million) By Applications (2018-2022)
Figure 15 Asia Pacific Clobetasol Propionate Revenue (USD Million) By Country (2018-2022)
Figure 16 Asia Pacific Clobetasol Propionate Revenue (USD Million) By Type (2018-2022)
Figure 17 Asia Pacific Clobetasol Propionate Revenue (USD Million) By Applications (2018-2022)
Figure 18 South America Clobetasol Propionate Revenue (USD Million) By Country (2018-2022)
Figure 19 South America Clobetasol Propionate Revenue (USD Million) By Type (2018-2022)
Figure 20 South America Clobetasol Propionate Revenue (USD Million) By Applications (2018-2022)
Figure 21 Middle East and Africa Clobetasol Propionate Revenue (USD Million) By Region (2018-2022)
Figure 22 Middle East and Africa Clobetasol Propionate Revenue (USD Million) By Type (2018-2022)
Figure 23 Middle East and Africa Clobetasol Propionate Revenue (USD Million) By Applications (2018-2022)
Figure 24 Global Clobetasol Propionate Revenue (USD Million) By Type (2023-2030)
Figure 25 Global Clobetasol Propionate Revenue Market Share (%) By Type (2030)
Figure 26 Global Clobetasol Propionate Revenue (USD Million) By Applications (2023-2030)
Figure 27 Global Clobetasol Propionate Revenue Market Share (%) By Applications (2030)
Figure 28 Global Clobetasol Propionate Market Revenue (USD Million) By Regions (2023-2030)
Figure 29 North America Clobetasol Propionate Revenue (USD Million) By Country (2023-2030)
Figure 30 North America Clobetasol Propionate Revenue (USD Million) By Type (2023-2030)
Figure 31 North America Clobetasol Propionate Revenue (USD Million) By Applications (2023-2030)
Figure 32 Europe Clobetasol Propionate Revenue (USD Million) By Country (2023-2030)
Figure 33 Europe Clobetasol Propionate Revenue (USD Million) By Type (2023-2030)
Figure 34 Europe Clobetasol Propionate Revenue (USD Million) By Applications (2023-2030)
Figure 35 Asia Pacific Clobetasol Propionate Revenue (USD Million) By Country (2023-2030)
Figure 36 Asia Pacific Clobetasol Propionate Revenue (USD Million) By Type (2023-2030)
Figure 37 Asia Pacific Clobetasol Propionate Revenue (USD Million) By Applications (2023-2030)
Figure 38 South America Clobetasol Propionate Revenue (USD Million) By Country (2023-2030)
Figure 39 South America Clobetasol Propionate Revenue (USD Million) By Type (2023-2030)
Figure 40 South America Clobetasol Propionate Revenue (USD Million) By Applications (2023-2030)
Figure 41 Middle East and Africa Clobetasol Propionate Revenue (USD Million) By Region (2023-2030)
Figure 42 Middle East and Africa Clobetasol Propionate Revenue (USD Million) By Region (2023-2030)
Figure 43 Middle East and Africa Clobetasol Propionate Revenue (USD Million) By Type (2023-2030)
Figure 44 Middle East and Africa Clobetasol Propionate Revenue (USD Million) By Applications (2023-2030)
Figure 45 Bottom-Up and Top-Down Approaches For This Report
Figure 46 Data Triangulation
