
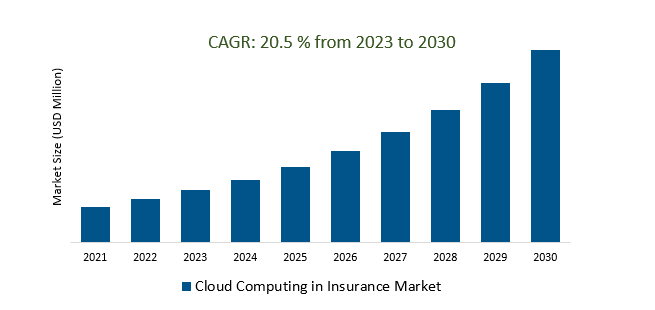
The Global Cloud Computing in Insurance Market Size is estimated to register 20.5% growth over the forecast period from 2023 to 2030.
The market growth is driven by an increasing the insurance industry is undergoing a digital transformation, and cloud technologies provide a foundation for deploying digital solutions like mobile apps, customer portals, and data analytics. Leading Companies focusing on Advanced Data Analytics, Digital Transformation, Cybersecurity, Hybrid and Multi-Cloud Strategies, and others to boost market shares in the industry.
Cloud computing in the insurance market has revolutionized the industry by offering cost-efficiency, and scalability, and facilitating digital transformation. It enables data analytics, AI, and machine learning, while supporting mobility, security, and compliance. Disaster recovery and business continuity are enhanced, and legacy systems are modernized. Collaboration with cloud providers and insurtech companies expands service offerings, focusing on customer-centric solutions, risk management, and overall operational efficiency, positioning insurance companies to adapt to evolving customer expectations, regulatory demands, and market dynamics.
Cloud computing is playing a pivotal role in reshaping the insurance landscape as IoT and telematics technologies drive a transformative shift. These innovations empower insurers to collect and analyze real-time data, allowing for a deeper understanding of risk and enabling the provision of more personalized and cost-effective insurance products and services. With the cloud as the backbone, insurers can efficiently process and leverage vast quantities of data from connected devices, such as vehicles and smart home systems, resulting in more accurate underwriting, proactive risk management, and tailored policies that cater to individual customer needs.
Ecosystem partnerships are becoming a driving force behind the increasing demand for cloud computing in the insurance market. These partnerships empower insurers to collaborate with their network of partners more effectively and efficiently. Cloud technology acts as the enabler, providing the necessary infrastructure and tools for seamless communication, data sharing, and the rapid deployment of innovative services. This trend not only fosters greater competitiveness in the industry but also accelerates the development and delivery of customer-centric solutions, ultimately enhancing the insurance experience for policyholders and stakeholders alike.
Cloud computing's environmental impact is a growing concern, primarily attributed to the substantial energy consumption and carbon emissions associated with data centers. While cloud providers often implement energy-efficient practices and data center designs, the sheer scale of cloud infrastructure worldwide contributes to a notable carbon footprint. As the insurance industry continues to embrace cloud solutions, insurers may seek ways to minimize this environmental impact by promoting sustainable data center practices, renewable energy sourcing, and carbon offset initiatives, aligning with broader corporate social responsibility goals.
The Global Cloud Computing in the Insurance Market is analyzed across Software, Hardware, Services, and others. Services is poised to register the fastest growth. Cloud computing services in the insurance market include IaaS, PaaS, and SaaS for infrastructure, application, and software solutions, as well as data analytics, machine learning, disaster recovery, security, and IoT services. These offerings enhance operational efficiency, data management, customer experiences, and innovation, enabling insurers to adapt to a digital and data-driven landscape effectively.
The Global Cloud Computing in Insurance Market is analyzed across various Organizations including Corporate, Individuals, and others. Of these, Corporate held a significant market share in 2023. Corporate cloud computing in the insurance market involves insurance companies using cloud-based technologies and services like IaaS, PaaS, SaaS, data analytics, machine learning, and security to streamline operations, enhance data management, improve customer experiences, and drive innovation. This enables insurers to stay competitive and adapt to the evolving digital landscape.
By Component
By Application
By Service
By Technology
By Deployment
By Region
*List not exhaustive
Cloud Computing in Insurance Market Outlook 2023
1 Market Overview
1.1 Introduction to the Cloud Computing in Insurance Market
1.2 Scope of the Study
1.3 Research Objective
1.3.1 Key Market Scope and Segments
1.3.2 Players Covered
1.3.3 Years Considered
2 Executive Summary
2.1 2023 Cloud Computing in Insurance Industry- Market Statistics
3 Market Dynamics
3.1 Market Drivers
3.2 Market Challenges
3.3 Market Opportunities
3.4 Market Trends
4 Market Factor Analysis
4.1 Porter’s Five Forces
4.2 Market Entropy
4.2.1 Global Cloud Computing in Insurance Market Companies with Area Served
4.2.2 Products Offerings Global Cloud Computing in Insurance Market
5 COVID-19 Impact Analysis and Outlook Scenarios
5.1.1 Covid-19 Impact Analysis
5.1.2 Post-COVID-19 Scenario- Low Growth Case
5.1.3 Post-COVID-19 Scenario- Reference Growth Case
5.1.4 Post-COVID-19 Scenario- Low Growth Case
6 Global Cloud Computing in Insurance Market Trends
6.1 Global Cloud Computing in Insurance Revenue (USD Million) and CAGR (%) by Type (2018-2030)
6.2 Global Cloud Computing in Insurance Revenue (USD Million) and CAGR (%) by Applications (2018-2030)
6.3 Global Cloud Computing in Insurance Revenue (USD Million) and CAGR (%) by Regions (2018-2030)
7 Global Cloud Computing in Insurance Market Revenue (USD Million) by Type, and Applications (2018-2022)
7.1 Global Cloud Computing in Insurance Revenue (USD Million) by Type (2018-2022)
7.1.1 Global Cloud Computing in Insurance Revenue (USD Million), Market Share (%) by Type (2018-2022)
7.2 Global Cloud Computing in Insurance Revenue (USD Million) by Applications (2018-2022)
7.2.1 Global Cloud Computing in Insurance Revenue (USD Million), Market Share (%) by Applications (2018-2022)
8 Global Cloud Computing in Insurance Development Regional Status and Outlook
8.1 Global Cloud Computing in Insurance Revenue (USD Million) By Regions (2018-2022)
8.2 North America Cloud Computing in Insurance Revenue (USD Million) by Type, and Application (2018-2022)
8.2.1 North America Cloud Computing in Insurance Revenue (USD Million) by Country (2018-2022)
8.2.2 North America Cloud Computing in Insurance Revenue (USD Million) by Type (2018-2022)
8.2.3 North America Cloud Computing in Insurance Revenue (USD Million) by Applications (2018-2022)
8.3 Europe Cloud Computing in Insurance Revenue (USD Million), by Type, and Applications (USD Million) (2018-2022)
8.3.1 Europe Cloud Computing in Insurance Revenue (USD Million), by Country (2018-2022)
8.3.2 Europe Cloud Computing in Insurance Revenue (USD Million) by Type (2018-2022)
8.3.3 Europe Cloud Computing in Insurance Revenue (USD Million) by Applications (2018-2022)
8.4 Asia Pacific Cloud Computing in Insurance Revenue (USD Million), and Revenue (USD Million) by Type, and Applications (2018-2022)
8.4.1 Asia Pacific Cloud Computing in Insurance Revenue (USD Million) by Country (2018-2022)
8.4.2 Asia Pacific Cloud Computing in Insurance Revenue (USD Million) by Type (2018-2022)
8.4.3 Asia Pacific Cloud Computing in Insurance Revenue (USD Million) by Applications (2018-2022)
8.5 South America Cloud Computing in Insurance Revenue (USD Million), by Type, and Applications (2018-2022)
8.5.1 South America Cloud Computing in Insurance Revenue (USD Million), by Country (2018-2022)
8.5.2 South America Cloud Computing in Insurance Revenue (USD Million) by Type (2018-2022)
8.5.3 South America Cloud Computing in Insurance Revenue (USD Million) by Applications (2018-2022)
8.6 Middle East and Africa Cloud Computing in Insurance Revenue (USD Million), by Type, Technology, Application, Thickness (2018-2022)
8.6.1 Middle East and Africa Cloud Computing in Insurance Revenue (USD Million) by Country (2018-2022)
8.6.2 Middle East and Africa Cloud Computing in Insurance Revenue (USD Million) by Type (2018-2022)
8.6.3 Middle East and Africa Cloud Computing in Insurance Revenue (USD Million) by Applications (2018-2022)
9 Company Profiles
10 Global Cloud Computing in Insurance Market Revenue (USD Million), by Type, and Applications (2023-2030)
10.1 Global Cloud Computing in Insurance Revenue (USD Million) and Market Share (%) by Type (2023-2030)
10.1.1 Global Cloud Computing in Insurance Revenue (USD Million), and Market Share (%) by Type (2023-2030)
10.2 Global Cloud Computing in Insurance Revenue (USD Million) and Market Share (%) by Applications (2023-2030)
10.2.1 Global Cloud Computing in Insurance Revenue (USD Million), and Market Share (%) by Applications (2023-2030)
11 Global Cloud Computing in Insurance Development Regional Status and Outlook Forecast
11.1 Global Cloud Computing in Insurance Revenue (USD Million) By Regions (2023-2030)
11.2 North America Cloud Computing in Insurance Revenue (USD Million) by Type, and Applications (2023-2030)
11.2.1 North America Cloud Computing in Insurance Revenue (USD) Million by Country (2023-2030)
11.2.2 North America Cloud Computing in Insurance Revenue (USD Million), by Type (2023-2030)
11.2.3 North America Cloud Computing in Insurance Revenue (USD Million), Market Share (%) by Applications (2023-2030)
11.3 Europe Cloud Computing in Insurance Revenue (USD Million), by Type, and Applications (2023-2030)
11.3.1 Europe Cloud Computing in Insurance Revenue (USD Million), by Country (2023-2030)
11.3.2 Europe Cloud Computing in Insurance Revenue (USD Million), by Type (2023-2030)
11.3.3 Europe Cloud Computing in Insurance Revenue (USD Million), by Applications (2023-2030)
11.4 Asia Pacific Cloud Computing in Insurance Revenue (USD Million) by Type, and Applications (2023-2030)
11.4.1 Asia Pacific Cloud Computing in Insurance Revenue (USD Million), by Country (2023-2030)
11.4.2 Asia Pacific Cloud Computing in Insurance Revenue (USD Million), by Type (2023-2030)
11.4.3 Asia Pacific Cloud Computing in Insurance Revenue (USD Million), by Applications (2023-2030)
11.5 South America Cloud Computing in Insurance Revenue (USD Million), by Type, and Applications (2023-2030)
11.5.1 South America Cloud Computing in Insurance Revenue (USD Million), by Country (2023-2030)
11.5.2 South America Cloud Computing in Insurance Revenue (USD Million), by Type (2023-2030)
11.5.3 South America Cloud Computing in Insurance Revenue (USD Million), by Applications (2023-2030)
11.6 Middle East and Africa Cloud Computing in Insurance Revenue (USD Million), by Type, and Applications (2023-2030)
11.6.1 Middle East and Africa Cloud Computing in Insurance Revenue (USD Million), by Region (2023-2030)
11.6.2 Middle East and Africa Cloud Computing in Insurance Revenue (USD Million), by Type (2023-2030)
11.6.3 Middle East and Africa Cloud Computing in Insurance Revenue (USD Million), by Applications (2023-2030)
12 Methodology and Data Sources
12.1 Methodology/Research Approach
12.1.1 Research Programs/Design
12.1.2 Market Size Estimation
12.1.3 Market Breakdown and Data Triangulation
12.2 Data Sources
12.2.1 Secondary Sources
12.2.2 Primary Sources
12.3 Disclaimer
List of Tables
Table 1 Market Segmentation Analysis
Table 2 Global Cloud Computing in Insurance Market Companies with Areas Served
Table 3 Products Offerings Global Cloud Computing in Insurance Market
Table 4 Low Growth Scenario Forecasts
Table 5 Reference Case Growth Scenario
Table 6 High Growth Case Scenario
Table 7 Global Cloud Computing in Insurance Revenue (USD Million) And CAGR (%) By Type (2018-2030)
Table 8 Global Cloud Computing in Insurance Revenue (USD Million) And CAGR (%) By Applications (2018-2030)
Table 9 Global Cloud Computing in Insurance Revenue (USD Million) And CAGR (%) By Regions (2018-2030)
Table 10 Global Cloud Computing in Insurance Revenue (USD Million) By Type (2018-2022)
Table 11 Global Cloud Computing in Insurance Revenue Market Share (%) By Type (2018-2022)
Table 12 Global Cloud Computing in Insurance Revenue (USD Million) By Applications (2018-2022)
Table 13 Global Cloud Computing in Insurance Revenue Market Share (%) By Applications (2018-2022)
Table 14 Global Cloud Computing in Insurance Market Revenue (USD Million) By Regions (2018-2022)
Table 15 Global Cloud Computing in Insurance Market Share (%) By Regions (2018-2022)
Table 16 North America Cloud Computing in Insurance Revenue (USD Million) By Country (2018-2022)
Table 17 North America Cloud Computing in Insurance Revenue (USD Million) By Type (2018-2022)
Table 18 North America Cloud Computing in Insurance Revenue (USD Million) By Applications (2018-2022)
Table 19 Europe Cloud Computing in Insurance Revenue (USD Million) By Country (2018-2022)
Table 20 Europe Cloud Computing in Insurance Revenue (USD Million) By Type (2018-2022)
Table 21 Europe Cloud Computing in Insurance Revenue (USD Million) By Applications (2018-2022)
Table 22 Asia Pacific Cloud Computing in Insurance Revenue (USD Million) By Country (2018-2022)
Table 23 Asia Pacific Cloud Computing in Insurance Revenue (USD Million) By Type (2018-2022)
Table 24 Asia Pacific Cloud Computing in Insurance Revenue (USD Million) By Applications (2018-2022)
Table 25 South America Cloud Computing in Insurance Revenue (USD Million) By Country (2018-2022)
Table 26 South America Cloud Computing in Insurance Revenue (USD Million) By Type (2018-2022)
Table 27 South America Cloud Computing in Insurance Revenue (USD Million) By Applications (2018-2022)
Table 28 Middle East and Africa Cloud Computing in Insurance Revenue (USD Million) By Region (2018-2022)
Table 29 Middle East and Africa Cloud Computing in Insurance Revenue (USD Million) By Type (2018-2022)
Table 30 Middle East and Africa Cloud Computing in Insurance Revenue (USD Million) By Applications (2018-2022)
Table 31 Financial Analysis
Table 32 Global Cloud Computing in Insurance Revenue (USD Million) By Type (2023-2030)
Table 33 Global Cloud Computing in Insurance Revenue Market Share (%) By Type (2023-2030)
Table 34 Global Cloud Computing in Insurance Revenue (USD Million) By Applications (2023-2030)
Table 35 Global Cloud Computing in Insurance Revenue Market Share (%) By Applications (2023-2030)
Table 36 Global Cloud Computing in Insurance Market Revenue (USD Million), And Revenue (USD Million) By Regions (2023-2030)
Table 37 North America Cloud Computing in Insurance Revenue (USD)By Country (2023-2030)
Table 38 North America Cloud Computing in Insurance Revenue (USD Million) By Type (2023-2030)
Table 39 North America Cloud Computing in Insurance Revenue (USD Million) By Applications (2023-2030)
Table 40 Europe Cloud Computing in Insurance Revenue (USD Million) By Country (2023-2030)
Table 41 Europe Cloud Computing in Insurance Revenue (USD Million) By Type (2023-2030)
Table 42 Europe Cloud Computing in Insurance Revenue (USD Million) By Applications (2023-2030)
Table 43 Asia Pacific Cloud Computing in Insurance Revenue (USD Million) By Country (2023-2030)
Table 44 Asia Pacific Cloud Computing in Insurance Revenue (USD Million) By Type (2023-2030)
Table 45 Asia Pacific Cloud Computing in Insurance Revenue (USD Million) By Applications (2023-2030)
Table 46 South America Cloud Computing in Insurance Revenue (USD Million) By Country (2023-2030)
Table 47 South America Cloud Computing in Insurance Revenue (USD Million) By Type (2023-2030)
Table 48 South America Cloud Computing in Insurance Revenue (USD Million) By Applications (2023-2030)
Table 49 Middle East and Africa Cloud Computing in Insurance Revenue (USD Million) By Region (2023-2030)
Table 50 Middle East and Africa Cloud Computing in Insurance Revenue (USD Million) By Region (2023-2030)
Table 51 Middle East and Africa Cloud Computing in Insurance Revenue (USD Million) By Type (2023-2030)
Table 52 Middle East and Africa Cloud Computing in Insurance Revenue (USD Million) By Applications (2023-2030)
Table 53 Research Programs/Design for This Report
Table 54 Key Data Information from Secondary Sources
Table 55 Key Data Information from Primary Sources
List of Figures
Figure 1 Market Scope
Figure 2 Porter’s Five Forces
Figure 3 Global Cloud Computing in Insurance Revenue (USD Million) By Type (2018-2022)
Figure 4 Global Cloud Computing in Insurance Revenue Market Share (%) By Type (2022)
Figure 5 Global Cloud Computing in Insurance Revenue (USD Million) By Applications (2018-2022)
Figure 6 Global Cloud Computing in Insurance Revenue Market Share (%) By Applications (2022)
Figure 7 Global Cloud Computing in Insurance Market Revenue (USD Million) By Regions (2018-2022)
Figure 8 Global Cloud Computing in Insurance Market Share (%) By Regions (2022)
Figure 9 North America Cloud Computing in Insurance Revenue (USD Million) By Country (2018-2022)
Figure 10 North America Cloud Computing in Insurance Revenue (USD Million) By Type (2018-2022)
Figure 11 North America Cloud Computing in Insurance Revenue (USD Million) By Applications (2018-2022)
Figure 12 Europe Cloud Computing in Insurance Revenue (USD Million) By Country (2018-2022)
Figure 13 Europe Cloud Computing in Insurance Revenue (USD Million) By Type (2018-2022)
Figure 14 Europe Cloud Computing in Insurance Revenue (USD Million) By Applications (2018-2022)
Figure 15 Asia Pacific Cloud Computing in Insurance Revenue (USD Million) By Country (2018-2022)
Figure 16 Asia Pacific Cloud Computing in Insurance Revenue (USD Million) By Type (2018-2022)
Figure 17 Asia Pacific Cloud Computing in Insurance Revenue (USD Million) By Applications (2018-2022)
Figure 18 South America Cloud Computing in Insurance Revenue (USD Million) By Country (2018-2022)
Figure 19 South America Cloud Computing in Insurance Revenue (USD Million) By Type (2018-2022)
Figure 20 South America Cloud Computing in Insurance Revenue (USD Million) By Applications (2018-2022)
Figure 21 Middle East and Africa Cloud Computing in Insurance Revenue (USD Million) By Region (2018-2022)
Figure 22 Middle East and Africa Cloud Computing in Insurance Revenue (USD Million) By Type (2018-2022)
Figure 23 Middle East and Africa Cloud Computing in Insurance Revenue (USD Million) By Applications (2018-2022)
Figure 24 Global Cloud Computing in Insurance Revenue (USD Million) By Type (2023-2030)
Figure 25 Global Cloud Computing in Insurance Revenue Market Share (%) By Type (2030)
Figure 26 Global Cloud Computing in Insurance Revenue (USD Million) By Applications (2023-2030)
Figure 27 Global Cloud Computing in Insurance Revenue Market Share (%) By Applications (2030)
Figure 28 Global Cloud Computing in Insurance Market Revenue (USD Million) By Regions (2023-2030)
Figure 29 North America Cloud Computing in Insurance Revenue (USD Million) By Country (2023-2030)
Figure 30 North America Cloud Computing in Insurance Revenue (USD Million) By Type (2023-2030)
Figure 31 North America Cloud Computing in Insurance Revenue (USD Million) By Applications (2023-2030)
Figure 32 Europe Cloud Computing in Insurance Revenue (USD Million) By Country (2023-2030)
Figure 33 Europe Cloud Computing in Insurance Revenue (USD Million) By Type (2023-2030)
Figure 34 Europe Cloud Computing in Insurance Revenue (USD Million) By Applications (2023-2030)
Figure 35 Asia Pacific Cloud Computing in Insurance Revenue (USD Million) By Country (2023-2030)
Figure 36 Asia Pacific Cloud Computing in Insurance Revenue (USD Million) By Type (2023-2030)
Figure 37 Asia Pacific Cloud Computing in Insurance Revenue (USD Million) By Applications (2023-2030)
Figure 38 South America Cloud Computing in Insurance Revenue (USD Million) By Country (2023-2030)
Figure 39 South America Cloud Computing in Insurance Revenue (USD Million) By Type (2023-2030)
Figure 40 South America Cloud Computing in Insurance Revenue (USD Million) By Applications (2023-2030)
Figure 41 Middle East and Africa Cloud Computing in Insurance Revenue (USD Million) By Region (2023-2030)
Figure 42 Middle East and Africa Cloud Computing in Insurance Revenue (USD Million) By Region (2023-2030)
Figure 43 Middle East and Africa Cloud Computing in Insurance Revenue (USD Million) By Type (2023-2030)
Figure 44 Middle East and Africa Cloud Computing in Insurance Revenue (USD Million) By Applications (2023-2030)
Figure 45 Bottom-Up and Top-Down Approaches For This Report
Figure 46 Data Triangulation
By Component
By Application
By Service
By Technology
By Deployment
By Region