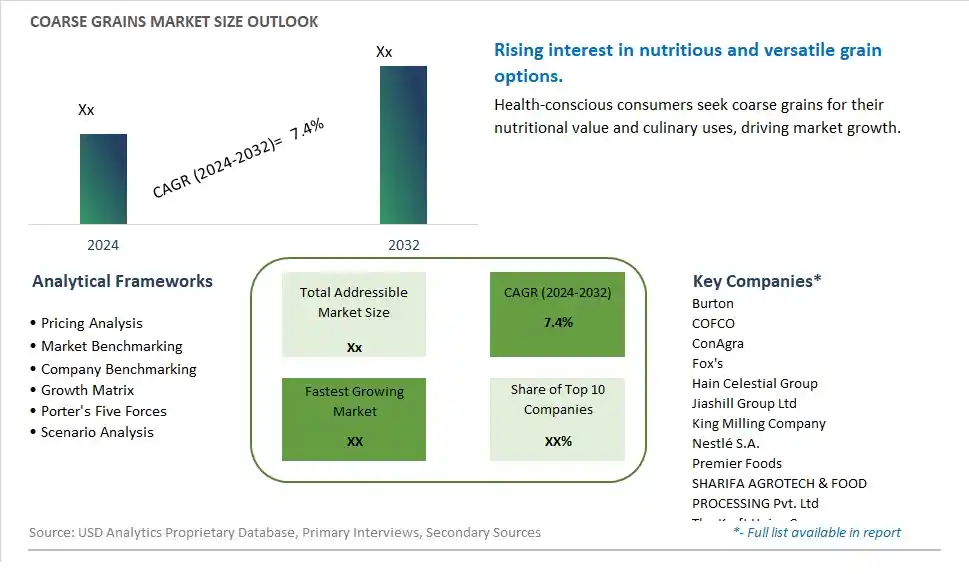
Global Coarse Grains Market Size is valued at $XX Million in 2024 and is forecast to register a growth rate (CAGR) of 7.4% to reach $XX Million by 2032.
The global Coarse Grains Market Comprehensive Study analyzes and forecasts the market size across 6 regions and 24 countries for diverse segments -By Type (Cereals, Mixed Beans, Tubers), By Application (Food, Cosmetic, Animal Food, Chemical, Others)
An Introduction to Coarse Grains Market
In 2024, the Coarse Grains market is witnessing significant growth, driven by the increasing demand for diverse and nutrient-dense grains in the food industry. Coarse grains, including barley, millet, sorghum, and oats, are valued for their high fiber content, essential nutrients, and versatility in various culinary applications. The market is supported by the growing trend towards healthy eating and the demand for gluten-free and whole grain products. Advances in agricultural practices and processing technologies are enhancing the quality, yield, and availability of coarse grains. The market is also benefiting from the trend towards sustainable and locally sourced ingredients, appealing to health-conscious consumers seeking nutritious and environmentally friendly food options.
Coarse Grains Competitive Landscape
The market report analyses the leading companies in the industry including Burton, COFCO, ConAgra, Fox's, Hain Celestial Group, Jiashill Group Ltd, King Milling Company, Nestlé S.A., Premier Foods, SHARIFA AGROTECH & FOOD PROCESSING Pvt. Ltd, The Kraft Heinz Company, Tiandihui Foodstuffs, Unilever, and Others.
Coarse Grains Market Dynamics
Coarse Grains Market Trend: Rising Demand for Healthy and Nutrient-Dense Foods
A prominent market trend for coarse grains is the rising demand among consumers for healthy and nutrient-dense foods. With increasing awareness of the importance of a balanced diet and nutritional benefits, there's a growing preference for coarse grains such as barley, quinoa, millet, and bulgur among health-conscious individuals. Coarse grains are valued for their high fiber content, vitamins, minerals, and antioxidants, making them a popular choice for incorporating into wholesome meals and snacks.
Coarse Grains Market Driver: Shift Towards Plant-Based and Whole Food Diets
A key driver fueling the market for coarse grains is the shift towards plant-based and whole food diets. As consumers adopt healthier eating habits and seek alternatives to refined grains and processed foods, there's a demand for coarse grains as part of a balanced and sustainable diet. The market responds to this driver by offering a variety of coarse grain products, including flours, cereals, snacks, and meal ingredients, catering to consumers seeking nutritious and natural food options.
Coarse Grains Market Opportunity: Diversification and Innovation in Coarse Grain Products
An opportunity within the coarse grains market lies in diversification and innovation in coarse grain products. Manufacturers can develop innovative products such as ready-to-eat meals, convenience foods, snack bars, bakery items, and plant-based protein alternatives using coarse grains as key ingredients. Additionally, exploring value-added processing techniques, flavor enhancements, and packaging innovations can further enhance the market appeal and convenience of coarse grain products, tapping into consumer preferences for convenient, nutritious, and flavorful food options. By capitalizing on the market opportunity presented by coarse grains and their nutritional benefits, companies can meet the evolving dietary needs and preferences of health-conscious consumers.
Coarse Grains Market Share Analysis: Cereals segment generated the highest revenue share in the industry
The Cereals segment stands out as the largest segment in the Coarse Grains Market. This segment's prominence is driven by several factors contributing to its substantial market share. Cereals, including grains like corn, barley, oats, and rice, are staple food sources for billions of people worldwide, forming the basis of diets in various cultures and regions. The wide availability, versatility, and nutritional value of cereals make them a preferred choice among consumers and food manufacturers. Cereals are rich in carbohydrates, fiber, vitamins, and minerals, providing essential nutrients for energy, digestion, and overall health. Additionally, cereals are used in a diverse range of food products, including bread, pasta, breakfast cereals, snacks, and beverages, catering to diverse consumer preferences and culinary traditions. With continuous innovation in cereal cultivation, processing, and product development, the Cereals segment maintains its leadership position and is expected to witness sustained growth in the Coarse Grains Market.
Coarse Grains Market Share Analysis: Food is the fastest growing segment over the forecast period to 2032
The Food segment is anticipated to be the fastest-growing segment in the Coarse Grains Market by 2032. This rapid growth can be attributed to several key factors driving the demand for coarse grains in food applications. Firstly, coarse grains such as corn, barley, and oats are essential ingredients in a wide range of food products, including bread, pasta, cereals, snacks, and beverages. These grains offer nutritional benefits such as fiber, vitamins, and minerals, contributing to the growing consumer preference for healthy and natural food choices. Additionally, the rising global population and changing dietary preferences towards plant-based and whole grain foods have increased the consumption of coarse grains in food products. Further, advancements in food processing technologies and product formulations have expanded the usage of coarse grains in innovative and value-added food items, further driving market growth. With increasing consumer awareness of health and wellness, coupled with continuous innovation in the food industry, the Food segment of the Coarse Grains Market is poised for significant growth and market expansion in the coming years.
Coarse Grains Market Segmentation
By Type
Cereals
Mixed Beans
Tubers
By Application
Food
Cosmetic
Animal Food
Chemical
Others
Countries Analyzed
North America (US, Canada, Mexico)
Europe (Germany, UK, France, Spain, Italy, Russia, Rest of Europe)
Asia Pacific (China, India, Japan, South Korea, Australia, South East Asia, Rest of Asia)
South America (Brazil, Argentina, Rest of South America)
Middle East and Africa (Saudi Arabia, UAE, Rest of Middle East, South Africa, Egypt, Rest of Africa)
Coarse Grains Companies Profiled in the Study
Burton
COFCO
ConAgra
Fox's
Hain Celestial Group
Jiashill Group Ltd
King Milling Company
Nestlé S.A.
Premier Foods
SHARIFA AGROTECH & FOOD PROCESSING Pvt. Ltd
The Kraft Heinz Company
Tiandihui Foodstuffs
Unilever
*- List Not Exhaustive
Chapter 1. TABLE OF CONTENTS
Chapter 2. Introduction to Coarse Grains Market
2.1. Market Overview
2.2. Key Statistics and Report Highlights
2.3. Scope of the Comprehensive Study
2.3.1. Market Definition
2.3.2 Countries and Regions Covered
2.3.3 Research Objective
2.3.4 Units, Currency, and Conversions
2.3.5 Industry Value Chain
2.4. Key Market Segments
2.5. Key Companies
2.6. Study Period
Chapter 3. Strategic Analysis Review
3.1. Coarse Grains Pricing Analysis and Forecast
3.2. Porter’s Five Forces
3.3. Market Ecosystem
3.4. SWOT Analysis
3.5. Regulatory Scenario
3.3. Effects of Inflation, Russia-Ukraine War, moderating economic growth, and other macroeconomic factors
Chapter 4. Competitive Landscape
4.1. Market Share Analysis
4.1.1. Global Coarse Grains Market Share by Company, 2023
4.1.2. Product Offerings of Leading Coarse Grains Companies
4.2. Market Entropy
4.2.1. New Product Launches in the Industry
4.2.2. Mergers, Acquisitions, Joint ventures, and Partnerships
4.3. Key Strategies and Best Practices
Chapter 5. Global Market Projections: Best, Reference, and Low Case Scenarios
5.1. Growth Analysis- Case Scenario Definitions
5.2. Low Growth Case Scenario Forecasts
5.3. Reference Growth Case Scenario Forecasts
5.4. High Growth Case Scenario Forecasts
Chapter 6. Market Dynamics
6.1. Coarse Grains Market Drivers
6.2. Coarse Grains Market Challenges
6.6. Coarse Grains Market Opportunities
6.4. Coarse Grains Market Trends
Chapter 7. Global Coarse Grains Market Outlook Trends
7.1. Global Coarse Grains Revenue (USD Million) and CAGR (%) by Type (2021-2032)
7.2. Global Coarse Grains Revenue (USD Million) and CAGR (%) by Application (2021-2032)
7.3. Global Coarse Grains Revenue (USD Million) and CAGR (%) by Product (2021-2032)
By Type
Cereals
Mixed Beans
Tubers
By Application
Food
Cosmetic
Animal Food
Chemical
Others
Chapter 8. Global Coarse Grains Regional Analysis and Outlook
8.1. Global Coarse Grains Revenue (USD Million) By Regions (2021- 2032)
8.2. North America Coarse Grains Revenue (USD Million) by Country (2021-2032)
8.2.1. United States Coarse Grains Regional Analysis and Outlook
8.2.2. Canada Coarse Grains Regional Analysis and Outlook
8.2.3. Mexico Coarse Grains Regional Analysis and Outlook
8.3. Europe Coarse Grains Revenue (USD Million), by Country (2021-2032)
8.3.1. Germany Coarse Grains Regional Analysis and Outlook
8.3.2. France Coarse Grains Regional Analysis and Outlook
8.3.3. United Kingdom Coarse Grains Regional Analysis and Outlook
8.3.4. Spain Coarse Grains Regional Analysis and Outlook
8.3.5. Italy Coarse Grains Regional Analysis and Outlook
8.3.6. Russia Coarse Grains Regional Analysis and Outlook
8.3.7. Rest of Europe Coarse Grains Regional Analysis and Outlook
8.4. Asia Pacific Coarse Grains Revenue (USD Million) by Country (2021-2032)
8.4.1. China Coarse Grains Regional Analysis and Outlook
8.4.2. Japan Coarse Grains Regional Analysis and Outlook
8.4.3. India Coarse Grains Regional Analysis and Outlook
8.4.4. South Korea Coarse Grains Regional Analysis and Outlook
8.4.5. Australia Coarse Grains Regional Analysis and Outlook
8.4.6. South East Asia Coarse Grains Regional Analysis and Outlook
8.4.7. Rest of Asia Pacific Coarse Grains Regional Analysis and Outlook
8.5. South America Coarse Grains Revenue (USD Million), by Country (2021-2032)
8.5.1. Brazil Coarse Grains Regional Analysis and Outlook
8.5.2. Argentina Coarse Grains Regional Analysis and Outlook
8.5.3. Rest of South America Coarse Grains Regional Analysis and Outlook
8.6. Middle East and Africa Coarse Grains Revenue (USD Million) by Country (2021-2032)
8.6.1. Middle East Coarse Grains Regional Analysis and Outlook
8.6.2. Africa Coarse Grains Regional Analysis and Outlook
Chapter 9. North America Coarse Grains Analysis and Outlook
9.1. North America Coarse Grains Revenue (USD Million) by Segments (2021-2032)
9.1.1. North America Coarse Grains Revenue (USD Million) by Type (2021-2032)
9.1.2. North America Coarse Grains Revenue (USD Million) by Application (2021-2032)
9.1.3. North America Coarse Grains Revenue (USD Million) by Product (2021-2032)
By Type
Cereals
Mixed Beans
Tubers
By Application
Food
Cosmetic
Animal Food
Chemical
Others
Chapter 10. Europe Coarse Grains Analysis and Outlook
10.1. Europe Coarse Grains Revenue (USD Million), by Segments (USD Million) (2021-2032)
10.1.1. Europe Coarse Grains Revenue (USD Million) by Type (2021-2032)
10.1.2. Europe Coarse Grains Revenue (USD Million) by Application (2021-2032)
10.1.3. Europe Coarse Grains Revenue (USD Million) by Product (2021-2032)
By Type
Cereals
Mixed Beans
Tubers
By Application
Food
Cosmetic
Animal Food
Chemical
Others
Chapter 11. Asia Pacific Coarse Grains Analysis and Outlook
11.1. Asia Pacific Coarse Grains Revenue (USD Million), and Revenue (USD Million) by Segments (2021-2032)
11.1.1. Asia Pacific Coarse Grains Revenue (USD Million) by Type (2021-2032)
11.1.2. Asia Pacific Coarse Grains Revenue (USD Million) by Application (2021-2032)
11.1.3. Asia Pacific Coarse Grains Revenue (USD Million) by Product (2021-2032)
By Type
Cereals
Mixed Beans
Tubers
By Application
Food
Cosmetic
Animal Food
Chemical
Others
Chapter 12. South America Coarse Grains Analysis and Outlook
12.1. South America Coarse Grains Revenue (USD Million), by Segments (2021-2032)
12.1.1. South America Coarse Grains Revenue (USD Million) by Type (2021-2032)
12.1.2. South America Coarse Grains Revenue (USD Million) by Application (2021-2032)
12.1.3. South America Coarse Grains Revenue (USD Million) by Product (2021-2032)
By Type
Cereals
Mixed Beans
Tubers
By Application
Food
Cosmetic
Animal Food
Chemical
Others
Chapter 13. Middle East and Africa Coarse Grains Analysis and Outlook
13.1. Middle East and Africa Coarse Grains Revenue (USD Million), by Segments (2021-2032)
13.1.1. Middle East and Africa Coarse Grains Revenue (USD Million) by Type (2021-2032)
13.1.2. Middle East and Africa Coarse Grains Revenue (USD Million) by Application (2021-2032)
13.1.3. Middle East and Africa Coarse Grains Revenue (USD Million) by Product (2021-2032)
By Type
Cereals
Mixed Beans
Tubers
By Application
Food
Cosmetic
Animal Food
Chemical
Others
Chapter 14. Coarse Grains Company Profiles
14.1 Business Overview
14.2 Product Profiles
14.3 SWOT Profiles
14.5 Recent Developments
14.6 Financial Profile
List of Companies
Burton
COFCO
ConAgra
Fox's
Hain Celestial Group
Jiashill Group Ltd
King Milling Company
Nestlé S.A.
Premier Foods
SHARIFA AGROTECH & FOOD PROCESSING Pvt. Ltd
The Kraft Heinz Company
Tiandihui Foodstuffs
Unilever
15. Methodology and Data Sources
15.1 Customization Offerings
15.2 Subscription Services
15.3 Related Reports
15.4 Publisher Expertise
LIST OF TABLES
Table 1 Market Segmentation Analysis
Table 2 Global Coarse Grains Market Share of Leading Companies, 2023
Table 3 Product Offerings of Leading Companies
Table 4 Low Growth Scenario Forecasts
Table 5 Reference Case Growth Scenario
Table 6 High Growth Case Scenario
Table 7 Global Coarse Grains Revenue (USD Million) And CAGR (%) By Type (2021-2032)
Table 8 Global Coarse Grains Revenue (USD Million) And CAGR (%) By Application (2021-2032)
Table 9 Global Coarse Grains Revenue (USD Million) And CAGR (%) By Product (2021-2032)
Table 10 Global Coarse Grains Market Revenue (USD Million) By Regions (2021-2032)
Table 11 Global Coarse Grains Market Share (%) By Regions (2021-2032)
Table 12 North America Coarse Grains Revenue (USD Million) By Country (2021-2032)
Table 13 Europe Coarse Grains Revenue (USD Million) By Country (2021-2032)
Table 14 Asia Pacific Coarse Grains Revenue (USD Million) By Country (2021-2032)
Table 15 South America Coarse Grains Revenue (USD Million) By Country (2021-2032)
Table 16 Middle East and Africa Coarse Grains Revenue (USD Million) By Region (2021-2032)
Table 17 North America Coarse Grains Revenue (USD Million) By Type (2021-2032)
Table 18 North America Coarse Grains Revenue (USD Million) By Application (2021-2032)
Table 19 North America Coarse Grains Revenue (USD Million) By Product (2021-2032)
Table 20 Europe Coarse Grains Revenue (USD Million) By Type (2021-2032)
Table 21 Europe Coarse Grains Revenue (USD Million) By Application (2021-2032)
Table 22 Europe Coarse Grains Revenue (USD Million) By Product (2021-2032)
Table 23 Asia Pacific Coarse Grains Revenue (USD Million) By Type (2021-2032)
Table 24 Asia Pacific Coarse Grains Revenue (USD Million) By Application (2021-2032)
Table 25 Asia Pacific Coarse Grains Revenue (USD Million) By Product (2021-2032)
Table 26 South America Coarse Grains Revenue (USD Million) By Type (2021-2032)
Table 27 South America Coarse Grains Revenue (USD Million) By Application (2021-2032)
Table 28 South America Coarse Grains Revenue (USD Million) By Product (2021-2032)
Table 29 Middle East and Africa Coarse Grains Revenue (USD Million) By Type (2021-2032)
Table 30 Middle East and Africa Coarse Grains Revenue (USD Million) By Application (2021-2032)
Table 31 Middle East and Africa Coarse Grains Revenue (USD Million) By Product (2021-2032)
LIST OF FIGURES
Figure 1. Market Scope
Figure 2. Pricing Forecasts Per Unit, 2023- 2032
Figure 3. Porter’s Five Forces
Figure 4. Global Coarse Grains Market Revenue (USD Million) By Regions (2021-2032)
Figure 5. Global Coarse Grains Market Share (%) By Regions (2023)
Figure 6. North America Coarse Grains Revenue (USD Million) By Country (2021-2032)
Figure 7. United States Coarse Grains Revenue (USD Million) By Country (2021-2032)
Figure 8. Canada Coarse Grains Revenue (USD Million) By Country (2021-2032)
Figure 9. Mexico Coarse Grains Revenue (USD Million) By Country (2021-2032)
Figure 10. Europe Coarse Grains Revenue (USD Million) By Country (2021-2032)
Figure 11. Germany Coarse Grains Revenue (USD Million) By Country (2021-2032)
Figure 12. France Coarse Grains Revenue (USD Million) By Country (2021-2032)
Figure 13. United Kingdom Coarse Grains Revenue (USD Million) By Country (2021-2032)
Figure 14. Spain Coarse Grains Revenue (USD Million) By Country (2021-2032)
Figure 15. Italy Coarse Grains Revenue (USD Million) By Country (2021-2032)
Figure 16. Russia Coarse Grains Revenue (USD Million) By Country (2021-2032)
Figure 17. Rest of Europe Coarse Grains Revenue (USD Million) By Country (2021-2032)
Figure 11. Asia Pacific Coarse Grains Revenue (USD Million) By Country (2021-2032)
Figure 12. China Coarse Grains Revenue (USD Million) By Country (2021-2032)
Figure 13. Japan Coarse Grains Revenue (USD Million) By Country (2021-2032)
Figure 14. India Coarse Grains Revenue (USD Million) By Country (2021-2032)
Figure 15. South Korea Coarse Grains Revenue (USD Million) By Country (2021-2032)
Figure 16. Australia Coarse Grains Revenue (USD Million) By Country (2021-2032)
Figure 17. South East Asia Coarse Grains Revenue (USD Million) By Country (2021-2032)
Figure 18. South America Coarse Grains Revenue (USD Million) By Country (2021-2032)
Figure 19. Brazil Coarse Grains Revenue (USD Million) By Country (2021-2032)
Figure 20. Argentina Coarse Grains Revenue (USD Million) By Country (2021-2032)
Figure 21. Rest of Asia Pacific Coarse Grains Revenue (USD Million) By Country (2021-2032)
Figure 22. Middle East and Africa Coarse Grains Revenue (USD Million) By Region (2021-2032)
Figure 23. Saudi Arabia Coarse Grains Revenue (USD Million) By Region (2021-2032)
Figure 24. The UAE Coarse Grains Revenue (USD Million) By Region (2021-2032)
Figure 25. Rest of Middle East Coarse Grains Revenue (USD Million) By Region (2021-2032)
Figure 26. South Africa Coarse Grains Revenue (USD Million) By Region (2021-2032)
Figure 27. Africa Coarse Grains Revenue (USD Million) By Region (2021-2032)
Figure 28. North America Coarse Grains Revenue (USD Million) By Type (2021-2032)
Figure 29. North America Coarse Grains Revenue (USD Million) By Application (2021-2032)
Figure 30. North America Coarse Grains Revenue (USD Million) By Product (2021-2032)
Figure 31. Europe Coarse Grains Revenue (USD Million) By Type (2021-2032)
Figure 32. Europe Coarse Grains Revenue (USD Million) By Application (2021-2032)
Figure 33. Europe Coarse Grains Revenue (USD Million) By Product (2021-2032)
Figure 34. Asia Pacific Coarse Grains Revenue (USD Million) By Type (2021-2032)
Figure 35. Asia Pacific Coarse Grains Revenue (USD Million) By Application (2021-2032)
Figure 36. Asia Pacific Coarse Grains Revenue (USD Million) By Product (2021-2032)
Figure 37. South America Coarse Grains Revenue (USD Million) By Type (2021-2032)
Figure 38. South America Coarse Grains Revenue (USD Million) By Application (2021-2032)
Figure 39. South America Coarse Grains Revenue (USD Million) By Product (2021-2032)
Figure 40. Middle East and Africa Coarse Grains Revenue (USD Million) By Type (2021-2032)
Figure 41. Middle East and Africa Coarse Grains Revenue (USD Million) By Application (2021-2032)
Figure 42. Middle East and Africa Coarse Grains Revenue (USD Million) By Product (2021-2032)
By Type
Cereals
Mixed Beans
Tubers
By Application
Food
Cosmetic
Animal Food
Chemical
Others
Countries Analyzed
North America (US, Canada, Mexico)
Europe (Germany, UK, France, Spain, Italy, Russia, Rest of Europe)
Asia Pacific (China, India, Japan, South Korea, Australia, South East Asia, Rest of Asia)
South America (Brazil, Argentina, Rest of South America)
Middle East and Africa (Saudi Arabia, UAE, Rest of Middle East, South Africa, Egypt, Rest of Africa)
