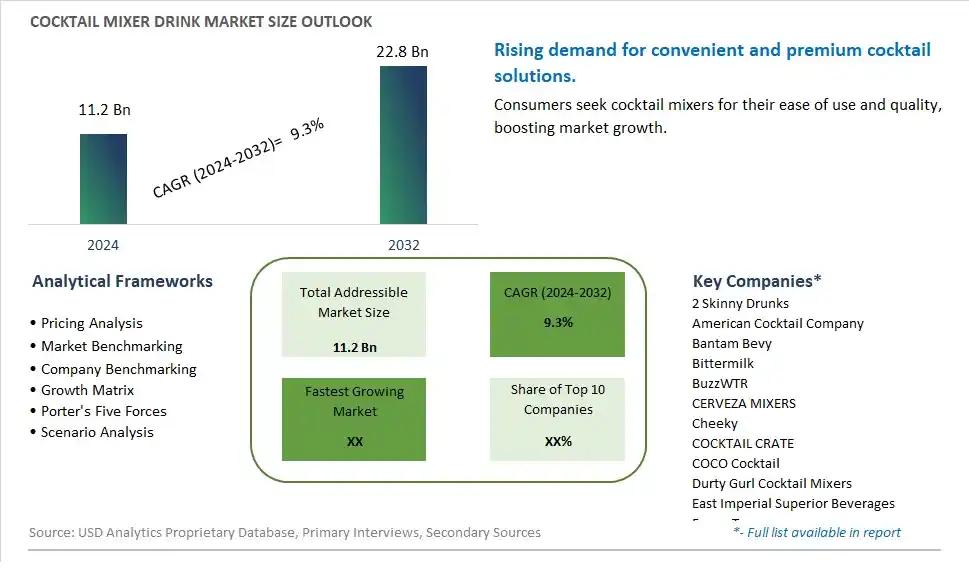
Global Cocktail Mixer Drink Market Size is valued at $11.2 Billion in 2024 and is forecast to register a growth rate (CAGR) of 9.3% to reach $22.8 Billion by 2032.
The global Cocktail Mixer Drink Market Comprehensive Study analyzes and forecasts the market size across 6 regions and 24 countries for diverse segments -By Type (Tonic Water, Club Soda, Ginger Beer, Others), By Application (Residential, Commercial)
An Introduction to Cocktail Mixer Drink Market
In 2024, the Cocktail Mixer Drink market is witnessing robust growth, driven by the increasing popularity of home entertaining and the demand for convenient, high-quality cocktail solutions. Cocktail mixers, which include pre-mixed syrups, juices, and flavorings, are valued for their ability to simplify the preparation of professional-quality cocktails at home. The market is supported by the growing trend towards premium and craft cocktails. Advances in flavor formulation and packaging technologies are enhancing the taste, consistency, and shelf life of cocktail mixers. The market is also benefiting from the trend towards clean-label and natural ingredients, appealing to consumers seeking high-quality and easy-to-use cocktail solutions.
Cocktail Mixer Drink Competitive Landscape
The market report analyses the leading companies in the industry including 2 Skinny Drunks, American Cocktail Company, Bantam Bevy, Bittermilk, BuzzWTR, CERVEZA MIXERS, Cheeky, COCKTAIL CRATE, COCO Cocktail, Durty Gurl Cocktail Mixers, East Imperial Superior Beverages, Fever-Tree, FICKS BEVERAGE, Four Blue Palms, FRESH VICTOR, KELVIN SLUSH, LAVA, OWL’S BREW, Utmost Brands, WithCo Cocktails, and Others.
Cocktail Mixer Drink Market Dynamics
Cocktail Mixer Drink Market Trend: Growth in Home Mixology and Craft Cocktails
A prominent market trend for cocktail mixer drinks is the growth in home mixology and craft cocktails. With the rise of social gatherings, home entertainment, and culinary creativity, there's a increasing interest among consumers in creating sophisticated and unique cocktails at home. Cocktail mixer drinks offer convenience and versatility, allowing individuals to experiment with different flavors, ingredients, and mixology techniques to craft personalized and artisanal cocktails, driving the popularity of cocktail mixer drinks in the market.
Cocktail Mixer Drink Market Driver: Demand for Premium and Artisanal Drinking Experiences
A key driver fueling the market for cocktail mixer drinks is the consumer demand for premium and artisanal drinking experiences. As consumers seek elevated taste experiences, quality ingredients, and creative presentations in their beverages, there's a demand for cocktail mixer drinks that offer high-quality flavors, natural ingredients, and innovative blends. The market responds to this driver by offering a wide range of cocktail mixer options such as fruit-infused syrups, botanical extracts, flavored mixes, and craft cocktail kits, catering to consumers' desires for elevated drinking experiences.
Cocktail Mixer Drink Market Opportunity: Expansion into Health-Conscious and Functional Mixers
An opportunity within the cocktail mixer drinks market lies in expansion into health-conscious and functional mixers. Manufacturers can develop cocktail mixer formulations using natural sweeteners, herbal extracts, superfood ingredients, and functional additives such as vitamins, antioxidants, or adaptogens to appeal to health-conscious consumers. Additionally, exploring collaborations with wellness brands or creating mixers with specific health benefits such as low sugar, immune support, or energy-enhancing properties can tap into the growing demand for functional and healthier beverage options. By leveraging the trend of home mixology, premium drinking experiences, and innovation in mixology techniques, companies can capitalize on the market opportunity presented by cocktail mixer drinks and cater to evolving consumer preferences in the beverage industry.
Cocktail Mixer Drink Market Share Analysis: Tonic Water segment generated the highest revenue share in the industry
The Tonic Water segment stands out as the largest segment in the Cocktail Mixer Drink Market. This segment's prominence is driven by several factors contributing to its substantial market share. Tonic water is a key ingredient in classic and contemporary cocktails, such as gin and tonic, vodka tonic, and various highball drinks. Its unique flavor profile, characterized by a bitter and slightly citrusy taste, adds depth and complexity to cocktails, making it a preferred choice among bartenders and mixologists. Additionally, the growing trend of mixology and craft cocktails has boosted the demand for premium tonic water variants with botanical infusions and natural flavors. Further, the versatility of tonic water extends beyond cocktails, as it can also be enjoyed as a refreshing non-alcoholic beverage on its own or mixed with fruit juices. With its widespread usage in both alcoholic and non-alcoholic drinks and continuous innovation in flavor varieties, the Tonic Water segment continues to lead the Cocktail Mixer Drink Market and is expected to maintain its dominance in the coming years.
Cocktail Mixer Drink Market Share Analysis: Commercial is the fastest growing segment over the forecast period to 2032
The Commercial segment is anticipated to be the fastest-growing segment in the Cocktail Mixer Drink Market by 2032. This rapid growth can be attributed to several key factors driving the demand for cocktail mixer drinks in commercial applications. Firstly, the increasing popularity of cocktail bars, lounges, and restaurants has led to a higher demand for premium and innovative cocktail mixer drinks. Commercial establishments are constantly seeking unique and high-quality mixer options to cater to the evolving preferences of consumers and enhance the overall drinking experience. Additionally, the growing trend of mixology and craft cocktails in the hospitality industry has contributed to the increased usage of cocktail mixer drinks in commercial settings. Bartenders and beverage professionals are incorporating a wide range of mixer flavors, including tonic water, club soda, and ginger beer, to create signature cocktails and attract customers. Further, the rise in social gatherings, events, and celebrations in commercial venues further drives the consumption of cocktail mixer drinks. With continuous innovation in product formulations, packaging, and marketing strategies tailored for the commercial sector, the Commercial segment of the Cocktail Mixer Drink Market is poised for significant growth and market expansion in the coming years.
Cocktail Mixer Drink Market Segmentation
By Type
Tonic Water
Club Soda
Ginger Beer
Others
By Application
Residential
Commercial
Countries Analyzed
North America (US, Canada, Mexico)
Europe (Germany, UK, France, Spain, Italy, Russia, Rest of Europe)
Asia Pacific (China, India, Japan, South Korea, Australia, South East Asia, Rest of Asia)
South America (Brazil, Argentina, Rest of South America)
Middle East and Africa (Saudi Arabia, UAE, Rest of Middle East, South Africa, Egypt, Rest of Africa)
Cocktail Mixer Drink Companies Profiled in the Study
2 Skinny Drunks
American Cocktail Company
Bantam Bevy
Bittermilk
BuzzWTR
CERVEZA MIXERS
Cheeky
COCKTAIL CRATE
COCO Cocktail
Durty Gurl Cocktail Mixers
East Imperial Superior Beverages
Fever-Tree
FICKS BEVERAGE
Four Blue Palms
FRESH VICTOR
KELVIN SLUSH
LAVA
OWL’S BREW
Utmost Brands
WithCo Cocktails
*- List Not Exhaustive
Chapter 1. TABLE OF CONTENTS
Chapter 2. Introduction to Cocktail Mixer Drink Market
2.1. Market Overview
2.2. Key Statistics and Report Highlights
2.3. Scope of the Comprehensive Study
2.3.1. Market Definition
2.3.2 Countries and Regions Covered
2.3.3 Research Objective
2.3.4 Units, Currency, and Conversions
2.3.5 Industry Value Chain
2.4. Key Market Segments
2.5. Key Companies
2.6. Study Period
Chapter 3. Strategic Analysis Review
3.1. Cocktail Mixer Drink Pricing Analysis and Forecast
3.2. Porter’s Five Forces
3.3. Market Ecosystem
3.4. SWOT Analysis
3.5. Regulatory Scenario
3.3. Effects of Inflation, Russia-Ukraine War, moderating economic growth, and other macroeconomic factors
Chapter 4. Competitive Landscape
4.1. Market Share Analysis
4.1.1. Global Cocktail Mixer Drink Market Share by Company, 2023
4.1.2. Product Offerings of Leading Cocktail Mixer Drink Companies
4.2. Market Entropy
4.2.1. New Product Launches in the Industry
4.2.2. Mergers, Acquisitions, Joint ventures, and Partnerships
4.3. Key Strategies and Best Practices
Chapter 5. Global Market Projections: Best, Reference, and Low Case Scenarios
5.1. Growth Analysis- Case Scenario Definitions
5.2. Low Growth Case Scenario Forecasts
5.3. Reference Growth Case Scenario Forecasts
5.4. High Growth Case Scenario Forecasts
Chapter 6. Market Dynamics
6.1. Cocktail Mixer Drink Market Drivers
6.2. Cocktail Mixer Drink Market Challenges
6.6. Cocktail Mixer Drink Market Opportunities
6.4. Cocktail Mixer Drink Market Trends
Chapter 7. Global Cocktail Mixer Drink Market Outlook Trends
7.1. Global Cocktail Mixer Drink Revenue (USD Million) and CAGR (%) by Type (2021-2032)
7.2. Global Cocktail Mixer Drink Revenue (USD Million) and CAGR (%) by Application (2021-2032)
7.3. Global Cocktail Mixer Drink Revenue (USD Million) and CAGR (%) by Product (2021-2032)
By Type
Tonic Water
Club Soda
Ginger Beer
Others
By Application
Residential
Commercial
Chapter 8. Global Cocktail Mixer Drink Regional Analysis and Outlook
8.1. Global Cocktail Mixer Drink Revenue (USD Million) By Regions (2021- 2032)
8.2. North America Cocktail Mixer Drink Revenue (USD Million) by Country (2021-2032)
8.2.1. United States Cocktail Mixer Drink Regional Analysis and Outlook
8.2.2. Canada Cocktail Mixer Drink Regional Analysis and Outlook
8.2.3. Mexico Cocktail Mixer Drink Regional Analysis and Outlook
8.3. Europe Cocktail Mixer Drink Revenue (USD Million), by Country (2021-2032)
8.3.1. Germany Cocktail Mixer Drink Regional Analysis and Outlook
8.3.2. France Cocktail Mixer Drink Regional Analysis and Outlook
8.3.3. United Kingdom Cocktail Mixer Drink Regional Analysis and Outlook
8.3.4. Spain Cocktail Mixer Drink Regional Analysis and Outlook
8.3.5. Italy Cocktail Mixer Drink Regional Analysis and Outlook
8.3.6. Russia Cocktail Mixer Drink Regional Analysis and Outlook
8.3.7. Rest of Europe Cocktail Mixer Drink Regional Analysis and Outlook
8.4. Asia Pacific Cocktail Mixer Drink Revenue (USD Million) by Country (2021-2032)
8.4.1. China Cocktail Mixer Drink Regional Analysis and Outlook
8.4.2. Japan Cocktail Mixer Drink Regional Analysis and Outlook
8.4.3. India Cocktail Mixer Drink Regional Analysis and Outlook
8.4.4. South Korea Cocktail Mixer Drink Regional Analysis and Outlook
8.4.5. Australia Cocktail Mixer Drink Regional Analysis and Outlook
8.4.6. South East Asia Cocktail Mixer Drink Regional Analysis and Outlook
8.4.7. Rest of Asia Pacific Cocktail Mixer Drink Regional Analysis and Outlook
8.5. South America Cocktail Mixer Drink Revenue (USD Million), by Country (2021-2032)
8.5.1. Brazil Cocktail Mixer Drink Regional Analysis and Outlook
8.5.2. Argentina Cocktail Mixer Drink Regional Analysis and Outlook
8.5.3. Rest of South America Cocktail Mixer Drink Regional Analysis and Outlook
8.6. Middle East and Africa Cocktail Mixer Drink Revenue (USD Million) by Country (2021-2032)
8.6.1. Middle East Cocktail Mixer Drink Regional Analysis and Outlook
8.6.2. Africa Cocktail Mixer Drink Regional Analysis and Outlook
Chapter 9. North America Cocktail Mixer Drink Analysis and Outlook
9.1. North America Cocktail Mixer Drink Revenue (USD Million) by Segments (2021-2032)
9.1.1. North America Cocktail Mixer Drink Revenue (USD Million) by Type (2021-2032)
9.1.2. North America Cocktail Mixer Drink Revenue (USD Million) by Application (2021-2032)
9.1.3. North America Cocktail Mixer Drink Revenue (USD Million) by Product (2021-2032)
By Type
Tonic Water
Club Soda
Ginger Beer
Others
By Application
Residential
Commercial
Chapter 10. Europe Cocktail Mixer Drink Analysis and Outlook
10.1. Europe Cocktail Mixer Drink Revenue (USD Million), by Segments (USD Million) (2021-2032)
10.1.1. Europe Cocktail Mixer Drink Revenue (USD Million) by Type (2021-2032)
10.1.2. Europe Cocktail Mixer Drink Revenue (USD Million) by Application (2021-2032)
10.1.3. Europe Cocktail Mixer Drink Revenue (USD Million) by Product (2021-2032)
By Type
Tonic Water
Club Soda
Ginger Beer
Others
By Application
Residential
Commercial
Chapter 11. Asia Pacific Cocktail Mixer Drink Analysis and Outlook
11.1. Asia Pacific Cocktail Mixer Drink Revenue (USD Million), and Revenue (USD Million) by Segments (2021-2032)
11.1.1. Asia Pacific Cocktail Mixer Drink Revenue (USD Million) by Type (2021-2032)
11.1.2. Asia Pacific Cocktail Mixer Drink Revenue (USD Million) by Application (2021-2032)
11.1.3. Asia Pacific Cocktail Mixer Drink Revenue (USD Million) by Product (2021-2032)
By Type
Tonic Water
Club Soda
Ginger Beer
Others
By Application
Residential
Commercial
Chapter 12. South America Cocktail Mixer Drink Analysis and Outlook
12.1. South America Cocktail Mixer Drink Revenue (USD Million), by Segments (2021-2032)
12.1.1. South America Cocktail Mixer Drink Revenue (USD Million) by Type (2021-2032)
12.1.2. South America Cocktail Mixer Drink Revenue (USD Million) by Application (2021-2032)
12.1.3. South America Cocktail Mixer Drink Revenue (USD Million) by Product (2021-2032)
By Type
Tonic Water
Club Soda
Ginger Beer
Others
By Application
Residential
Commercial
Chapter 13. Middle East and Africa Cocktail Mixer Drink Analysis and Outlook
13.1. Middle East and Africa Cocktail Mixer Drink Revenue (USD Million), by Segments (2021-2032)
13.1.1. Middle East and Africa Cocktail Mixer Drink Revenue (USD Million) by Type (2021-2032)
13.1.2. Middle East and Africa Cocktail Mixer Drink Revenue (USD Million) by Application (2021-2032)
13.1.3. Middle East and Africa Cocktail Mixer Drink Revenue (USD Million) by Product (2021-2032)
By Type
Tonic Water
Club Soda
Ginger Beer
Others
By Application
Residential
Commercial
Chapter 14. Cocktail Mixer Drink Company Profiles
14.1 Business Overview
14.2 Product Profiles
14.3 SWOT Profiles
14.5 Recent Developments
14.6 Financial Profile
List of Companies
2 Skinny Drunks
American Cocktail Company
Bantam Bevy
Bittermilk
BuzzWTR
CERVEZA MIXERS
Cheeky
COCKTAIL CRATE
COCO Cocktail
Durty Gurl Cocktail Mixers
East Imperial Superior Beverages
Fever-Tree
FICKS BEVERAGE
Four Blue Palms
FRESH VICTOR
KELVIN SLUSH
LAVA
OWL’S BREW
Utmost Brands
WithCo Cocktails
15. Methodology and Data Sources
15.1 Customization Offerings
15.2 Subscription Services
15.3 Related Reports
15.4 Publisher Expertise
LIST OF TABLES
Table 1 Market Segmentation Analysis
Table 2 Global Cocktail Mixer Drink Market Share of Leading Companies, 2023
Table 3 Product Offerings of Leading Companies
Table 4 Low Growth Scenario Forecasts
Table 5 Reference Case Growth Scenario
Table 6 High Growth Case Scenario
Table 7 Global Cocktail Mixer Drink Revenue (USD Million) And CAGR (%) By Type (2021-2032)
Table 8 Global Cocktail Mixer Drink Revenue (USD Million) And CAGR (%) By Application (2021-2032)
Table 9 Global Cocktail Mixer Drink Revenue (USD Million) And CAGR (%) By Product (2021-2032)
Table 10 Global Cocktail Mixer Drink Market Revenue (USD Million) By Regions (2021-2032)
Table 11 Global Cocktail Mixer Drink Market Share (%) By Regions (2021-2032)
Table 12 North America Cocktail Mixer Drink Revenue (USD Million) By Country (2021-2032)
Table 13 Europe Cocktail Mixer Drink Revenue (USD Million) By Country (2021-2032)
Table 14 Asia Pacific Cocktail Mixer Drink Revenue (USD Million) By Country (2021-2032)
Table 15 South America Cocktail Mixer Drink Revenue (USD Million) By Country (2021-2032)
Table 16 Middle East and Africa Cocktail Mixer Drink Revenue (USD Million) By Region (2021-2032)
Table 17 North America Cocktail Mixer Drink Revenue (USD Million) By Type (2021-2032)
Table 18 North America Cocktail Mixer Drink Revenue (USD Million) By Application (2021-2032)
Table 19 North America Cocktail Mixer Drink Revenue (USD Million) By Product (2021-2032)
Table 20 Europe Cocktail Mixer Drink Revenue (USD Million) By Type (2021-2032)
Table 21 Europe Cocktail Mixer Drink Revenue (USD Million) By Application (2021-2032)
Table 22 Europe Cocktail Mixer Drink Revenue (USD Million) By Product (2021-2032)
Table 23 Asia Pacific Cocktail Mixer Drink Revenue (USD Million) By Type (2021-2032)
Table 24 Asia Pacific Cocktail Mixer Drink Revenue (USD Million) By Application (2021-2032)
Table 25 Asia Pacific Cocktail Mixer Drink Revenue (USD Million) By Product (2021-2032)
Table 26 South America Cocktail Mixer Drink Revenue (USD Million) By Type (2021-2032)
Table 27 South America Cocktail Mixer Drink Revenue (USD Million) By Application (2021-2032)
Table 28 South America Cocktail Mixer Drink Revenue (USD Million) By Product (2021-2032)
Table 29 Middle East and Africa Cocktail Mixer Drink Revenue (USD Million) By Type (2021-2032)
Table 30 Middle East and Africa Cocktail Mixer Drink Revenue (USD Million) By Application (2021-2032)
Table 31 Middle East and Africa Cocktail Mixer Drink Revenue (USD Million) By Product (2021-2032)
LIST OF FIGURES
Figure 1. Market Scope
Figure 2. Pricing Forecasts Per Unit, 2023- 2032
Figure 3. Porter’s Five Forces
Figure 4. Global Cocktail Mixer Drink Market Revenue (USD Million) By Regions (2021-2032)
Figure 5. Global Cocktail Mixer Drink Market Share (%) By Regions (2023)
Figure 6. North America Cocktail Mixer Drink Revenue (USD Million) By Country (2021-2032)
Figure 7. United States Cocktail Mixer Drink Revenue (USD Million) By Country (2021-2032)
Figure 8. Canada Cocktail Mixer Drink Revenue (USD Million) By Country (2021-2032)
Figure 9. Mexico Cocktail Mixer Drink Revenue (USD Million) By Country (2021-2032)
Figure 10. Europe Cocktail Mixer Drink Revenue (USD Million) By Country (2021-2032)
Figure 11. Germany Cocktail Mixer Drink Revenue (USD Million) By Country (2021-2032)
Figure 12. France Cocktail Mixer Drink Revenue (USD Million) By Country (2021-2032)
Figure 13. United Kingdom Cocktail Mixer Drink Revenue (USD Million) By Country (2021-2032)
Figure 14. Spain Cocktail Mixer Drink Revenue (USD Million) By Country (2021-2032)
Figure 15. Italy Cocktail Mixer Drink Revenue (USD Million) By Country (2021-2032)
Figure 16. Russia Cocktail Mixer Drink Revenue (USD Million) By Country (2021-2032)
Figure 17. Rest of Europe Cocktail Mixer Drink Revenue (USD Million) By Country (2021-2032)
Figure 11. Asia Pacific Cocktail Mixer Drink Revenue (USD Million) By Country (2021-2032)
Figure 12. China Cocktail Mixer Drink Revenue (USD Million) By Country (2021-2032)
Figure 13. Japan Cocktail Mixer Drink Revenue (USD Million) By Country (2021-2032)
Figure 14. India Cocktail Mixer Drink Revenue (USD Million) By Country (2021-2032)
Figure 15. South Korea Cocktail Mixer Drink Revenue (USD Million) By Country (2021-2032)
Figure 16. Australia Cocktail Mixer Drink Revenue (USD Million) By Country (2021-2032)
Figure 17. South East Asia Cocktail Mixer Drink Revenue (USD Million) By Country (2021-2032)
Figure 18. South America Cocktail Mixer Drink Revenue (USD Million) By Country (2021-2032)
Figure 19. Brazil Cocktail Mixer Drink Revenue (USD Million) By Country (2021-2032)
Figure 20. Argentina Cocktail Mixer Drink Revenue (USD Million) By Country (2021-2032)
Figure 21. Rest of Asia Pacific Cocktail Mixer Drink Revenue (USD Million) By Country (2021-2032)
Figure 22. Middle East and Africa Cocktail Mixer Drink Revenue (USD Million) By Region (2021-2032)
Figure 23. Saudi Arabia Cocktail Mixer Drink Revenue (USD Million) By Region (2021-2032)
Figure 24. The UAE Cocktail Mixer Drink Revenue (USD Million) By Region (2021-2032)
Figure 25. Rest of Middle East Cocktail Mixer Drink Revenue (USD Million) By Region (2021-2032)
Figure 26. South Africa Cocktail Mixer Drink Revenue (USD Million) By Region (2021-2032)
Figure 27. Africa Cocktail Mixer Drink Revenue (USD Million) By Region (2021-2032)
Figure 28. North America Cocktail Mixer Drink Revenue (USD Million) By Type (2021-2032)
Figure 29. North America Cocktail Mixer Drink Revenue (USD Million) By Application (2021-2032)
Figure 30. North America Cocktail Mixer Drink Revenue (USD Million) By Product (2021-2032)
Figure 31. Europe Cocktail Mixer Drink Revenue (USD Million) By Type (2021-2032)
Figure 32. Europe Cocktail Mixer Drink Revenue (USD Million) By Application (2021-2032)
Figure 33. Europe Cocktail Mixer Drink Revenue (USD Million) By Product (2021-2032)
Figure 34. Asia Pacific Cocktail Mixer Drink Revenue (USD Million) By Type (2021-2032)
Figure 35. Asia Pacific Cocktail Mixer Drink Revenue (USD Million) By Application (2021-2032)
Figure 36. Asia Pacific Cocktail Mixer Drink Revenue (USD Million) By Product (2021-2032)
Figure 37. South America Cocktail Mixer Drink Revenue (USD Million) By Type (2021-2032)
Figure 38. South America Cocktail Mixer Drink Revenue (USD Million) By Application (2021-2032)
Figure 39. South America Cocktail Mixer Drink Revenue (USD Million) By Product (2021-2032)
Figure 40. Middle East and Africa Cocktail Mixer Drink Revenue (USD Million) By Type (2021-2032)
Figure 41. Middle East and Africa Cocktail Mixer Drink Revenue (USD Million) By Application (2021-2032)
Figure 42. Middle East and Africa Cocktail Mixer Drink Revenue (USD Million) By Product (2021-2032)
By Type
Tonic Water
Club Soda
Ginger Beer
Others
By Application
Residential
Commercial
Countries Analyzed
North America (US, Canada, Mexico)
Europe (Germany, UK, France, Spain, Italy, Russia, Rest of Europe)
Asia Pacific (China, India, Japan, South Korea, Australia, South East Asia, Rest of Asia)
South America (Brazil, Argentina, Rest of South America)
Middle East and Africa (Saudi Arabia, UAE, Rest of Middle East, South Africa, Egypt, Rest of Africa)
