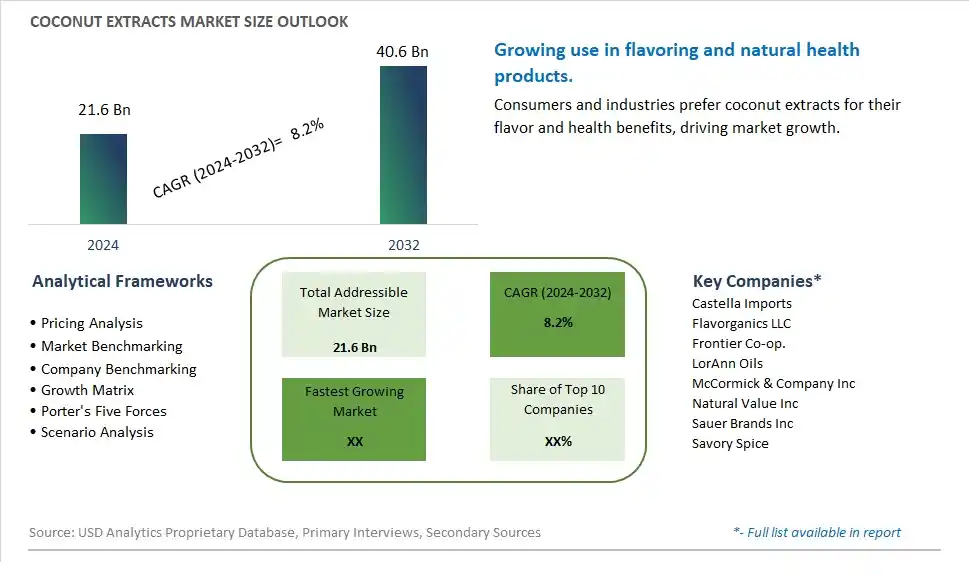
Global Coconut Extracts Market Size is valued at $21.6 Billion in 2024 and is forecast to register a growth rate (CAGR) of 8.2% to reach $40.6 Billion by 2032.
The global Coconut Extracts Market Comprehensive Study analyzes and forecasts the market size across 6 regions and 24 countries for diverse segments -By Form (Liquid, Powder), By Application (Fortified Beverages, Dairy, Bakery, Confectionery, Cosmetics & Personal Care, Others)
An Introduction to Coconut Extracts Market
In 2024, the Coconut Extracts market is witnessing significant growth, driven by the increasing demand for natural and flavorful coconut ingredients in the food, beverage, and cosmetic industries. Coconut extracts, derived from the meat, water, and oil of coconuts, are used to impart rich coconut flavor and nutritional benefits to various products. The market is supported by the growing trend towards clean-label and natural ingredients. Advances in extraction and formulation technologies are enhancing the quality, potency, and application versatility of coconut extracts. The market is also benefiting from the trend towards sustainable and ethically sourced ingredients, appealing to manufacturers and consumers seeking high-quality and responsible coconut products.
Coconut Extracts Competitive Landscape
The market report analyses the leading companies in the industry including Castella Imports, Flavorganics LLC, Frontier Co-op., LorAnn Oils, McCormick & Company Inc, Natural Value Inc, Sauer Brands Inc, Savory Spice, and Others.
Coconut Extracts Market Dynamics
Coconut Extracts Market Trend: Demand for Natural Flavor Enhancers
A prominent market trend for coconut extracts is the increasing demand for natural flavor enhancers in the food and beverage industry. With consumers seeking authentic and exotic flavors, there's a rising interest in coconut extracts for their aromatic and tropical notes. Manufacturers are incorporating coconut extracts into a wide range of products such as beverages, desserts, baked goods, sauces, and confections to meet the growing consumer preference for natural and flavorful ingredients.
Coconut Extracts Market Driver: Growth of Ethnic and International Cuisine
A key driver fueling the market for coconut extracts is the growth of ethnic and international cuisine in global food markets. As consumers explore diverse culinary experiences and flavors from around the world, there's a demand for ingredients like coconut extracts that are essential in Southeast Asian, Caribbean, and tropical cuisines. The market responds to this driver by providing high-quality coconut extracts that capture the authentic taste and aroma of coconut, enabling chefs, food manufacturers, and home cooks to create authentic and flavorful dishes.
Coconut Extracts Market Opportunity: Innovation in Coconut-Based Products and Functional Applications
An opportunity within the coconut extracts market lies in innovation in coconut-based products and functional applications. Manufacturers can develop innovative coconut extracts with different flavor profiles (e.g., roasted coconut, coconut cream, coconut water essence) to cater to diverse culinary needs and consumer preferences. Additionally, exploring functional applications of coconut extracts such as natural sweeteners, flavor modifiers, and health-promoting additives in beverages, snacks, dairy alternatives, and wellness products can expand market reach and appeal to health-conscious consumers. By focusing on product innovation, quality assurance, and functional versatility, companies can capitalize on the market opportunity presented by coconut extracts and drive market growth in the food and beverage industry.
Coconut Extracts Market Share Analysis: Liquid Coconut Extracts segment generated the highest revenue share in the industry
The Liquid Coconut Extracts segment stands out as the largest segment in the Coconut Extracts Market. This segment's prominence is driven by several factors contributing to its substantial market share. Liquid coconut extracts are widely used in various industries, including food and beverage, cosmetics, pharmaceuticals, and personal care products. The liquid form offers versatility in applications, allowing for easy incorporation into recipes, formulations, and manufacturing processes. Liquid coconut extracts are valued for their natural flavor, aroma, and functional properties, such as moisturizing, conditioning, and flavor enhancement. In the food and beverage industry, liquid coconut extracts are utilized in cooking, baking, beverage production, and flavoring applications. In the cosmetics and personal care sector, they are used in skincare products, hair care products, soaps, and lotions for their nourishing and hydrating effects. Further, the rising demand for natural and plant-based ingredients in consumer products has further boosted the consumption of liquid coconut extracts. With continuous product innovation, formulation advancements, and expanding applications across diverse industries, the Liquid Coconut Extracts segment is expected to maintain its leadership position and witness steady growth in the Coconut Extracts Market.
Coconut Extracts Market Share Analysis: Cosmetics & Personal Care is the fastest growing segment over the forecast period to 2032
The Cosmetics & Personal Care segment is anticipated to be the fastest-growing segment in the Coconut Extracts Market by 2032. This rapid growth can be attributed to several key factors driving the demand for coconut extracts in cosmetics and personal care applications. Coconut extracts are rich in natural compounds like fatty acids, vitamins, and antioxidants, making them beneficial for skin and hair health. In the cosmetics industry, coconut extracts are used in skincare products such as moisturizers, creams, serums, and cleansers due to their hydrating, nourishing, and anti-aging properties. They are also incorporated into hair care products like shampoos, conditioners, and hair masks for their moisturizing and strengthening effects on hair strands. The increasing consumer preference for natural and organic ingredients in beauty and personal care products has fueled the demand for coconut extracts as they are perceived as safe, gentle, and effective alternatives to synthetic chemicals. Further, the trend towards clean beauty, sustainable sourcing, and cruelty-free formulations has further propelled the adoption of coconut extracts in cosmetics and personal care formulations. With continuous research and development efforts focusing on enhancing the functionality and versatility of coconut extracts in beauty products, the Cosmetics & Personal Care segment is poised for significant growth and market expansion in the coming years.
Coconut Extracts Market Segmentation
By Form
Liquid
Powder
By Application
Fortified Beverages
Dairy
Bakery
Confectionery
Cosmetics & Personal Care
Others
Countries Analyzed
North America (US, Canada, Mexico)
Europe (Germany, UK, France, Spain, Italy, Russia, Rest of Europe)
Asia Pacific (China, India, Japan, South Korea, Australia, South East Asia, Rest of Asia)
South America (Brazil, Argentina, Rest of South America)
Middle East and Africa (Saudi Arabia, UAE, Rest of Middle East, South Africa, Egypt, Rest of Africa)
Coconut Extracts Companies Profiled in the Study
Castella Imports
Flavorganics LLC
Frontier Co-op.
LorAnn Oils
McCormick & Company Inc
Natural Value Inc
Sauer Brands Inc
Savory Spice
*- List Not Exhaustive
Chapter 1. TABLE OF CONTENTS
Chapter 2. Introduction to Coconut Extracts Market
2.1. Market Overview
2.2. Key Statistics and Report Highlights
2.3. Scope of the Comprehensive Study
2.3.1. Market Definition
2.3.2 Countries and Regions Covered
2.3.3 Research Objective
2.3.4 Units, Currency, and Conversions
2.3.5 Industry Value Chain
2.4. Key Market Segments
2.5. Key Companies
2.6. Study Period
Chapter 3. Strategic Analysis Review
3.1. Coconut Extracts Pricing Analysis and Forecast
3.2. Porter’s Five Forces
3.3. Market Ecosystem
3.4. SWOT Analysis
3.5. Regulatory Scenario
3.3. Effects of Inflation, Russia-Ukraine War, moderating economic growth, and other macroeconomic factors
Chapter 4. Competitive Landscape
4.1. Market Share Analysis
4.1.1. Global Coconut Extracts Market Share by Company, 2023
4.1.2. Product Offerings of Leading Coconut Extracts Companies
4.2. Market Entropy
4.2.1. New Product Launches in the Industry
4.2.2. Mergers, Acquisitions, Joint ventures, and Partnerships
4.3. Key Strategies and Best Practices
Chapter 5. Global Market Projections: Best, Reference, and Low Case Scenarios
5.1. Growth Analysis- Case Scenario Definitions
5.2. Low Growth Case Scenario Forecasts
5.3. Reference Growth Case Scenario Forecasts
5.4. High Growth Case Scenario Forecasts
Chapter 6. Market Dynamics
6.1. Coconut Extracts Market Drivers
6.2. Coconut Extracts Market Challenges
6.6. Coconut Extracts Market Opportunities
6.4. Coconut Extracts Market Trends
Chapter 7. Global Coconut Extracts Market Outlook Trends
7.1. Global Coconut Extracts Revenue (USD Million) and CAGR (%) by Type (2021-2032)
7.2. Global Coconut Extracts Revenue (USD Million) and CAGR (%) by Application (2021-2032)
7.3. Global Coconut Extracts Revenue (USD Million) and CAGR (%) by Product (2021-2032)
By Form
Liquid
Powder
By Application
Fortified Beverages
Dairy
Bakery
Confectionery
Cosmetics & Personal Care
Others
Chapter 8. Global Coconut Extracts Regional Analysis and Outlook
8.1. Global Coconut Extracts Revenue (USD Million) By Regions (2021- 2032)
8.2. North America Coconut Extracts Revenue (USD Million) by Country (2021-2032)
8.2.1. United States Coconut Extracts Regional Analysis and Outlook
8.2.2. Canada Coconut Extracts Regional Analysis and Outlook
8.2.3. Mexico Coconut Extracts Regional Analysis and Outlook
8.3. Europe Coconut Extracts Revenue (USD Million), by Country (2021-2032)
8.3.1. Germany Coconut Extracts Regional Analysis and Outlook
8.3.2. France Coconut Extracts Regional Analysis and Outlook
8.3.3. United Kingdom Coconut Extracts Regional Analysis and Outlook
8.3.4. Spain Coconut Extracts Regional Analysis and Outlook
8.3.5. Italy Coconut Extracts Regional Analysis and Outlook
8.3.6. Russia Coconut Extracts Regional Analysis and Outlook
8.3.7. Rest of Europe Coconut Extracts Regional Analysis and Outlook
8.4. Asia Pacific Coconut Extracts Revenue (USD Million) by Country (2021-2032)
8.4.1. China Coconut Extracts Regional Analysis and Outlook
8.4.2. Japan Coconut Extracts Regional Analysis and Outlook
8.4.3. India Coconut Extracts Regional Analysis and Outlook
8.4.4. South Korea Coconut Extracts Regional Analysis and Outlook
8.4.5. Australia Coconut Extracts Regional Analysis and Outlook
8.4.6. South East Asia Coconut Extracts Regional Analysis and Outlook
8.4.7. Rest of Asia Pacific Coconut Extracts Regional Analysis and Outlook
8.5. South America Coconut Extracts Revenue (USD Million), by Country (2021-2032)
8.5.1. Brazil Coconut Extracts Regional Analysis and Outlook
8.5.2. Argentina Coconut Extracts Regional Analysis and Outlook
8.5.3. Rest of South America Coconut Extracts Regional Analysis and Outlook
8.6. Middle East and Africa Coconut Extracts Revenue (USD Million) by Country (2021-2032)
8.6.1. Middle East Coconut Extracts Regional Analysis and Outlook
8.6.2. Africa Coconut Extracts Regional Analysis and Outlook
Chapter 9. North America Coconut Extracts Analysis and Outlook
9.1. North America Coconut Extracts Revenue (USD Million) by Segments (2021-2032)
9.1.1. North America Coconut Extracts Revenue (USD Million) by Type (2021-2032)
9.1.2. North America Coconut Extracts Revenue (USD Million) by Application (2021-2032)
9.1.3. North America Coconut Extracts Revenue (USD Million) by Product (2021-2032)
By Form
Liquid
Powder
By Application
Fortified Beverages
Dairy
Bakery
Confectionery
Cosmetics & Personal Care
Others
Chapter 10. Europe Coconut Extracts Analysis and Outlook
10.1. Europe Coconut Extracts Revenue (USD Million), by Segments (USD Million) (2021-2032)
10.1.1. Europe Coconut Extracts Revenue (USD Million) by Type (2021-2032)
10.1.2. Europe Coconut Extracts Revenue (USD Million) by Application (2021-2032)
10.1.3. Europe Coconut Extracts Revenue (USD Million) by Product (2021-2032)
By Form
Liquid
Powder
By Application
Fortified Beverages
Dairy
Bakery
Confectionery
Cosmetics & Personal Care
Others
Chapter 11. Asia Pacific Coconut Extracts Analysis and Outlook
11.1. Asia Pacific Coconut Extracts Revenue (USD Million), and Revenue (USD Million) by Segments (2021-2032)
11.1.1. Asia Pacific Coconut Extracts Revenue (USD Million) by Type (2021-2032)
11.1.2. Asia Pacific Coconut Extracts Revenue (USD Million) by Application (2021-2032)
11.1.3. Asia Pacific Coconut Extracts Revenue (USD Million) by Product (2021-2032)
By Form
Liquid
Powder
By Application
Fortified Beverages
Dairy
Bakery
Confectionery
Cosmetics & Personal Care
Others
Chapter 12. South America Coconut Extracts Analysis and Outlook
12.1. South America Coconut Extracts Revenue (USD Million), by Segments (2021-2032)
12.1.1. South America Coconut Extracts Revenue (USD Million) by Type (2021-2032)
12.1.2. South America Coconut Extracts Revenue (USD Million) by Application (2021-2032)
12.1.3. South America Coconut Extracts Revenue (USD Million) by Product (2021-2032)
By Form
Liquid
Powder
By Application
Fortified Beverages
Dairy
Bakery
Confectionery
Cosmetics & Personal Care
Others
Chapter 13. Middle East and Africa Coconut Extracts Analysis and Outlook
13.1. Middle East and Africa Coconut Extracts Revenue (USD Million), by Segments (2021-2032)
13.1.1. Middle East and Africa Coconut Extracts Revenue (USD Million) by Type (2021-2032)
13.1.2. Middle East and Africa Coconut Extracts Revenue (USD Million) by Application (2021-2032)
13.1.3. Middle East and Africa Coconut Extracts Revenue (USD Million) by Product (2021-2032)
By Form
Liquid
Powder
By Application
Fortified Beverages
Dairy
Bakery
Confectionery
Cosmetics & Personal Care
Others
Chapter 14. Coconut Extracts Company Profiles
14.1 Business Overview
14.2 Product Profiles
14.3 SWOT Profiles
14.5 Recent Developments
14.6 Financial Profile
List of Companies
Castella Imports
Flavorganics LLC
Frontier Co-op.
LorAnn Oils
McCormick & Company Inc
Natural Value Inc
Sauer Brands Inc
Savory Spice
15. Methodology and Data Sources
15.1 Customization Offerings
15.2 Subscription Services
15.3 Related Reports
15.4 Publisher Expertise
LIST OF TABLES
Table 1 Market Segmentation Analysis
Table 2 Global Coconut Extracts Market Share of Leading Companies, 2023
Table 3 Product Offerings of Leading Companies
Table 4 Low Growth Scenario Forecasts
Table 5 Reference Case Growth Scenario
Table 6 High Growth Case Scenario
Table 7 Global Coconut Extracts Revenue (USD Million) And CAGR (%) By Type (2021-2032)
Table 8 Global Coconut Extracts Revenue (USD Million) And CAGR (%) By Application (2021-2032)
Table 9 Global Coconut Extracts Revenue (USD Million) And CAGR (%) By Product (2021-2032)
Table 10 Global Coconut Extracts Market Revenue (USD Million) By Regions (2021-2032)
Table 11 Global Coconut Extracts Market Share (%) By Regions (2021-2032)
Table 12 North America Coconut Extracts Revenue (USD Million) By Country (2021-2032)
Table 13 Europe Coconut Extracts Revenue (USD Million) By Country (2021-2032)
Table 14 Asia Pacific Coconut Extracts Revenue (USD Million) By Country (2021-2032)
Table 15 South America Coconut Extracts Revenue (USD Million) By Country (2021-2032)
Table 16 Middle East and Africa Coconut Extracts Revenue (USD Million) By Region (2021-2032)
Table 17 North America Coconut Extracts Revenue (USD Million) By Type (2021-2032)
Table 18 North America Coconut Extracts Revenue (USD Million) By Application (2021-2032)
Table 19 North America Coconut Extracts Revenue (USD Million) By Product (2021-2032)
Table 20 Europe Coconut Extracts Revenue (USD Million) By Type (2021-2032)
Table 21 Europe Coconut Extracts Revenue (USD Million) By Application (2021-2032)
Table 22 Europe Coconut Extracts Revenue (USD Million) By Product (2021-2032)
Table 23 Asia Pacific Coconut Extracts Revenue (USD Million) By Type (2021-2032)
Table 24 Asia Pacific Coconut Extracts Revenue (USD Million) By Application (2021-2032)
Table 25 Asia Pacific Coconut Extracts Revenue (USD Million) By Product (2021-2032)
Table 26 South America Coconut Extracts Revenue (USD Million) By Type (2021-2032)
Table 27 South America Coconut Extracts Revenue (USD Million) By Application (2021-2032)
Table 28 South America Coconut Extracts Revenue (USD Million) By Product (2021-2032)
Table 29 Middle East and Africa Coconut Extracts Revenue (USD Million) By Type (2021-2032)
Table 30 Middle East and Africa Coconut Extracts Revenue (USD Million) By Application (2021-2032)
Table 31 Middle East and Africa Coconut Extracts Revenue (USD Million) By Product (2021-2032)
LIST OF FIGURES
Figure 1. Market Scope
Figure 2. Pricing Forecasts Per Unit, 2023- 2032
Figure 3. Porter’s Five Forces
Figure 4. Global Coconut Extracts Market Revenue (USD Million) By Regions (2021-2032)
Figure 5. Global Coconut Extracts Market Share (%) By Regions (2023)
Figure 6. North America Coconut Extracts Revenue (USD Million) By Country (2021-2032)
Figure 7. United States Coconut Extracts Revenue (USD Million) By Country (2021-2032)
Figure 8. Canada Coconut Extracts Revenue (USD Million) By Country (2021-2032)
Figure 9. Mexico Coconut Extracts Revenue (USD Million) By Country (2021-2032)
Figure 10. Europe Coconut Extracts Revenue (USD Million) By Country (2021-2032)
Figure 11. Germany Coconut Extracts Revenue (USD Million) By Country (2021-2032)
Figure 12. France Coconut Extracts Revenue (USD Million) By Country (2021-2032)
Figure 13. United Kingdom Coconut Extracts Revenue (USD Million) By Country (2021-2032)
Figure 14. Spain Coconut Extracts Revenue (USD Million) By Country (2021-2032)
Figure 15. Italy Coconut Extracts Revenue (USD Million) By Country (2021-2032)
Figure 16. Russia Coconut Extracts Revenue (USD Million) By Country (2021-2032)
Figure 17. Rest of Europe Coconut Extracts Revenue (USD Million) By Country (2021-2032)
Figure 11. Asia Pacific Coconut Extracts Revenue (USD Million) By Country (2021-2032)
Figure 12. China Coconut Extracts Revenue (USD Million) By Country (2021-2032)
Figure 13. Japan Coconut Extracts Revenue (USD Million) By Country (2021-2032)
Figure 14. India Coconut Extracts Revenue (USD Million) By Country (2021-2032)
Figure 15. South Korea Coconut Extracts Revenue (USD Million) By Country (2021-2032)
Figure 16. Australia Coconut Extracts Revenue (USD Million) By Country (2021-2032)
Figure 17. South East Asia Coconut Extracts Revenue (USD Million) By Country (2021-2032)
Figure 18. South America Coconut Extracts Revenue (USD Million) By Country (2021-2032)
Figure 19. Brazil Coconut Extracts Revenue (USD Million) By Country (2021-2032)
Figure 20. Argentina Coconut Extracts Revenue (USD Million) By Country (2021-2032)
Figure 21. Rest of Asia Pacific Coconut Extracts Revenue (USD Million) By Country (2021-2032)
Figure 22. Middle East and Africa Coconut Extracts Revenue (USD Million) By Region (2021-2032)
Figure 23. Saudi Arabia Coconut Extracts Revenue (USD Million) By Region (2021-2032)
Figure 24. The UAE Coconut Extracts Revenue (USD Million) By Region (2021-2032)
Figure 25. Rest of Middle East Coconut Extracts Revenue (USD Million) By Region (2021-2032)
Figure 26. South Africa Coconut Extracts Revenue (USD Million) By Region (2021-2032)
Figure 27. Africa Coconut Extracts Revenue (USD Million) By Region (2021-2032)
Figure 28. North America Coconut Extracts Revenue (USD Million) By Type (2021-2032)
Figure 29. North America Coconut Extracts Revenue (USD Million) By Application (2021-2032)
Figure 30. North America Coconut Extracts Revenue (USD Million) By Product (2021-2032)
Figure 31. Europe Coconut Extracts Revenue (USD Million) By Type (2021-2032)
Figure 32. Europe Coconut Extracts Revenue (USD Million) By Application (2021-2032)
Figure 33. Europe Coconut Extracts Revenue (USD Million) By Product (2021-2032)
Figure 34. Asia Pacific Coconut Extracts Revenue (USD Million) By Type (2021-2032)
Figure 35. Asia Pacific Coconut Extracts Revenue (USD Million) By Application (2021-2032)
Figure 36. Asia Pacific Coconut Extracts Revenue (USD Million) By Product (2021-2032)
Figure 37. South America Coconut Extracts Revenue (USD Million) By Type (2021-2032)
Figure 38. South America Coconut Extracts Revenue (USD Million) By Application (2021-2032)
Figure 39. South America Coconut Extracts Revenue (USD Million) By Product (2021-2032)
Figure 40. Middle East and Africa Coconut Extracts Revenue (USD Million) By Type (2021-2032)
Figure 41. Middle East and Africa Coconut Extracts Revenue (USD Million) By Application (2021-2032)
Figure 42. Middle East and Africa Coconut Extracts Revenue (USD Million) By Product (2021-2032)
By Form
Liquid
Powder
By Application
Fortified Beverages
Dairy
Bakery
Confectionery
Cosmetics & Personal Care
Others
Countries Analyzed
North America (US, Canada, Mexico)
Europe (Germany, UK, France, Spain, Italy, Russia, Rest of Europe)
Asia Pacific (China, India, Japan, South Korea, Australia, South East Asia, Rest of Asia)
South America (Brazil, Argentina, Rest of South America)
Middle East and Africa (Saudi Arabia, UAE, Rest of Middle East, South Africa, Egypt, Rest of Africa)
