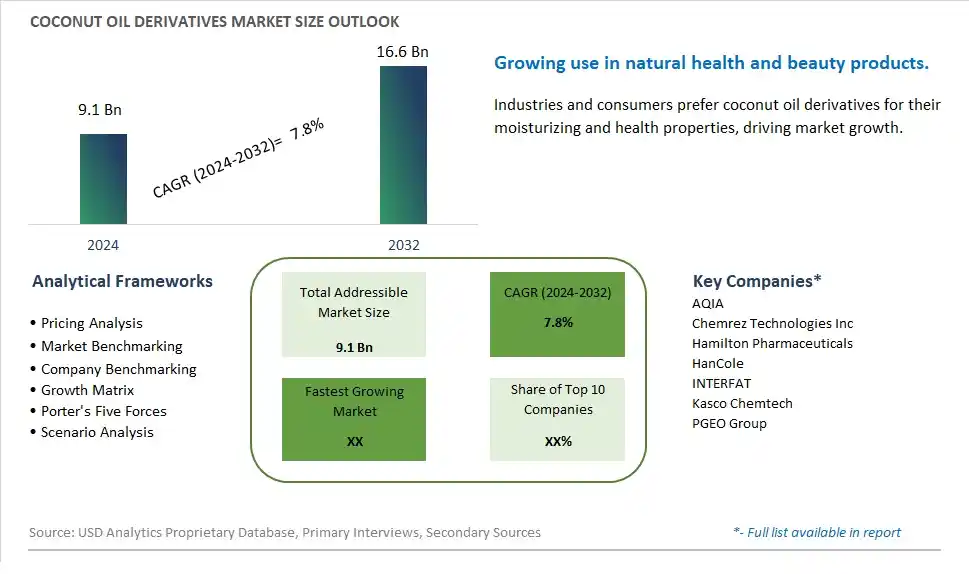
Global Coconut Oil Derivatives Market Size is valued at $9.1 Billion in 2024 and is forecast to register a growth rate (CAGR) of 7.8% to reach $16.6 Billion by 2032.
The global Coconut Oil Derivatives Market Comprehensive Study analyzes and forecasts the market size across 6 regions and 24 countries for diverse segments -By Type (Coconut Oil Fatty Acid, Hydrogenated Coconut Oil Derivatives), By Application (Cosmetics, Pharmaceuticals, Food, Paint, Inks, Lubricants, Plastics, Detergents)
An Introduction to Coconut Oil Derivatives Market
In 2024, the Coconut Oil Derivatives market is witnessing significant growth, driven by the increasing demand for versatile and natural ingredients in the food, cosmetic, and pharmaceutical industries. Coconut oil derivatives, including fractionated coconut oil, coconut fatty acids, and monoglycerides, are valued for their moisturizing, antimicrobial, and emulsifying properties. The market is supported by the growing trend towards clean-label and sustainable products. Advances in extraction and refining technologies are enhancing the quality, purity, and functionality of coconut oil derivatives. The market is also benefiting from the trend towards natural and multi-functional ingredients, appealing to manufacturers and consumers seeking high-quality and ethical products.
Coconut Oil Derivatives Competitive Landscape
The market report analyses the leading companies in the industry including AQIA, Chemrez Technologies Inc, Hamilton Pharmaceuticals, HanCole, INTERFAT, Kasco Chemtech, PGEO Group, and Others.
Coconut Oil Derivatives Market Dynamics
Coconut Oil Derivatives Market Trend: Rise in Demand for Natural and Sustainable Ingredients
Coconut oil derivatives are experiencing a significant trend due to the rise in demand for natural and sustainable ingredients in various industries. Consumers and manufacturers alike are shifting towards eco-friendly and renewable resources, and coconut oil derivatives fit well into this trend. These derivatives, such as fractionated coconut oil, MCT oil, and coconut-based emulsifiers, are valued for their natural origin, versatility, and potential health benefits, driving their adoption across sectors like food, cosmetics, pharmaceuticals, and biofuels.
Coconut Oil Derivatives Market Driver: Health-Conscious Consumer Preferences
The market for coconut oil derivatives is being driven by health-conscious consumer preferences. As consumers become more aware of the health implications of their choices, they are opting for products that offer perceived health benefits. Coconut oil derivatives, especially medium-chain triglycerides (MCTs), are recognized for their potential health advantages such as promoting weight loss, improving cognitive function, and supporting heart health. This health halo surrounding coconut oil derivatives is propelling their demand in various product formulations and applications.
Coconut Oil Derivatives Market Opportunity: Innovation and Expansion in Product Applications
An opportunity within the coconut oil derivatives market lies in innovation and expansion in product applications. Manufacturers can explore new ways to use coconut oil derivatives in food products, such as in health bars, functional beverages, and dairy alternatives. In the cosmetics and personal care industry, coconut oil derivatives can be utilized in natural skincare formulations, hair care products, and beauty supplements. Furthermore, the pharmaceutical and nutraceutical sectors present opportunities for the development of novel drug delivery systems, dietary supplements, and functional ingredients using coconut oil derivatives. By focusing on research, development, and strategic partnerships, companies can tap into these diverse application areas and unlock the full potential of coconut oil derivatives in the market.
Coconut Oil Derivatives Market Share Analysis: Coconut Oil Fatty Acid segment generated the highest revenue share in the industry
Among the types in the Coconut Oil Derivatives Market, Coconut Oil Fatty Acid emerges as the largest segment. This segment's dominance can be attributed to several factors contributing to its significant market share. Coconut Oil Fatty Acid is a key component derived from coconut oil through various processing methods such as fractionation, distillation, or hydrolysis. It finds extensive applications across industries such as food and beverages, cosmetics, pharmaceuticals, and household products due to its versatile properties. Coconut Oil Fatty Acid serves as a raw material for manufacturing soap, detergents, cosmetics, and personal care products, contributing to its widespread adoption by manufacturers in these sectors. Additionally, the growing demand for natural and sustainable ingredients in various consumer products further boosts the market for Coconut Oil Fatty Acid. With its multifunctional uses, stable market demand, and wide-ranging applications, the Coconut Oil Fatty Acid segment is poised for continued growth and market leadership in the Coconut Oil Derivatives Market.
Coconut Oil Derivatives Market Share Analysis: Cosmetics is the fastest growing segment over the forecast period to 2032
The Cosmetics segment is projected to be the fastest-growing segment in the Coconut Oil Derivatives Market until 2032. This accelerated growth is driven by several factors contributing to the increasing demand for coconut oil derivatives in the cosmetics industry. Coconut oil derivatives such as coconut oil fatty acid, fractionated coconut oil, and hydrogenated coconut oil are widely used in the formulation of various cosmetics and personal care products. They serve as natural emollients, moisturizers, and conditioning agents, providing skin and hair care benefits. The shift towards natural and organic ingredients in cosmetic formulations, coupled with the rising consumer awareness regarding the benefits of coconut-derived ingredients, is fueling the demand for coconut oil derivatives in the cosmetics sector. Furthermore, the versatility of coconut oil derivatives in formulating a wide range of cosmetics, including lotions, creams, shampoos, conditioners, soaps, and makeup products, contributes to their substantial growth potential. As cosmetic manufacturers continue to innovate and introduce new products with coconut oil derivatives, the Cosmetics segment is expected to experience rapid growth and expansion in the Coconut Oil Derivatives Market.
Coconut Oil Derivatives Market Segmentation
By Type
Coconut Oil Fatty Acid
Hydrogenated Coconut Oil Derivatives
By Application
Cosmetics
Pharmaceuticals
Food
Paint, Inks
Lubricants
Plastics
Detergents
Countries Analyzed
North America (US, Canada, Mexico)
Europe (Germany, UK, France, Spain, Italy, Russia, Rest of Europe)
Asia Pacific (China, India, Japan, South Korea, Australia, South East Asia, Rest of Asia)
South America (Brazil, Argentina, Rest of South America)
Middle East and Africa (Saudi Arabia, UAE, Rest of Middle East, South Africa, Egypt, Rest of Africa)
Coconut Oil Derivatives Companies Profiled in the Study
AQIA
Chemrez Technologies Inc
Hamilton Pharmaceuticals
HanCole
INTERFAT
Kasco Chemtech
PGEO Group
*- List Not Exhaustive
Chapter 1. TABLE OF CONTENTS
Chapter 2. Introduction to Coconut Oil Derivatives Market
2.1. Market Overview
2.2. Key Statistics and Report Highlights
2.3. Scope of the Comprehensive Study
2.3.1. Market Definition
2.3.2 Countries and Regions Covered
2.3.3 Research Objective
2.3.4 Units, Currency, and Conversions
2.3.5 Industry Value Chain
2.4. Key Market Segments
2.5. Key Companies
2.6. Study Period
Chapter 3. Strategic Analysis Review
3.1. Coconut Oil Derivatives Pricing Analysis and Forecast
3.2. Porter’s Five Forces
3.3. Market Ecosystem
3.4. SWOT Analysis
3.5. Regulatory Scenario
3.3. Effects of Inflation, Russia-Ukraine War, moderating economic growth, and other macroeconomic factors
Chapter 4. Competitive Landscape
4.1. Market Share Analysis
4.1.1. Global Coconut Oil Derivatives Market Share by Company, 2023
4.1.2. Product Offerings of Leading Coconut Oil Derivatives Companies
4.2. Market Entropy
4.2.1. New Product Launches in the Industry
4.2.2. Mergers, Acquisitions, Joint ventures, and Partnerships
4.3. Key Strategies and Best Practices
Chapter 5. Global Market Projections: Best, Reference, and Low Case Scenarios
5.1. Growth Analysis- Case Scenario Definitions
5.2. Low Growth Case Scenario Forecasts
5.3. Reference Growth Case Scenario Forecasts
5.4. High Growth Case Scenario Forecasts
Chapter 6. Market Dynamics
6.1. Coconut Oil Derivatives Market Drivers
6.2. Coconut Oil Derivatives Market Challenges
6.6. Coconut Oil Derivatives Market Opportunities
6.4. Coconut Oil Derivatives Market Trends
Chapter 7. Global Coconut Oil Derivatives Market Outlook Trends
7.1. Global Coconut Oil Derivatives Revenue (USD Million) and CAGR (%) by Type (2021-2032)
7.2. Global Coconut Oil Derivatives Revenue (USD Million) and CAGR (%) by Application (2021-2032)
7.3. Global Coconut Oil Derivatives Revenue (USD Million) and CAGR (%) by Product (2021-2032)
By Type
Coconut Oil Fatty Acid
Hydrogenated Coconut Oil Derivatives
By Application
Cosmetics
Pharmaceuticals
Food
Paint, Inks
Lubricants
Plastics
Detergents
Chapter 8. Global Coconut Oil Derivatives Regional Analysis and Outlook
8.1. Global Coconut Oil Derivatives Revenue (USD Million) By Regions (2021- 2032)
8.2. North America Coconut Oil Derivatives Revenue (USD Million) by Country (2021-2032)
8.2.1. United States Coconut Oil Derivatives Regional Analysis and Outlook
8.2.2. Canada Coconut Oil Derivatives Regional Analysis and Outlook
8.2.3. Mexico Coconut Oil Derivatives Regional Analysis and Outlook
8.3. Europe Coconut Oil Derivatives Revenue (USD Million), by Country (2021-2032)
8.3.1. Germany Coconut Oil Derivatives Regional Analysis and Outlook
8.3.2. France Coconut Oil Derivatives Regional Analysis and Outlook
8.3.3. United Kingdom Coconut Oil Derivatives Regional Analysis and Outlook
8.3.4. Spain Coconut Oil Derivatives Regional Analysis and Outlook
8.3.5. Italy Coconut Oil Derivatives Regional Analysis and Outlook
8.3.6. Russia Coconut Oil Derivatives Regional Analysis and Outlook
8.3.7. Rest of Europe Coconut Oil Derivatives Regional Analysis and Outlook
8.4. Asia Pacific Coconut Oil Derivatives Revenue (USD Million) by Country (2021-2032)
8.4.1. China Coconut Oil Derivatives Regional Analysis and Outlook
8.4.2. Japan Coconut Oil Derivatives Regional Analysis and Outlook
8.4.3. India Coconut Oil Derivatives Regional Analysis and Outlook
8.4.4. South Korea Coconut Oil Derivatives Regional Analysis and Outlook
8.4.5. Australia Coconut Oil Derivatives Regional Analysis and Outlook
8.4.6. South East Asia Coconut Oil Derivatives Regional Analysis and Outlook
8.4.7. Rest of Asia Pacific Coconut Oil Derivatives Regional Analysis and Outlook
8.5. South America Coconut Oil Derivatives Revenue (USD Million), by Country (2021-2032)
8.5.1. Brazil Coconut Oil Derivatives Regional Analysis and Outlook
8.5.2. Argentina Coconut Oil Derivatives Regional Analysis and Outlook
8.5.3. Rest of South America Coconut Oil Derivatives Regional Analysis and Outlook
8.6. Middle East and Africa Coconut Oil Derivatives Revenue (USD Million) by Country (2021-2032)
8.6.1. Middle East Coconut Oil Derivatives Regional Analysis and Outlook
8.6.2. Africa Coconut Oil Derivatives Regional Analysis and Outlook
Chapter 9. North America Coconut Oil Derivatives Analysis and Outlook
9.1. North America Coconut Oil Derivatives Revenue (USD Million) by Segments (2021-2032)
9.1.1. North America Coconut Oil Derivatives Revenue (USD Million) by Type (2021-2032)
9.1.2. North America Coconut Oil Derivatives Revenue (USD Million) by Application (2021-2032)
9.1.3. North America Coconut Oil Derivatives Revenue (USD Million) by Product (2021-2032)
By Type
Coconut Oil Fatty Acid
Hydrogenated Coconut Oil Derivatives
By Application
Cosmetics
Pharmaceuticals
Food
Paint, Inks
Lubricants
Plastics
Detergents
Chapter 10. Europe Coconut Oil Derivatives Analysis and Outlook
10.1. Europe Coconut Oil Derivatives Revenue (USD Million), by Segments (USD Million) (2021-2032)
10.1.1. Europe Coconut Oil Derivatives Revenue (USD Million) by Type (2021-2032)
10.1.2. Europe Coconut Oil Derivatives Revenue (USD Million) by Application (2021-2032)
10.1.3. Europe Coconut Oil Derivatives Revenue (USD Million) by Product (2021-2032)
By Type
Coconut Oil Fatty Acid
Hydrogenated Coconut Oil Derivatives
By Application
Cosmetics
Pharmaceuticals
Food
Paint, Inks
Lubricants
Plastics
Detergents
Chapter 11. Asia Pacific Coconut Oil Derivatives Analysis and Outlook
11.1. Asia Pacific Coconut Oil Derivatives Revenue (USD Million), and Revenue (USD Million) by Segments (2021-2032)
11.1.1. Asia Pacific Coconut Oil Derivatives Revenue (USD Million) by Type (2021-2032)
11.1.2. Asia Pacific Coconut Oil Derivatives Revenue (USD Million) by Application (2021-2032)
11.1.3. Asia Pacific Coconut Oil Derivatives Revenue (USD Million) by Product (2021-2032)
By Type
Coconut Oil Fatty Acid
Hydrogenated Coconut Oil Derivatives
By Application
Cosmetics
Pharmaceuticals
Food
Paint, Inks
Lubricants
Plastics
Detergents
Chapter 12. South America Coconut Oil Derivatives Analysis and Outlook
12.1. South America Coconut Oil Derivatives Revenue (USD Million), by Segments (2021-2032)
12.1.1. South America Coconut Oil Derivatives Revenue (USD Million) by Type (2021-2032)
12.1.2. South America Coconut Oil Derivatives Revenue (USD Million) by Application (2021-2032)
12.1.3. South America Coconut Oil Derivatives Revenue (USD Million) by Product (2021-2032)
By Type
Coconut Oil Fatty Acid
Hydrogenated Coconut Oil Derivatives
By Application
Cosmetics
Pharmaceuticals
Food
Paint, Inks
Lubricants
Plastics
Detergents
Chapter 13. Middle East and Africa Coconut Oil Derivatives Analysis and Outlook
13.1. Middle East and Africa Coconut Oil Derivatives Revenue (USD Million), by Segments (2021-2032)
13.1.1. Middle East and Africa Coconut Oil Derivatives Revenue (USD Million) by Type (2021-2032)
13.1.2. Middle East and Africa Coconut Oil Derivatives Revenue (USD Million) by Application (2021-2032)
13.1.3. Middle East and Africa Coconut Oil Derivatives Revenue (USD Million) by Product (2021-2032)
By Type
Coconut Oil Fatty Acid
Hydrogenated Coconut Oil Derivatives
By Application
Cosmetics
Pharmaceuticals
Food
Paint, Inks
Lubricants
Plastics
Detergents
Chapter 14. Coconut Oil Derivatives Company Profiles
14.1 Business Overview
14.2 Product Profiles
14.3 SWOT Profiles
14.5 Recent Developments
14.6 Financial Profile
List of Companies
AQIA
Chemrez Technologies Inc
Hamilton Pharmaceuticals
HanCole
INTERFAT
Kasco Chemtech
PGEO Group
15. Methodology and Data Sources
15.1 Customization Offerings
15.2 Subscription Services
15.3 Related Reports
15.4 Publisher Expertise
LIST OF TABLES
Table 1 Market Segmentation Analysis
Table 2 Global Coconut Oil Derivatives Market Share of Leading Companies, 2023
Table 3 Product Offerings of Leading Companies
Table 4 Low Growth Scenario Forecasts
Table 5 Reference Case Growth Scenario
Table 6 High Growth Case Scenario
Table 7 Global Coconut Oil Derivatives Revenue (USD Million) And CAGR (%) By Type (2021-2032)
Table 8 Global Coconut Oil Derivatives Revenue (USD Million) And CAGR (%) By Application (2021-2032)
Table 9 Global Coconut Oil Derivatives Revenue (USD Million) And CAGR (%) By Product (2021-2032)
Table 10 Global Coconut Oil Derivatives Market Revenue (USD Million) By Regions (2021-2032)
Table 11 Global Coconut Oil Derivatives Market Share (%) By Regions (2021-2032)
Table 12 North America Coconut Oil Derivatives Revenue (USD Million) By Country (2021-2032)
Table 13 Europe Coconut Oil Derivatives Revenue (USD Million) By Country (2021-2032)
Table 14 Asia Pacific Coconut Oil Derivatives Revenue (USD Million) By Country (2021-2032)
Table 15 South America Coconut Oil Derivatives Revenue (USD Million) By Country (2021-2032)
Table 16 Middle East and Africa Coconut Oil Derivatives Revenue (USD Million) By Region (2021-2032)
Table 17 North America Coconut Oil Derivatives Revenue (USD Million) By Type (2021-2032)
Table 18 North America Coconut Oil Derivatives Revenue (USD Million) By Application (2021-2032)
Table 19 North America Coconut Oil Derivatives Revenue (USD Million) By Product (2021-2032)
Table 20 Europe Coconut Oil Derivatives Revenue (USD Million) By Type (2021-2032)
Table 21 Europe Coconut Oil Derivatives Revenue (USD Million) By Application (2021-2032)
Table 22 Europe Coconut Oil Derivatives Revenue (USD Million) By Product (2021-2032)
Table 23 Asia Pacific Coconut Oil Derivatives Revenue (USD Million) By Type (2021-2032)
Table 24 Asia Pacific Coconut Oil Derivatives Revenue (USD Million) By Application (2021-2032)
Table 25 Asia Pacific Coconut Oil Derivatives Revenue (USD Million) By Product (2021-2032)
Table 26 South America Coconut Oil Derivatives Revenue (USD Million) By Type (2021-2032)
Table 27 South America Coconut Oil Derivatives Revenue (USD Million) By Application (2021-2032)
Table 28 South America Coconut Oil Derivatives Revenue (USD Million) By Product (2021-2032)
Table 29 Middle East and Africa Coconut Oil Derivatives Revenue (USD Million) By Type (2021-2032)
Table 30 Middle East and Africa Coconut Oil Derivatives Revenue (USD Million) By Application (2021-2032)
Table 31 Middle East and Africa Coconut Oil Derivatives Revenue (USD Million) By Product (2021-2032)
LIST OF FIGURES
Figure 1. Market Scope
Figure 2. Pricing Forecasts Per Unit, 2023- 2032
Figure 3. Porter’s Five Forces
Figure 4. Global Coconut Oil Derivatives Market Revenue (USD Million) By Regions (2021-2032)
Figure 5. Global Coconut Oil Derivatives Market Share (%) By Regions (2023)
Figure 6. North America Coconut Oil Derivatives Revenue (USD Million) By Country (2021-2032)
Figure 7. United States Coconut Oil Derivatives Revenue (USD Million) By Country (2021-2032)
Figure 8. Canada Coconut Oil Derivatives Revenue (USD Million) By Country (2021-2032)
Figure 9. Mexico Coconut Oil Derivatives Revenue (USD Million) By Country (2021-2032)
Figure 10. Europe Coconut Oil Derivatives Revenue (USD Million) By Country (2021-2032)
Figure 11. Germany Coconut Oil Derivatives Revenue (USD Million) By Country (2021-2032)
Figure 12. France Coconut Oil Derivatives Revenue (USD Million) By Country (2021-2032)
Figure 13. United Kingdom Coconut Oil Derivatives Revenue (USD Million) By Country (2021-2032)
Figure 14. Spain Coconut Oil Derivatives Revenue (USD Million) By Country (2021-2032)
Figure 15. Italy Coconut Oil Derivatives Revenue (USD Million) By Country (2021-2032)
Figure 16. Russia Coconut Oil Derivatives Revenue (USD Million) By Country (2021-2032)
Figure 17. Rest of Europe Coconut Oil Derivatives Revenue (USD Million) By Country (2021-2032)
Figure 11. Asia Pacific Coconut Oil Derivatives Revenue (USD Million) By Country (2021-2032)
Figure 12. China Coconut Oil Derivatives Revenue (USD Million) By Country (2021-2032)
Figure 13. Japan Coconut Oil Derivatives Revenue (USD Million) By Country (2021-2032)
Figure 14. India Coconut Oil Derivatives Revenue (USD Million) By Country (2021-2032)
Figure 15. South Korea Coconut Oil Derivatives Revenue (USD Million) By Country (2021-2032)
Figure 16. Australia Coconut Oil Derivatives Revenue (USD Million) By Country (2021-2032)
Figure 17. South East Asia Coconut Oil Derivatives Revenue (USD Million) By Country (2021-2032)
Figure 18. South America Coconut Oil Derivatives Revenue (USD Million) By Country (2021-2032)
Figure 19. Brazil Coconut Oil Derivatives Revenue (USD Million) By Country (2021-2032)
Figure 20. Argentina Coconut Oil Derivatives Revenue (USD Million) By Country (2021-2032)
Figure 21. Rest of Asia Pacific Coconut Oil Derivatives Revenue (USD Million) By Country (2021-2032)
Figure 22. Middle East and Africa Coconut Oil Derivatives Revenue (USD Million) By Region (2021-2032)
Figure 23. Saudi Arabia Coconut Oil Derivatives Revenue (USD Million) By Region (2021-2032)
Figure 24. The UAE Coconut Oil Derivatives Revenue (USD Million) By Region (2021-2032)
Figure 25. Rest of Middle East Coconut Oil Derivatives Revenue (USD Million) By Region (2021-2032)
Figure 26. South Africa Coconut Oil Derivatives Revenue (USD Million) By Region (2021-2032)
Figure 27. Africa Coconut Oil Derivatives Revenue (USD Million) By Region (2021-2032)
Figure 28. North America Coconut Oil Derivatives Revenue (USD Million) By Type (2021-2032)
Figure 29. North America Coconut Oil Derivatives Revenue (USD Million) By Application (2021-2032)
Figure 30. North America Coconut Oil Derivatives Revenue (USD Million) By Product (2021-2032)
Figure 31. Europe Coconut Oil Derivatives Revenue (USD Million) By Type (2021-2032)
Figure 32. Europe Coconut Oil Derivatives Revenue (USD Million) By Application (2021-2032)
Figure 33. Europe Coconut Oil Derivatives Revenue (USD Million) By Product (2021-2032)
Figure 34. Asia Pacific Coconut Oil Derivatives Revenue (USD Million) By Type (2021-2032)
Figure 35. Asia Pacific Coconut Oil Derivatives Revenue (USD Million) By Application (2021-2032)
Figure 36. Asia Pacific Coconut Oil Derivatives Revenue (USD Million) By Product (2021-2032)
Figure 37. South America Coconut Oil Derivatives Revenue (USD Million) By Type (2021-2032)
Figure 38. South America Coconut Oil Derivatives Revenue (USD Million) By Application (2021-2032)
Figure 39. South America Coconut Oil Derivatives Revenue (USD Million) By Product (2021-2032)
Figure 40. Middle East and Africa Coconut Oil Derivatives Revenue (USD Million) By Type (2021-2032)
Figure 41. Middle East and Africa Coconut Oil Derivatives Revenue (USD Million) By Application (2021-2032)
Figure 42. Middle East and Africa Coconut Oil Derivatives Revenue (USD Million) By Product (2021-2032)
By Type
Coconut Oil Fatty Acid
Hydrogenated Coconut Oil Derivatives
By Application
Cosmetics
Pharmaceuticals
Food
Paint, Inks
Lubricants
Plastics
Detergents
Countries Analyzed
North America (US, Canada, Mexico)
Europe (Germany, UK, France, Spain, Italy, Russia, Rest of Europe)
Asia Pacific (China, India, Japan, South Korea, Australia, South East Asia, Rest of Asia)
South America (Brazil, Argentina, Rest of South America)
Middle East and Africa (Saudi Arabia, UAE, Rest of Middle East, South Africa, Egypt, Rest of Africa)
