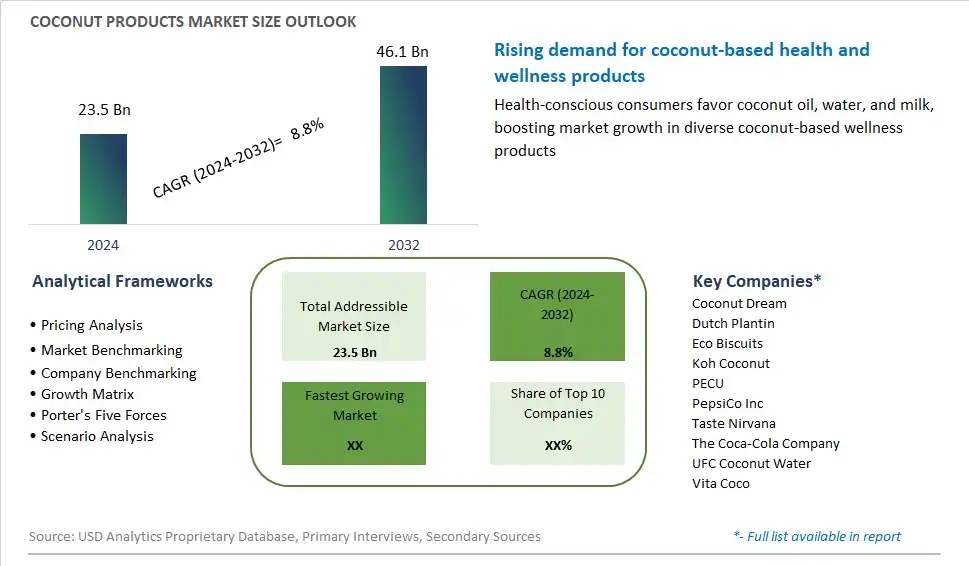
Global Coconut Products Market Size is valued at $23.5 Billion in 2024 and is forecast to register a growth rate (CAGR) of 8.8% to reach $46.1 Billion by 2032.
The global Coconut Products Market Comprehensive Study analyzes and forecasts the market size across 6 regions and 24 countries for diverse segments -By Product (Coconut Oil, Coconut Water, Coconut Milk/Cream, Others), By Application (Cosmetics, Food & Beverage, Others)
An Introduction to Coconut Products Market
The coconut products market in 2024 is expanding rapidly, driven by the versatility and health benefits of coconut-derived goods. This market includes a wide range of products such as coconut oil, milk, water, flour, and shredded coconut, all of which are prized for their nutritional properties and culinary uses. The growing popularity of plant-based diets and the demand for natural, minimally processed foods are key drivers of market growth. Coconut products are valued for their healthy fats, hydrating properties, and high fiber content, making them popular in both the food and beverage and health and wellness sectors. Innovations in processing and packaging are enhancing the convenience and shelf life of coconut products, further boosting their appeal to health-conscious consumers around the world.
Coconut Products Competitive Landscape
The market report analyses the leading companies in the industry including Coconut Dream, Dutch Plantin, Eco Biscuits, Koh Coconut, PECU, PepsiCo Inc, Taste Nirvana, The Coca-Cola Company, UFC Coconut Water, Vita Coco, and Others.
Coconut Products Market Dynamics
Coconut Products Market Trend: Growing Demand for Plant-Based and Vegan Alternatives
One of the most prominent trends in the coconut products market is the growing demand for plant-based and vegan alternatives. As consumers become more health-conscious and environmentally aware, there is a shift towards plant-based diets and sustainable food choices. Coconut products, including coconut oil, coconut milk, coconut water, and coconut flour, are naturally derived from coconuts and are inherently vegan-friendly. This trend is driven by factors such as concerns about animal welfare, health benefits associated with plant-based diets, and environmental sustainability. Coconut products offer versatile alternatives to traditional dairy, cooking oils, and baking ingredients, appealing to consumers seeking nutritious, ethical, and eco-friendly options for their diets.
Market Driver: Health and Wellness Benefits of Coconut Products
The primary driver of the coconut products market is the health and wellness benefits associated with coconut products. Coconuts are rich in medium-chain fatty acids, vitamins, minerals, and antioxidants, offering a range of health benefits such as improved heart health, boosted immune function, and enhanced metabolism. Coconut oil, in particular, has gained popularity for its potential therapeutic properties, including antimicrobial, anti-inflammatory, and skin-nourishing effects. Additionally, coconut milk and coconut water are valued for their hydration and electrolyte replenishment properties, making them popular choices among athletes and health-conscious consumers. The perceived health benefits of coconut products drive demand for these items in the market, with consumers incorporating them into their daily diets and wellness routines.
Market Opportunity: Expansion into Functional and Specialty Coconut Products
A significant opportunity for the coconut products market lies in expansion into functional and specialty coconut products. While coconut oil, milk, and water are widely consumed, there is potential to introduce innovative products that offer added health benefits or cater to specific consumer needs. This can include functional coconut products such as coconut-based snacks fortified with vitamins, protein-rich coconut snacks, or probiotic coconut beverages for gut health. Moreover, there is an opportunity to develop specialty coconut items such as coconut sugar, coconut vinegar, coconut-based condiments, and coconut-based skincare products, tapping into diverse market segments and consumer preferences. By investing in product innovation and diversification, coconut product manufacturers can capitalize on emerging trends, expand market reach, and differentiate themselves in the competitive marketplace.
Coconut Products Market Share Analysis: Coconut Oil held the dominant market share in 2024
Within the Coconut Products Market, Coconut Oil is the largest segment. This prominence can be attributed to the versatile uses of coconut oil across various industries, including food and beverage, cosmetics, pharmaceuticals, and personal care. Coconut oil is widely recognized for its health benefits, such as promoting heart health, aiding digestion, and boosting immunity, which has led to its widespread adoption in cooking and food preparation. Further, coconut oil's natural moisturizing properties make it a popular ingredient in skincare and haircare products, further driving its demand. With increasing consumer awareness about the health benefits of coconut oil and its diverse applications, the Coconut Oil segment maintains its leading position in the Coconut Products Market.
Coconut Products Market Share Analysis: Cosmetics market is poised to register the fastest growth rae over the forecast period to 2032
Among the segments of the Coconut Products Market, the Cosmetics segment stands out as the fastest growing. This accelerated growth can be attributed to the increasing consumer preference for natural and organic ingredients in cosmetic products. Coconut-derived ingredients, such as coconut oil, coconut water, and coconut milk/cream, are renowned for their moisturizing, nourishing, and anti-inflammatory properties, making them highly sought after in the cosmetics industry. The rising demand for skincare, haircare, and personal care products formulated with coconut-derived ingredients reflects a shift towards clean beauty and wellness-oriented lifestyles. Additionally, the versatility of coconut-derived ingredients allows for their incorporation into a wide range of cosmetic formulations, catering to various skincare and haircare needs. As consumers continue to prioritize natural and sustainable beauty products, the Cosmetics segment of the Coconut Products Market is poised for continued rapid growth.
Coconut Products Market Segmentation
By Product
Coconut Oil
Coconut Water
Coconut Milk/Cream
Others
By Application
Cosmetics
Food & Beverage
Others
Countries Analyzed
North America (US, Canada, Mexico)
Europe (Germany, UK, France, Spain, Italy, Russia, Rest of Europe)
Asia Pacific (China, India, Japan, South Korea, Australia, South East Asia, Rest of Asia)
South America (Brazil, Argentina, Rest of South America)
Middle East and Africa (Saudi Arabia, UAE, Rest of Middle East, South Africa, Egypt, Rest of Africa)
Coconut Products Companies Profiled in the Study
Coconut Dream
Dutch Plantin
Eco Biscuits
Koh Coconut
PECU
PepsiCo Inc
Taste Nirvana
The Coca-Cola Company
UFC Coconut Water
Vita Coco
*- List Not Exhaustive
Chapter 1. TABLE OF CONTENTS
Chapter 2. Introduction to Coconut Products Market
2.1. Market Overview
2.2. Key Statistics and Report Highlights
2.3. Scope of the Comprehensive Study
2.3.1. Market Definition
2.3.2 Countries and Regions Covered
2.3.3 Research Objective
2.3.4 Units, Currency, and Conversions
2.3.5 Industry Value Chain
2.4. Key Market Segments
2.5. Key Companies
2.6. Study Period
Chapter 3. Strategic Analysis Review
3.1. Coconut Products Pricing Analysis and Forecast
3.2. Porter’s Five Forces
3.3. Market Ecosystem
3.4. SWOT Analysis
3.5. Regulatory Scenario
3.3. Effects of Inflation, Russia-Ukraine War, moderating economic growth, and other macroeconomic factors
Chapter 4. Competitive Landscape
4.1. Market Share Analysis
4.1.1. Global Coconut Products Market Share by Company, 2023
4.1.2. Product Offerings of Leading Coconut Products Companies
4.2. Market Entropy
4.2.1. New Product Launches in the Industry
4.2.2. Mergers, Acquisitions, Joint ventures, and Partnerships
4.3. Key Strategies and Best Practices
Chapter 5. Global Market Projections: Best, Reference, and Low Case Scenarios
5.1. Growth Analysis- Case Scenario Definitions
5.2. Low Growth Case Scenario Forecasts
5.3. Reference Growth Case Scenario Forecasts
5.4. High Growth Case Scenario Forecasts
Chapter 6. Market Dynamics
6.1. Coconut Products Market Drivers
6.2. Coconut Products Market Challenges
6.6. Coconut Products Market Opportunities
6.4. Coconut Products Market Trends
Chapter 7. Global Coconut Products Market Outlook Trends
7.1. Global Coconut Products Revenue (USD Million) and CAGR (%) by Type (2021-2032)
7.2. Global Coconut Products Revenue (USD Million) and CAGR (%) by Application (2021-2032)
7.3. Global Coconut Products Revenue (USD Million) and CAGR (%) by Product (2021-2032)
By Product
Coconut Oil
Coconut Water
Coconut Milk/Cream
Others
By Application
Cosmetics
Food & Beverage
Others
Chapter 8. Global Coconut Products Regional Analysis and Outlook
8.1. Global Coconut Products Revenue (USD Million) By Regions (2021- 2032)
8.2. North America Coconut Products Revenue (USD Million) by Country (2021-2032)
8.2.1. United States Coconut Products Regional Analysis and Outlook
8.2.2. Canada Coconut Products Regional Analysis and Outlook
8.2.3. Mexico Coconut Products Regional Analysis and Outlook
8.3. Europe Coconut Products Revenue (USD Million), by Country (2021-2032)
8.3.1. Germany Coconut Products Regional Analysis and Outlook
8.3.2. France Coconut Products Regional Analysis and Outlook
8.3.3. United Kingdom Coconut Products Regional Analysis and Outlook
8.3.4. Spain Coconut Products Regional Analysis and Outlook
8.3.5. Italy Coconut Products Regional Analysis and Outlook
8.3.6. Russia Coconut Products Regional Analysis and Outlook
8.3.7. Rest of Europe Coconut Products Regional Analysis and Outlook
8.4. Asia Pacific Coconut Products Revenue (USD Million) by Country (2021-2032)
8.4.1. China Coconut Products Regional Analysis and Outlook
8.4.2. Japan Coconut Products Regional Analysis and Outlook
8.4.3. India Coconut Products Regional Analysis and Outlook
8.4.4. South Korea Coconut Products Regional Analysis and Outlook
8.4.5. Australia Coconut Products Regional Analysis and Outlook
8.4.6. South East Asia Coconut Products Regional Analysis and Outlook
8.4.7. Rest of Asia Pacific Coconut Products Regional Analysis and Outlook
8.5. South America Coconut Products Revenue (USD Million), by Country (2021-2032)
8.5.1. Brazil Coconut Products Regional Analysis and Outlook
8.5.2. Argentina Coconut Products Regional Analysis and Outlook
8.5.3. Rest of South America Coconut Products Regional Analysis and Outlook
8.6. Middle East and Africa Coconut Products Revenue (USD Million) by Country (2021-2032)
8.6.1. Middle East Coconut Products Regional Analysis and Outlook
8.6.2. Africa Coconut Products Regional Analysis and Outlook
Chapter 9. North America Coconut Products Analysis and Outlook
9.1. North America Coconut Products Revenue (USD Million) by Segments (2021-2032)
9.1.1. North America Coconut Products Revenue (USD Million) by Type (2021-2032)
9.1.2. North America Coconut Products Revenue (USD Million) by Application (2021-2032)
9.1.3. North America Coconut Products Revenue (USD Million) by Product (2021-2032)
By Product
Coconut Oil
Coconut Water
Coconut Milk/Cream
Others
By Application
Cosmetics
Food & Beverage
Others
Chapter 10. Europe Coconut Products Analysis and Outlook
10.1. Europe Coconut Products Revenue (USD Million), by Segments (USD Million) (2021-2032)
10.1.1. Europe Coconut Products Revenue (USD Million) by Type (2021-2032)
10.1.2. Europe Coconut Products Revenue (USD Million) by Application (2021-2032)
10.1.3. Europe Coconut Products Revenue (USD Million) by Product (2021-2032)
By Product
Coconut Oil
Coconut Water
Coconut Milk/Cream
Others
By Application
Cosmetics
Food & Beverage
Others
Chapter 11. Asia Pacific Coconut Products Analysis and Outlook
11.1. Asia Pacific Coconut Products Revenue (USD Million), and Revenue (USD Million) by Segments (2021-2032)
11.1.1. Asia Pacific Coconut Products Revenue (USD Million) by Type (2021-2032)
11.1.2. Asia Pacific Coconut Products Revenue (USD Million) by Application (2021-2032)
11.1.3. Asia Pacific Coconut Products Revenue (USD Million) by Product (2021-2032)
By Product
Coconut Oil
Coconut Water
Coconut Milk/Cream
Others
By Application
Cosmetics
Food & Beverage
Others
Chapter 12. South America Coconut Products Analysis and Outlook
12.1. South America Coconut Products Revenue (USD Million), by Segments (2021-2032)
12.1.1. South America Coconut Products Revenue (USD Million) by Type (2021-2032)
12.1.2. South America Coconut Products Revenue (USD Million) by Application (2021-2032)
12.1.3. South America Coconut Products Revenue (USD Million) by Product (2021-2032)
By Product
Coconut Oil
Coconut Water
Coconut Milk/Cream
Others
By Application
Cosmetics
Food & Beverage
Others
Chapter 13. Middle East and Africa Coconut Products Analysis and Outlook
13.1. Middle East and Africa Coconut Products Revenue (USD Million), by Segments (2021-2032)
13.1.1. Middle East and Africa Coconut Products Revenue (USD Million) by Type (2021-2032)
13.1.2. Middle East and Africa Coconut Products Revenue (USD Million) by Application (2021-2032)
13.1.3. Middle East and Africa Coconut Products Revenue (USD Million) by Product (2021-2032)
By Product
Coconut Oil
Coconut Water
Coconut Milk/Cream
Others
By Application
Cosmetics
Food & Beverage
Others
Chapter 14. Coconut Products Company Profiles
14.1 Business Overview
14.2 Product Profiles
14.3 SWOT Profiles
14.5 Recent Developments
14.6 Financial Profile
List of Companies
Coconut Dream
Dutch Plantin
Eco Biscuits
Koh Coconut
PECU
PepsiCo Inc
Taste Nirvana
The Coca-Cola Company
UFC Coconut Water
Vita Coco
15. Methodology and Data Sources
15.1 Customization Offerings
15.2 Subscription Services
15.3 Related Reports
15.4 Publisher Expertise
LIST OF TABLES
Table 1 Market Segmentation Analysis
Table 2 Global Coconut Products Market Share of Leading Companies, 2023
Table 3 Product Offerings of Leading Companies
Table 4 Low Growth Scenario Forecasts
Table 5 Reference Case Growth Scenario
Table 6 High Growth Case Scenario
Table 7 Global Coconut Products Revenue (USD Million) And CAGR (%) By Type (2021-2032)
Table 8 Global Coconut Products Revenue (USD Million) And CAGR (%) By Application (2021-2032)
Table 9 Global Coconut Products Revenue (USD Million) And CAGR (%) By Product (2021-2032)
Table 10 Global Coconut Products Market Revenue (USD Million) By Regions (2021-2032)
Table 11 Global Coconut Products Market Share (%) By Regions (2021-2032)
Table 12 North America Coconut Products Revenue (USD Million) By Country (2021-2032)
Table 13 Europe Coconut Products Revenue (USD Million) By Country (2021-2032)
Table 14 Asia Pacific Coconut Products Revenue (USD Million) By Country (2021-2032)
Table 15 South America Coconut Products Revenue (USD Million) By Country (2021-2032)
Table 16 Middle East and Africa Coconut Products Revenue (USD Million) By Region (2021-2032)
Table 17 North America Coconut Products Revenue (USD Million) By Type (2021-2032)
Table 18 North America Coconut Products Revenue (USD Million) By Application (2021-2032)
Table 19 North America Coconut Products Revenue (USD Million) By Product (2021-2032)
Table 20 Europe Coconut Products Revenue (USD Million) By Type (2021-2032)
Table 21 Europe Coconut Products Revenue (USD Million) By Application (2021-2032)
Table 22 Europe Coconut Products Revenue (USD Million) By Product (2021-2032)
Table 23 Asia Pacific Coconut Products Revenue (USD Million) By Type (2021-2032)
Table 24 Asia Pacific Coconut Products Revenue (USD Million) By Application (2021-2032)
Table 25 Asia Pacific Coconut Products Revenue (USD Million) By Product (2021-2032)
Table 26 South America Coconut Products Revenue (USD Million) By Type (2021-2032)
Table 27 South America Coconut Products Revenue (USD Million) By Application (2021-2032)
Table 28 South America Coconut Products Revenue (USD Million) By Product (2021-2032)
Table 29 Middle East and Africa Coconut Products Revenue (USD Million) By Type (2021-2032)
Table 30 Middle East and Africa Coconut Products Revenue (USD Million) By Application (2021-2032)
Table 31 Middle East and Africa Coconut Products Revenue (USD Million) By Product (2021-2032)
LIST OF FIGURES
Figure 1. Market Scope
Figure 2. Pricing Forecasts Per Unit, 2023- 2032
Figure 3. Porter’s Five Forces
Figure 4. Global Coconut Products Market Revenue (USD Million) By Regions (2021-2032)
Figure 5. Global Coconut Products Market Share (%) By Regions (2023)
Figure 6. North America Coconut Products Revenue (USD Million) By Country (2021-2032)
Figure 7. United States Coconut Products Revenue (USD Million) By Country (2021-2032)
Figure 8. Canada Coconut Products Revenue (USD Million) By Country (2021-2032)
Figure 9. Mexico Coconut Products Revenue (USD Million) By Country (2021-2032)
Figure 10. Europe Coconut Products Revenue (USD Million) By Country (2021-2032)
Figure 11. Germany Coconut Products Revenue (USD Million) By Country (2021-2032)
Figure 12. France Coconut Products Revenue (USD Million) By Country (2021-2032)
Figure 13. United Kingdom Coconut Products Revenue (USD Million) By Country (2021-2032)
Figure 14. Spain Coconut Products Revenue (USD Million) By Country (2021-2032)
Figure 15. Italy Coconut Products Revenue (USD Million) By Country (2021-2032)
Figure 16. Russia Coconut Products Revenue (USD Million) By Country (2021-2032)
Figure 17. Rest of Europe Coconut Products Revenue (USD Million) By Country (2021-2032)
Figure 11. Asia Pacific Coconut Products Revenue (USD Million) By Country (2021-2032)
Figure 12. China Coconut Products Revenue (USD Million) By Country (2021-2032)
Figure 13. Japan Coconut Products Revenue (USD Million) By Country (2021-2032)
Figure 14. India Coconut Products Revenue (USD Million) By Country (2021-2032)
Figure 15. South Korea Coconut Products Revenue (USD Million) By Country (2021-2032)
Figure 16. Australia Coconut Products Revenue (USD Million) By Country (2021-2032)
Figure 17. South East Asia Coconut Products Revenue (USD Million) By Country (2021-2032)
Figure 18. South America Coconut Products Revenue (USD Million) By Country (2021-2032)
Figure 19. Brazil Coconut Products Revenue (USD Million) By Country (2021-2032)
Figure 20. Argentina Coconut Products Revenue (USD Million) By Country (2021-2032)
Figure 21. Rest of Asia Pacific Coconut Products Revenue (USD Million) By Country (2021-2032)
Figure 22. Middle East and Africa Coconut Products Revenue (USD Million) By Region (2021-2032)
Figure 23. Saudi Arabia Coconut Products Revenue (USD Million) By Region (2021-2032)
Figure 24. The UAE Coconut Products Revenue (USD Million) By Region (2021-2032)
Figure 25. Rest of Middle East Coconut Products Revenue (USD Million) By Region (2021-2032)
Figure 26. South Africa Coconut Products Revenue (USD Million) By Region (2021-2032)
Figure 27. Africa Coconut Products Revenue (USD Million) By Region (2021-2032)
Figure 28. North America Coconut Products Revenue (USD Million) By Type (2021-2032)
Figure 29. North America Coconut Products Revenue (USD Million) By Application (2021-2032)
Figure 30. North America Coconut Products Revenue (USD Million) By Product (2021-2032)
Figure 31. Europe Coconut Products Revenue (USD Million) By Type (2021-2032)
Figure 32. Europe Coconut Products Revenue (USD Million) By Application (2021-2032)
Figure 33. Europe Coconut Products Revenue (USD Million) By Product (2021-2032)
Figure 34. Asia Pacific Coconut Products Revenue (USD Million) By Type (2021-2032)
Figure 35. Asia Pacific Coconut Products Revenue (USD Million) By Application (2021-2032)
Figure 36. Asia Pacific Coconut Products Revenue (USD Million) By Product (2021-2032)
Figure 37. South America Coconut Products Revenue (USD Million) By Type (2021-2032)
Figure 38. South America Coconut Products Revenue (USD Million) By Application (2021-2032)
Figure 39. South America Coconut Products Revenue (USD Million) By Product (2021-2032)
Figure 40. Middle East and Africa Coconut Products Revenue (USD Million) By Type (2021-2032)
Figure 41. Middle East and Africa Coconut Products Revenue (USD Million) By Application (2021-2032)
Figure 42. Middle East and Africa Coconut Products Revenue (USD Million) By Product (2021-2032)
By Product
Coconut Oil
Coconut Water
Coconut Milk/Cream
Others
By Application
Cosmetics
Food & Beverage
Others
Countries Analyzed
North America (US, Canada, Mexico)
Europe (Germany, UK, France, Spain, Italy, Russia, Rest of Europe)
Asia Pacific (China, India, Japan, South Korea, Australia, South East Asia, Rest of Asia)
South America (Brazil, Argentina, Rest of South America)
Middle East and Africa (Saudi Arabia, UAE, Rest of Middle East, South Africa, Egypt, Rest of Africa)
