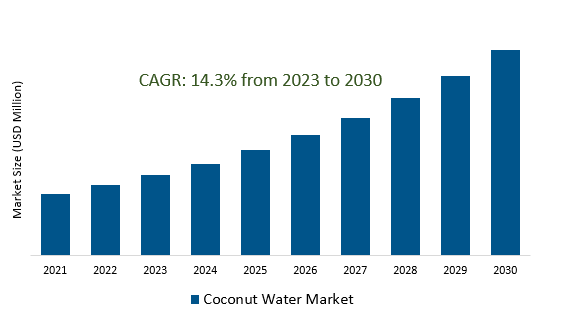
The Coconut Water Market Size is estimated to register 14.3% growth over the forecast period from 2023 to 2030.
The Coconut Water Market Overview
Shifting consumer preferences towards healthier beverage choices is the major factor. This growth is propelled by heightened health and wellness awareness, marketing emphasizing its nutritional benefits, and its association with an active lifestyle, buoyed by endorsements from celebrities and influencers. Brands are investing in eco-friendly packaging solutions, such as recyclable or biodegradable materials, to reduce the environmental impact of packaging and attract environmentally conscious consumers. Its availability through multiple distribution channels such as supermarkets, convenience stores, online retail platforms, and specialized health stores are driving the market growth. Additionally, increased urbanization, diversified product offerings, and a rising demand for plant-based, sustainable, and ethically sourced products are propelling the market growth.
The Coconut Water Market Dynamics
Market Trends- Product Diversification and Innovation in Coconut Water Market.
Companies are continually introducing new and innovative flavors such as pineapple, mango, passion fruit, and combinations with other fruits, thus gaining popularity and expanding the market reach beyond traditional coconut water.
Additionally, Brands are focusing on creating value-added coconut water products by incorporating functional elements such as added vitamins, minerals, antioxidants, and electrolytes.
Further, incorporating functional ingredients like probiotics, collagen, adaptogens, or plant-based proteins into coconut water formulations are highly driving the market growth.
Market Driver- Growing popularity of exotic and tropical flavors drives Coconut Water Market
Evolving consumer tastes and preferences are inclining towards diverse and unique flavor experiences. Association with natural and fresh tastes are driving the market growth.
Globalization is exposing consumers to a multitude of international flavors, allowing companies to incorporate these diverse tastes, thereby appealing to multicultural preferences leading to market growth.
Further, Seasonal, or trend-based offerings capitalize on these fluctuations, creating urgency and driving the market.
Market Opportunity- Introduction of Blending with Functional Ingredients in Coconut Water Market
Growing emphasis on health and wellness, driving consumers to seek functional beverages that offer more than just hydration. Further, prioritization of health and seeking beverages that offer holistic wellness benefits are fueling the demand.
Brands are responding by incorporating functional elements like vitamins, minerals, electrolytes, and antioxidants into coconut water, appealing to health-conscious consumers seeking added benefits.
By blending coconut water with functional ingredients such as probiotics, collagen, adaptogens, or plant-based proteins, companies are creating beverages that offer health benefits, rising the market growth.
Market Share Analysis- Tetra Pack will register the fastest growth.
The Coconut Water Market is analyzed across Packaging, Tetra Pack, Plastic Bottle & Others. Tetra Pack is poised to register the fastest growth. These Tetra Pak containers are known for their eco-friendly nature, being predominantly made from paperboard, a renewable resource, with a lower environmental impact compared to some other packaging materials. This type of packaging ensures the preservation of the freshness and natural qualities of coconut water, maintaining its taste and nutritional benefits over time. It’s convenient and lightweight design makes it easily portable, catering to the on-the-go lifestyle of consumers seeking healthy and hydrating beverages. Moreover, the Tetra Pack's durability and ability to shield the product from external factors contribute to its appeal. Its widespread adoption reflects the industry's commitment to offering consumers not only high-quality coconut water, but also sustainable packaging solutions aligned with growing environmental consciousness among consumers.
Market Share Analysis- Flavored Coconut Water held a significant market share in 2023.
The Coconut Water Market is analyzed across various Flavors including Plain Coconut Water & Flavored Coconut Water. Of these, Flavored Coconut Water held a significant market share in 2023. This variant offers a spectrum of flavors, ranging from familiar tropical fruits like pineapple, mango, and passion fruit to more innovative blends. The appeal of flavored coconut water lies in its ability to provide a refreshing and diverse taste experience while retaining the inherent health benefits associated with coconut water. These flavored options cater to a broader consumer base, attracting not only those seeking hydration but also individuals desiring a more enjoyable drinking experience. Additionally, the introduction of flavored variants are playing a pivotal role in expanding the market by appealing to consumers looking for more variety and novelty in their beverage choices.
Coconut Water Market Segmentation
By Type
- Packaging
- Tetra Pack
- Plastic Bottle
- Others
By Flavor
- Plain Coconut Water
- Flavored Coconut Water
By Distribution Channel
By Region
- North America (United States, Canada, Mexico)
- Europe (Germany, France, United Kingdom, Spain, Italy, Others)
- Asia Pacific (China, India, Japan, South Korea, Australia, Others)
- Latin America (Brazil, Argentina, Others)
- Middle East and Africa (Saudi Arabia, UAE, Kuwait, Other Middle East, South Africa, Nigeria, Other Africa)
Coconut Water Market Companies
- All Market Inc
- Naked Juice Company
- New Age Beverages Corporation
- Celebes Coconut Corporation
- Elegance Brands Inc
- Vaivai SAS
- Elegance Brands Inc
- C2O Pure Coconut Water LLC
- PepsiCo (O.N.E. Coconut Water)
- The Coca-Cola Company (ZICO)
- Harmless Harvest
- COCOZIA
*List not exhaustive
Coconut Water Market Outlook 2023
1 Market Overview
1.1 Introduction to the Coconut Water Market
1.2 Scope of the Study
1.3 Research Objective
1.3.1 Key Market Scope and Segments
1.3.2 Players Covered
1.3.3 Years Considered
2 Executive Summary
2.1 2023 Coconut Water Industry- Market Statistics
3 Market Dynamics
3.1 Market Drivers
3.2 Market Challenges
3.3 Market Opportunities
3.4 Market Trends
4 Market Factor Analysis
4.1 Porter’s Five Forces
4.2 Market Entropy
4.2.1 Global Coconut Water Market Companies with Area Served
4.2.2 Products Offerings Global Coconut Water Market
5 COVID-19 Impact Analysis and Outlook Scenarios
5.1.1 Covid-19 Impact Analysis
5.1.2 post-COVID-19 Scenario- Low Growth Case
5.1.3 post-COVID-19 Scenario- Reference Growth Case
5.1.4 post-COVID-19 Scenario- Low Growth Case
6 Global Coconut Water Market Trends
6.1 Global Coconut Water Revenue (USD Million) and CAGR (%) by Type (2018-2030)
6.2 Global Coconut Water Revenue (USD Million) and CAGR (%) by Applications (2018-2030)
6.3 Global Coconut Water Revenue (USD Million) and CAGR (%) by regions (2018-2030)
7 Global Coconut Water Market Revenue (USD Million) by Type, and Applications (2018-2022)
7.1 Global Coconut Water Revenue (USD Million) by Type (2018-2022)
7.1.1 Global Coconut Water Revenue (USD Million), Market Share (%) by Type (2018-2022)
7.2 Global Coconut Water Revenue (USD Million) by Applications (2018-2022)
7.2.1 Global Coconut Water Revenue (USD Million), Market Share (%) by Applications (2018-2022)
8 Global Coconut Water Development Regional Status and Outlook
8.1 Global Coconut Water Revenue (USD Million) By Regions (2018-2022)
8.2 North America Coconut Water Revenue (USD Million) by Type, and Application (2018-2022)
8.2.1 North America Coconut Water Revenue (USD Million) by Country (2018-2022)
8.2.2 North America Coconut Water Revenue (USD Million) by Type (2018-2022)
8.2.3 North America Coconut Water Revenue (USD Million) by Applications (2018-2022)
8.3 Europe Coconut Water Revenue (USD Million), by Type, and Applications (USD Million) (2018-2022)
8.3.1 Europe Coconut Water Revenue (USD Million), by Country (2018-2022)
8.3.2 Europe Coconut Water Revenue (USD Million) by Type (2018-2022)
8.3.3 Europe Coconut Water Revenue (USD Million) by Applications (2018-2022)
8.4 Asia Pacific Coconut Water Revenue (USD Million), and Revenue (USD Million) by Type, and Applications (2018-2022)
8.4.1 Asia Pacific Coconut Water Revenue (USD Million) by Country (2018-2022)
8.4.2 Asia Pacific Coconut Water Revenue (USD Million) by Type (2018-2022)
8.4.3 Asia Pacific Coconut Water Revenue (USD Million) by Applications (2018-2022)
8.5 South America Coconut Water Revenue (USD Million), by Type, and Applications (2018-2022)
8.5.1 South America Coconut Water Revenue (USD Million), by Country (2018-2022)
8.5.2 South America Coconut Water Revenue (USD Million) by Type (2018-2022)
8.5.3 South America Coconut Water Revenue (USD Million) by Applications (2018-2022)
8.6 Middle East and Africa Coconut Water Revenue (USD Million), by Type, Technology, Application, Thickness (2018-2022)
8.6.1 Middle East and Africa Coconut Water Revenue (USD Million) by Country (2018-2022)
8.6.2 Middle East and Africa Coconut Water Revenue (USD Million) by Type (2018-2022)
8.6.3 Middle East and Africa Coconut Water Revenue (USD Million) by Applications (2018-2022)
9 Company Profiles
10 Global Coconut Water Market Revenue (USD Million), by Type, and Applications (2023-2030)
10.1 Global Coconut Water Revenue (USD Million) and Market Share (%) by Type (2023-2030)
10.1.1 Global Coconut Water Revenue (USD Million), and Market Share (%) by Type (2023-2030)
10.2 Global Coconut Water Revenue (USD Million) and Market Share (%) by Applications (2023-2030)
10.2.1 Global Coconut Water Revenue (USD Million), and Market Share (%) by Applications (2023-2030)
11 Global Coconut Water Development Regional Status and Outlook Forecast
11.1 Global Coconut Water Revenue (USD Million) By Regions (2023-2030)
11.2 North America Coconut Water Revenue (USD Million) by Type, and Applications (2023-2030)
11.2.1 North America Coconut Water Revenue (USD) Million by Country (2023-2030)
11.2.2 North America Coconut Water Revenue (USD Million), by Type (2023-2030)
11.2.3 North America Coconut Water Revenue (USD Million), Market Share (%) by Applications (2023-2030)
11.3 Europe Coconut Water Revenue (USD Million), by Type, and Applications (2023-2030)
11.3.1 Europe Coconut Water Revenue (USD Million), by Country (2023-2030)
11.3.2 Europe Coconut Water Revenue (USD Million), by Type (2023-2030)
11.3.3 Europe Coconut Water Revenue (USD Million), by Applications (2023-2030)
11.4 Asia Pacific Coconut Water Revenue (USD Million) by Type, and Applications (2023-2030)
11.4.1 Asia Pacific Coconut Water Revenue (USD Million), by Country (2023-2030)
11.4.2 Asia Pacific Coconut Water Revenue (USD Million), by Type (2023-2030)
11.4.3 Asia Pacific Coconut Water Revenue (USD Million), by Applications (2023-2030)
11.5 South America Coconut Water Revenue (USD Million), by Type, and Applications (2023-2030)
11.5.1 South America Coconut Water Revenue (USD Million), by Country (2023-2030)
11.5.2 South America Coconut Water Revenue (USD Million), by Type (2023-2030)
11.5.3 South America Coconut Water Revenue (USD Million), by Applications (2023-2030)
11.6 Middle East and Africa Coconut Water Revenue (USD Million), by Type, and Applications (2023-2030)
11.6.1 Middle East and Africa Coconut Water Revenue (USD Million), by region (2023-2030)
11.6.2 Middle East and Africa Coconut Water Revenue (USD Million), by Type (2023-2030)
11.6.3 Middle East and Africa Coconut Water Revenue (USD Million), by Applications (2023-2030)
12 Methodology and Data Sources
12.1 Methodology/Research Approach
12.1.1 Research Programs/Design
12.1.2 Market Size Estimation
12.1.3 Market Breakdown and Data Triangulation
12.2 Data Sources
12.2.1 Secondary Sources
12.2.2 Primary Sources
12.3 Disclaimer
List of Tables
Table 1 Market Segmentation Analysis
Table 2 Global Coconut Water Market Companies with Areas Served
Table 3 Products Offerings Global Coconut Water Market
Table 4 Low Growth Scenario Forecasts
Table 5 Reference Case Growth Scenario
Table 6 High Growth Case Scenario
Table 7 Global Coconut Water Revenue (USD Million) And CAGR (%) By Type (2018-2030)
Table 8 Global Coconut Water Revenue (USD Million) And CAGR (%) By Applications (2018-2030)
Table 9 Global Coconut Water Revenue (USD Million) And CAGR (%) By Regions (2018-2030)
Table 10 Global Coconut Water Revenue (USD Million) By Type (2018-2022)
Table 11 Global Coconut Water Revenue Market Share (%) By Type (2018-2022)
Table 12 Global Coconut Water Revenue (USD Million) By Applications (2018-2022)
Table 13 Global Coconut Water Revenue Market Share (%) By Applications (2018-2022)
Table 14 Global Coconut Water Market Revenue (USD Million) By Regions (2018-2022)
Table 15 Global Coconut Water Market Share (%) By Regions (2018-2022)
Table 16 North America Coconut Water Revenue (USD Million) By Country (2018-2022)
Table 17 North America Coconut Water Revenue (USD Million) By Type (2018-2022)
Table 18 North America Coconut Water Revenue (USD Million) By Applications (2018-2022)
Table 19 Europe Coconut Water Revenue (USD Million) By Country (2018-2022)
Table 20 Europe Coconut Water Revenue (USD Million) By Type (2018-2022)
Table 21 Europe Coconut Water Revenue (USD Million) By Applications (2018-2022)
Table 22 Asia Pacific Coconut Water Revenue (USD Million) By Country (2018-2022)
Table 23 Asia Pacific Coconut Water Revenue (USD Million) By Type (2018-2022)
Table 24 Asia Pacific Coconut Water Revenue (USD Million) By Applications (2018-2022)
Table 25 South America Coconut Water Revenue (USD Million) By Country (2018-2022)
Table 26 South America Coconut Water Revenue (USD Million) By Type (2018-2022)
Table 27 South America Coconut Water Revenue (USD Million) By Applications (2018-2022)
Table 28 Middle East and Africa Coconut Water Revenue (USD Million) By Region (2018-2022)
Table 29 Middle East and Africa Coconut Water Revenue (USD Million) By Type (2018-2022)
Table 30 Middle East and Africa Coconut Water Revenue (USD Million) By Applications (2018-2022)
Table 31 Financial Analysis
Table 32 Global Coconut Water Revenue (USD Million) By Type (2023-2030)
Table 33 Global Coconut Water Revenue Market Share (%) By Type (2023-2030)
Table 34 Global Coconut Water Revenue (USD Million) By Applications (2023-2030)
Table 35 Global Coconut Water Revenue Market Share (%) By Applications (2023-2030)
Table 36 Global Coconut Water Market Revenue (USD Million), And Revenue (USD Million) By Regions (2023-2030)
Table 37 North America Coconut Water Revenue (USD)By Country (2023-2030)
Table 38 North America Coconut Water Revenue (USD Million) By Type (2023-2030)
Table 39 North America Coconut Water Revenue (USD Million) By Applications (2023-2030)
Table 40 Europe Coconut Water Revenue (USD Million) By Country (2023-2030)
Table 41 Europe Coconut Water Revenue (USD Million) By Type (2023-2030)
Table 42 Europe Coconut Water Revenue (USD Million) By Applications (2023-2030)
Table 43 Asia Pacific Coconut Water Revenue (USD Million) By Country (2023-2030)
Table 44 Asia Pacific Coconut Water Revenue (USD Million) By Type (2023-2030)
Table 45 Asia Pacific Coconut Water Revenue (USD Million) By Applications (2023-2030)
Table 46 South America Coconut Water Revenue (USD Million) By Country (2023-2030)
Table 47 South America Coconut Water Revenue (USD Million) By Type (2023-2030)
Table 48 South America Coconut Water Revenue (USD Million) By Applications (2023-2030)
Table 49 Middle East and Africa Coconut Water Revenue (USD Million) By Region (2023-2030)
Table 50 Middle East and Africa Coconut Water Revenue (USD Million) By Region (2023-2030)
Table 51 Middle East and Africa Coconut Water Revenue (USD Million) By Type (2023-2030)
Table 52 Middle East and Africa Coconut Water Revenue (USD Million) By Applications (2023-2030)
Table 53 Research Programs/Design for This Report
Table 54 Key Data Information from Secondary Sources
Table 55 Key Data Information from Primary Sources
List of Figures
Figure 1 Market Scope
Figure 2 Porter’s Five Forces
Figure 3 Global Coconut Water Revenue (USD Million) By Type (2018-2022)
Figure 4 Global Coconut Water Revenue Market Share (%) By Type (2022)
Figure 5 Global Coconut Water Revenue (USD Million) By Applications (2018-2022)
Figure 6 Global Coconut Water Revenue Market Share (%) By Applications (2022)
Figure 7 Global Coconut Water Market Revenue (USD Million) By Regions (2018-2022)
Figure 8 Global Coconut Water Market Share (%) By Regions (2022)
Figure 9 North America Coconut Water Revenue (USD Million) By Country (2018-2022)
Figure 10 North America Coconut Water Revenue (USD Million) By Type (2018-2022)
Figure 11 North America Coconut Water Revenue (USD Million) By Applications (2018-2022)
Figure 12 Europe Coconut Water Revenue (USD Million) By Country (2018-2022)
Figure 13 Europe Coconut Water Revenue (USD Million) By Type (2018-2022)
Figure 14 Europe Coconut Water Revenue (USD Million) By Applications (2018-2022)
Figure 15 Asia Pacific Coconut Water Revenue (USD Million) By Country (2018-2022)
Figure 16 Asia Pacific Coconut Water Revenue (USD Million) By Type (2018-2022)
Figure 17 Asia Pacific Coconut Water Revenue (USD Million) By Applications (2018-2022)
Figure 18 South America Coconut Water Revenue (USD Million) By Country (2018-2022)
Figure 19 South America Coconut Water Revenue (USD Million) By Type (2018-2022)
Figure 20 South America Coconut Water Revenue (USD Million) By Applications (2018-2022)
Figure 21 Middle East and Africa Coconut Water Revenue (USD Million) By Region (2018-2022)
Figure 22 Middle East and Africa Coconut Water Revenue (USD Million) By Type (2018-2022)
Figure 23 Middle East and Africa Coconut Water Revenue (USD Million) By Applications (2018-2022)
Figure 24 Global Coconut Water Revenue (USD Million) By Type (2023-2030)
Figure 25 Global Coconut Water Revenue Market Share (%) By Type (2030)
Figure 26 Global Coconut Water Revenue (USD Million) By Applications (2023-2030)
Figure 27 Global Coconut Water Revenue Market Share (%) By Applications (2030)
Figure 28 Global Coconut Water Market Revenue (USD Million) By Regions (2023-2030)
Figure 29 North America Coconut Water Revenue (USD Million) By Country (2023-2030)
Figure 30 North America Coconut Water Revenue (USD Million) By Type (2023-2030)
Figure 31 North America Coconut Water Revenue (USD Million) By Applications (2023-2030)
Figure 32 Europe Coconut Water Revenue (USD Million) By Country (2023-2030)
Figure 33 Europe Coconut Water Revenue (USD Million) By Type (2023-2030)
Figure 34 Europe Coconut Water Revenue (USD Million) By Applications (2023-2030)
Figure 35 Asia Pacific Coconut Water Revenue (USD Million) By Country (2023-2030)
Figure 36 Asia Pacific Coconut Water Revenue (USD Million) By Type (2023-2030)
Figure 37 Asia Pacific Coconut Water Revenue (USD Million) By Applications (2023-2030)
Figure 38 South America Coconut Water Revenue (USD Million) By Country (2023-2030)
Figure 39 South America Coconut Water Revenue (USD Million) By Type (2023-2030)
Figure 40 South America Coconut Water Revenue (USD Million) By Applications (2023-2030)
Figure 41 Middle East and Africa Coconut Water Revenue (USD Million) By Region (2023-2030)
Figure 42 Middle East and Africa Coconut Water Revenue (USD Million) By Region (2023-2030)
Figure 43 Middle East and Africa Coconut Water Revenue (USD Million) By Type (2023-2030)
Figure 44 Middle East and Africa Coconut Water Revenue (USD Million) By Applications (2023-2030)
Figure 45 Bottom-Up and Top-Down Approaches for This Report
Figure 46 Data Triangulation
