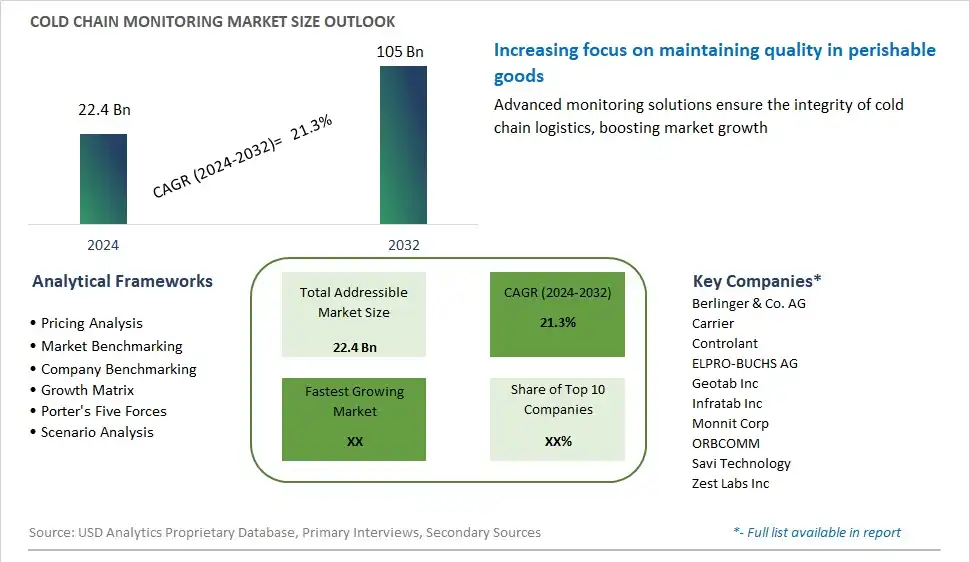
Global Cold Chain Monitoring Market Size is valued at $22.4 Billion in 2024 and is forecast to register a growth rate (CAGR) of 21.3% to reach $105 Billion by 2032.
The global Cold Chain Monitoring Market Comprehensive Study analyzes and forecasts the market size across 6 regions and 24 countries for diverse segments -By Component (Hardware, Software), By Application (Food & Beverages, Pharmaceuticals, Vaccines, Blood Banking, Others)
An Introduction to Cold Chain Monitoring Market
Cold chain monitoring involves the use of technology and systems to track and monitor temperature-sensitive products throughout the supply chain in 2024. This includes perishable goods such as food, pharmaceuticals, and vaccines that require strict temperature control to maintain their quality and safety. Cold chain monitoring systems utilize sensors, data loggers, and real-time monitoring devices to continuously measure and record temperature conditions during storage, transportation, and distribution. These systems provide real-time alerts and notifications to stakeholders if temperature deviations occur, allowing for immediate corrective actions to be taken to prevent product spoilage or loss. With the increasing complexity of supply chains, globalization of trade, and regulatory requirements for product safety and quality, the demand for cold chain monitoring solutions is growing. Companies are investing in advanced monitoring technologies, data analytics, and cloud-based platforms to enhance visibility, transparency, and compliance across the cold chain while ensuring the integrity and safety of temperature-sensitive products.
Cold Chain Monitoring Competitive Landscape
The market report analyses the leading companies in the industry including Berlinger & Co. AG, Carrier, Controlant, ELPRO-BUCHS AG, Geotab Inc, Infratab Inc, Monnit Corp, ORBCOMM, Savi Technology, Zest Labs Inc, and Others.
Cold Chain Monitoring Market Dynamics
Cold Chain Monitoring Market Trend: Increasing Stringency of Regulatory Requirements
The cold chain monitoring market is experiencing a prominent trend driven by the increasing stringency of regulatory requirements governing the transportation and storage of temperature-sensitive products. Regulatory agencies such as the FDA and EMA impose strict guidelines and standards for maintaining the integrity of perishable goods throughout the cold chain, particularly in industries such as pharmaceuticals, biotechnology, and food safety. As regulatory scrutiny intensifies and product safety becomes a paramount concern, businesses are compelled to implement robust cold chain monitoring solutions to ensure compliance with regulatory mandates and safeguard product quality and efficacy. This trend is further reinforced by the globalization of trade, the proliferation of biopharmaceuticals, and the growing complexity of supply chains, necessitating real-time monitoring and visibility of temperature-sensitive cargo to prevent costly product losses, recalls, and regulatory penalties. As a result, the demand for advanced cold chain monitoring technologies and solutions continues to rise, driving market growth and innovation in the global cold chain monitoring industry.
Market Driver: Growth of Pharmaceutical and Biotechnology Industries
A significant driver of the cold chain monitoring market is the rapid growth of the pharmaceutical and biotechnology industries, which rely heavily on temperature-controlled logistics to maintain the integrity and efficacy of life-saving drugs, vaccines, and biologics. The pharmaceutical supply chain is characterized by the increasing complexity of drug products, stringent regulatory requirements, and the need for end-to-end visibility and traceability of temperature-sensitive shipments. With the rise of personalized medicine, biopharmaceuticals, and specialty drugs, there is a growing demand for precise temperature monitoring and control throughout the cold chain to ensure product stability and compliance with regulatory standards. Additionally, the global distribution of vaccines, particularly in light of the COVID-19 pandemic, underscores the importance of cold chain monitoring in preserving vaccine potency and efficacy during storage and transportation. The expansion of pharmaceutical manufacturing, clinical trials, and biotechnology research further drives the adoption of cold chain monitoring solutions, presenting lucrative opportunities for providers of temperature monitoring devices, data loggers, and remote monitoring platforms.
Market Opportunity: Adoption of IoT and Cloud-Based Monitoring Solutions
An opportunity for the cold chain monitoring market lies in the adoption of IoT (Internet of Things) and cloud-based monitoring solutions to enhance real-time visibility, analytics, and decision-making capabilities across the cold chain supply chain. IoT-enabled temperature sensors, data loggers, and monitoring devices can be deployed throughout the cold chain infrastructure to collect and transmit critical data on temperature, humidity, location, and other environmental parameters in real-time. Cloud-based platforms offer centralized data storage, analysis, and reporting functionalities, allowing stakeholders to access actionable insights, track shipment status, and respond to temperature deviations promptly. Additionally, advanced analytics, machine learning, and predictive modeling algorithms can leverage the vast amounts of data generated by IoT devices to predict and prevent temperature excursions, optimize route planning, and improve operational efficiency. By embracing IoT and cloud-based technologies, cold chain monitoring providers can offer scalable, cost-effective solutions that enhance supply chain visibility, reduce risk, and ensure the integrity of temperature-sensitive products from production to distribution, unlocking new opportunities for market growth and differentiation in the evolving cold chain monitoring landscape.
Cold Chain Monitoring Market Share Analysis: Hardware Component held the dominant market share in 2024
The hardware component segment is the largest in the Cold Chain Monitoring market due to its essential role in providing real-time monitoring and tracking of temperature-sensitive products throughout the supply chain. Hardware components such as sensors, RFID devices, telematics systems, and networking devices are instrumental in capturing critical data points such as temperature, humidity, location, and condition of goods during storage and transportation. These devices are integrated into cold chain infrastructure, storage facilities, and transportation vehicles to ensure continuous monitoring and alerting of any deviations from specified temperature ranges. Further, the increasing regulatory requirements and quality standards governing the transportation and storage of perishable goods mandate the use of advanced hardware solutions to maintain product integrity and compliance. Additionally, advancements in sensor technology, IoT connectivity, and data analytics enhance the efficiency and accuracy of cold chain monitoring systems, further driving the adoption of hardware components in the market. With its indispensable role in ensuring product quality, safety, and regulatory compliance, the hardware component segment maintains its dominance in the Cold Chain Monitoring market.
Cold Chain Monitoring Market Share Analysis: Pharmaceuticals Segment market is poised to register the fastest growth rae over the forecast period to 2032
The pharmaceuticals segment is the fastest-growing segment in the Cold Chain Monitoring market due to the increasing demand for temperature-sensitive pharmaceutical products, vaccines, and biologics worldwide. The stringent regulatory requirements and quality standards governing the storage and transportation of pharmaceuticals mandate the implementation of robust cold chain monitoring solutions to ensure product integrity and compliance. Additionally, the rise in global healthcare expenditure, expansion of pharmaceutical manufacturing capabilities, and the growing emphasis on immunization programs contribute to the increasing demand for cold chain monitoring systems in the pharmaceutical sector. Further, advancements in biopharmaceutical research and development, coupled with the introduction of new temperature-sensitive medications and biologics, further drive the adoption of cold chain monitoring solutions to safeguard product efficacy and patient safety. With its critical role in maintaining the quality and efficacy of pharmaceutical products, the pharmaceuticals segment experiences rapid growth, positioning it as a key driver of expansion in the Cold Chain Monitoring market.
Cold Chain Monitoring Market Segmentation
By Component
Hardware
-Sensors
-RFID Devices
-Telematics
-Networking Devices
-Others
Software
-On-premise
-Cloud-based
By Application
Food & Beverages
Pharmaceuticals
Vaccines
Blood Banking
Others
Countries Analyzed
North America (US, Canada, Mexico)
Europe (Germany, UK, France, Spain, Italy, Russia, Rest of Europe)
Asia Pacific (China, India, Japan, South Korea, Australia, South East Asia, Rest of Asia)
South America (Brazil, Argentina, Rest of South America)
Middle East and Africa (Saudi Arabia, UAE, Rest of Middle East, South Africa, Egypt, Rest of Africa)
Cold Chain Monitoring Companies Profiled in the Study
Berlinger & Co. AG
Carrier
Controlant
ELPRO-BUCHS AG
Geotab Inc
Infratab Inc
Monnit Corp
ORBCOMM
Savi Technology
Zest Labs Inc
*- List Not Exhaustive
Chapter 1. TABLE OF CONTENTS
Chapter 2. Introduction to Cold Chain Monitoring Market
2.1. Market Overview
2.2. Key Statistics and Report Highlights
2.3. Scope of the Comprehensive Study
2.3.1. Market Definition
2.3.2 Countries and Regions Covered
2.3.3 Research Objective
2.3.4 Units, Currency, and Conversions
2.3.5 Industry Value Chain
2.4. Key Market Segments
2.5. Key Companies
2.6. Study Period
Chapter 3. Strategic Analysis Review
3.1. Cold Chain Monitoring Pricing Analysis and Forecast
3.2. Porter’s Five Forces
3.3. Market Ecosystem
3.4. SWOT Analysis
3.5. Regulatory Scenario
3.3. Effects of Inflation, Russia-Ukraine War, moderating economic growth, and other macroeconomic factors
Chapter 4. Competitive Landscape
4.1. Market Share Analysis
4.1.1. Global Cold Chain Monitoring Market Share by Company, 2023
4.1.2. Product Offerings of Leading Cold Chain Monitoring Companies
4.2. Market Entropy
4.2.1. New Product Launches in the Industry
4.2.2. Mergers, Acquisitions, Joint ventures, and Partnerships
4.3. Key Strategies and Best Practices
Chapter 5. Global Market Projections: Best, Reference, and Low Case Scenarios
5.1. Growth Analysis- Case Scenario Definitions
5.2. Low Growth Case Scenario Forecasts
5.3. Reference Growth Case Scenario Forecasts
5.4. High Growth Case Scenario Forecasts
Chapter 6. Market Dynamics
6.1. Cold Chain Monitoring Market Drivers
6.2. Cold Chain Monitoring Market Challenges
6.6. Cold Chain Monitoring Market Opportunities
6.4. Cold Chain Monitoring Market Trends
Chapter 7. Global Cold Chain Monitoring Market Outlook Trends
7.1. Global Cold Chain Monitoring Revenue (USD Million) and CAGR (%) by Type (2021-2032)
7.2. Global Cold Chain Monitoring Revenue (USD Million) and CAGR (%) by Application (2021-2032)
7.3. Global Cold Chain Monitoring Revenue (USD Million) and CAGR (%) by Product (2021-2032)
By Component
Hardware
-Sensors
-RFID Devices
-Telematics
-Networking Devices
-Others
Software
-On-premise
-Cloud-based
By Application
Food & Beverages
Pharmaceuticals
Vaccines
Blood Banking
Others
Chapter 8. Global Cold Chain Monitoring Regional Analysis and Outlook
8.1. Global Cold Chain Monitoring Revenue (USD Million) By Regions (2021- 2032)
8.2. North America Cold Chain Monitoring Revenue (USD Million) by Country (2021-2032)
8.2.1. United States Cold Chain Monitoring Regional Analysis and Outlook
8.2.2. Canada Cold Chain Monitoring Regional Analysis and Outlook
8.2.3. Mexico Cold Chain Monitoring Regional Analysis and Outlook
8.3. Europe Cold Chain Monitoring Revenue (USD Million), by Country (2021-2032)
8.3.1. Germany Cold Chain Monitoring Regional Analysis and Outlook
8.3.2. France Cold Chain Monitoring Regional Analysis and Outlook
8.3.3. United Kingdom Cold Chain Monitoring Regional Analysis and Outlook
8.3.4. Spain Cold Chain Monitoring Regional Analysis and Outlook
8.3.5. Italy Cold Chain Monitoring Regional Analysis and Outlook
8.3.6. Russia Cold Chain Monitoring Regional Analysis and Outlook
8.3.7. Rest of Europe Cold Chain Monitoring Regional Analysis and Outlook
8.4. Asia Pacific Cold Chain Monitoring Revenue (USD Million) by Country (2021-2032)
8.4.1. China Cold Chain Monitoring Regional Analysis and Outlook
8.4.2. Japan Cold Chain Monitoring Regional Analysis and Outlook
8.4.3. India Cold Chain Monitoring Regional Analysis and Outlook
8.4.4. South Korea Cold Chain Monitoring Regional Analysis and Outlook
8.4.5. Australia Cold Chain Monitoring Regional Analysis and Outlook
8.4.6. South East Asia Cold Chain Monitoring Regional Analysis and Outlook
8.4.7. Rest of Asia Pacific Cold Chain Monitoring Regional Analysis and Outlook
8.5. South America Cold Chain Monitoring Revenue (USD Million), by Country (2021-2032)
8.5.1. Brazil Cold Chain Monitoring Regional Analysis and Outlook
8.5.2. Argentina Cold Chain Monitoring Regional Analysis and Outlook
8.5.3. Rest of South America Cold Chain Monitoring Regional Analysis and Outlook
8.6. Middle East and Africa Cold Chain Monitoring Revenue (USD Million) by Country (2021-2032)
8.6.1. Middle East Cold Chain Monitoring Regional Analysis and Outlook
8.6.2. Africa Cold Chain Monitoring Regional Analysis and Outlook
Chapter 9. North America Cold Chain Monitoring Analysis and Outlook
9.1. North America Cold Chain Monitoring Revenue (USD Million) by Segments (2021-2032)
9.1.1. North America Cold Chain Monitoring Revenue (USD Million) by Type (2021-2032)
9.1.2. North America Cold Chain Monitoring Revenue (USD Million) by Application (2021-2032)
9.1.3. North America Cold Chain Monitoring Revenue (USD Million) by Product (2021-2032)
By Component
Hardware
-Sensors
-RFID Devices
-Telematics
-Networking Devices
-Others
Software
-On-premise
-Cloud-based
By Application
Food & Beverages
Pharmaceuticals
Vaccines
Blood Banking
Others
Chapter 10. Europe Cold Chain Monitoring Analysis and Outlook
10.1. Europe Cold Chain Monitoring Revenue (USD Million), by Segments (USD Million) (2021-2032)
10.1.1. Europe Cold Chain Monitoring Revenue (USD Million) by Type (2021-2032)
10.1.2. Europe Cold Chain Monitoring Revenue (USD Million) by Application (2021-2032)
10.1.3. Europe Cold Chain Monitoring Revenue (USD Million) by Product (2021-2032)
By Component
Hardware
-Sensors
-RFID Devices
-Telematics
-Networking Devices
-Others
Software
-On-premise
-Cloud-based
By Application
Food & Beverages
Pharmaceuticals
Vaccines
Blood Banking
Others
Chapter 11. Asia Pacific Cold Chain Monitoring Analysis and Outlook
11.1. Asia Pacific Cold Chain Monitoring Revenue (USD Million), and Revenue (USD Million) by Segments (2021-2032)
11.1.1. Asia Pacific Cold Chain Monitoring Revenue (USD Million) by Type (2021-2032)
11.1.2. Asia Pacific Cold Chain Monitoring Revenue (USD Million) by Application (2021-2032)
11.1.3. Asia Pacific Cold Chain Monitoring Revenue (USD Million) by Product (2021-2032)
By Component
Hardware
-Sensors
-RFID Devices
-Telematics
-Networking Devices
-Others
Software
-On-premise
-Cloud-based
By Application
Food & Beverages
Pharmaceuticals
Vaccines
Blood Banking
Others
Chapter 12. South America Cold Chain Monitoring Analysis and Outlook
12.1. South America Cold Chain Monitoring Revenue (USD Million), by Segments (2021-2032)
12.1.1. South America Cold Chain Monitoring Revenue (USD Million) by Type (2021-2032)
12.1.2. South America Cold Chain Monitoring Revenue (USD Million) by Application (2021-2032)
12.1.3. South America Cold Chain Monitoring Revenue (USD Million) by Product (2021-2032)
By Component
Hardware
-Sensors
-RFID Devices
-Telematics
-Networking Devices
-Others
Software
-On-premise
-Cloud-based
By Application
Food & Beverages
Pharmaceuticals
Vaccines
Blood Banking
Others
Chapter 13. Middle East and Africa Cold Chain Monitoring Analysis and Outlook
13.1. Middle East and Africa Cold Chain Monitoring Revenue (USD Million), by Segments (2021-2032)
13.1.1. Middle East and Africa Cold Chain Monitoring Revenue (USD Million) by Type (2021-2032)
13.1.2. Middle East and Africa Cold Chain Monitoring Revenue (USD Million) by Application (2021-2032)
13.1.3. Middle East and Africa Cold Chain Monitoring Revenue (USD Million) by Product (2021-2032)
By Component
Hardware
-Sensors
-RFID Devices
-Telematics
-Networking Devices
-Others
Software
-On-premise
-Cloud-based
By Application
Food & Beverages
Pharmaceuticals
Vaccines
Blood Banking
Others
Chapter 14. Cold Chain Monitoring Company Profiles
14.1 Business Overview
14.2 Product Profiles
14.3 SWOT Profiles
14.5 Recent Developments
14.6 Financial Profile
List of Companies
Berlinger & Co. AG
Carrier
Controlant
ELPRO-BUCHS AG
Geotab Inc
Infratab Inc
Monnit Corp
ORBCOMM
Savi Technology
Zest Labs Inc
15. Methodology and Data Sources
15.1 Customization Offerings
15.2 Subscription Services
15.3 Related Reports
15.4 Publisher Expertise
LIST OF TABLES
Table 1 Market Segmentation Analysis
Table 2 Global Cold Chain Monitoring Market Share of Leading Companies, 2023
Table 3 Product Offerings of Leading Companies
Table 4 Low Growth Scenario Forecasts
Table 5 Reference Case Growth Scenario
Table 6 High Growth Case Scenario
Table 7 Global Cold Chain Monitoring Revenue (USD Million) And CAGR (%) By Type (2021-2032)
Table 8 Global Cold Chain Monitoring Revenue (USD Million) And CAGR (%) By Application (2021-2032)
Table 9 Global Cold Chain Monitoring Revenue (USD Million) And CAGR (%) By Product (2021-2032)
Table 10 Global Cold Chain Monitoring Market Revenue (USD Million) By Regions (2021-2032)
Table 11 Global Cold Chain Monitoring Market Share (%) By Regions (2021-2032)
Table 12 North America Cold Chain Monitoring Revenue (USD Million) By Country (2021-2032)
Table 13 Europe Cold Chain Monitoring Revenue (USD Million) By Country (2021-2032)
Table 14 Asia Pacific Cold Chain Monitoring Revenue (USD Million) By Country (2021-2032)
Table 15 South America Cold Chain Monitoring Revenue (USD Million) By Country (2021-2032)
Table 16 Middle East and Africa Cold Chain Monitoring Revenue (USD Million) By Region (2021-2032)
Table 17 North America Cold Chain Monitoring Revenue (USD Million) By Type (2021-2032)
Table 18 North America Cold Chain Monitoring Revenue (USD Million) By Application (2021-2032)
Table 19 North America Cold Chain Monitoring Revenue (USD Million) By Product (2021-2032)
Table 20 Europe Cold Chain Monitoring Revenue (USD Million) By Type (2021-2032)
Table 21 Europe Cold Chain Monitoring Revenue (USD Million) By Application (2021-2032)
Table 22 Europe Cold Chain Monitoring Revenue (USD Million) By Product (2021-2032)
Table 23 Asia Pacific Cold Chain Monitoring Revenue (USD Million) By Type (2021-2032)
Table 24 Asia Pacific Cold Chain Monitoring Revenue (USD Million) By Application (2021-2032)
Table 25 Asia Pacific Cold Chain Monitoring Revenue (USD Million) By Product (2021-2032)
Table 26 South America Cold Chain Monitoring Revenue (USD Million) By Type (2021-2032)
Table 27 South America Cold Chain Monitoring Revenue (USD Million) By Application (2021-2032)
Table 28 South America Cold Chain Monitoring Revenue (USD Million) By Product (2021-2032)
Table 29 Middle East and Africa Cold Chain Monitoring Revenue (USD Million) By Type (2021-2032)
Table 30 Middle East and Africa Cold Chain Monitoring Revenue (USD Million) By Application (2021-2032)
Table 31 Middle East and Africa Cold Chain Monitoring Revenue (USD Million) By Product (2021-2032)
LIST OF FIGURES
Figure 1. Market Scope
Figure 2. Pricing Forecasts Per Unit, 2023- 2032
Figure 3. Porter’s Five Forces
Figure 4. Global Cold Chain Monitoring Market Revenue (USD Million) By Regions (2021-2032)
Figure 5. Global Cold Chain Monitoring Market Share (%) By Regions (2023)
Figure 6. North America Cold Chain Monitoring Revenue (USD Million) By Country (2021-2032)
Figure 7. United States Cold Chain Monitoring Revenue (USD Million) By Country (2021-2032)
Figure 8. Canada Cold Chain Monitoring Revenue (USD Million) By Country (2021-2032)
Figure 9. Mexico Cold Chain Monitoring Revenue (USD Million) By Country (2021-2032)
Figure 10. Europe Cold Chain Monitoring Revenue (USD Million) By Country (2021-2032)
Figure 11. Germany Cold Chain Monitoring Revenue (USD Million) By Country (2021-2032)
Figure 12. France Cold Chain Monitoring Revenue (USD Million) By Country (2021-2032)
Figure 13. United Kingdom Cold Chain Monitoring Revenue (USD Million) By Country (2021-2032)
Figure 14. Spain Cold Chain Monitoring Revenue (USD Million) By Country (2021-2032)
Figure 15. Italy Cold Chain Monitoring Revenue (USD Million) By Country (2021-2032)
Figure 16. Russia Cold Chain Monitoring Revenue (USD Million) By Country (2021-2032)
Figure 17. Rest of Europe Cold Chain Monitoring Revenue (USD Million) By Country (2021-2032)
Figure 11. Asia Pacific Cold Chain Monitoring Revenue (USD Million) By Country (2021-2032)
Figure 12. China Cold Chain Monitoring Revenue (USD Million) By Country (2021-2032)
Figure 13. Japan Cold Chain Monitoring Revenue (USD Million) By Country (2021-2032)
Figure 14. India Cold Chain Monitoring Revenue (USD Million) By Country (2021-2032)
Figure 15. South Korea Cold Chain Monitoring Revenue (USD Million) By Country (2021-2032)
Figure 16. Australia Cold Chain Monitoring Revenue (USD Million) By Country (2021-2032)
Figure 17. South East Asia Cold Chain Monitoring Revenue (USD Million) By Country (2021-2032)
Figure 18. South America Cold Chain Monitoring Revenue (USD Million) By Country (2021-2032)
Figure 19. Brazil Cold Chain Monitoring Revenue (USD Million) By Country (2021-2032)
Figure 20. Argentina Cold Chain Monitoring Revenue (USD Million) By Country (2021-2032)
Figure 21. Rest of Asia Pacific Cold Chain Monitoring Revenue (USD Million) By Country (2021-2032)
Figure 22. Middle East and Africa Cold Chain Monitoring Revenue (USD Million) By Region (2021-2032)
Figure 23. Saudi Arabia Cold Chain Monitoring Revenue (USD Million) By Region (2021-2032)
Figure 24. The UAE Cold Chain Monitoring Revenue (USD Million) By Region (2021-2032)
Figure 25. Rest of Middle East Cold Chain Monitoring Revenue (USD Million) By Region (2021-2032)
Figure 26. South Africa Cold Chain Monitoring Revenue (USD Million) By Region (2021-2032)
Figure 27. Africa Cold Chain Monitoring Revenue (USD Million) By Region (2021-2032)
Figure 28. North America Cold Chain Monitoring Revenue (USD Million) By Type (2021-2032)
Figure 29. North America Cold Chain Monitoring Revenue (USD Million) By Application (2021-2032)
Figure 30. North America Cold Chain Monitoring Revenue (USD Million) By Product (2021-2032)
Figure 31. Europe Cold Chain Monitoring Revenue (USD Million) By Type (2021-2032)
Figure 32. Europe Cold Chain Monitoring Revenue (USD Million) By Application (2021-2032)
Figure 33. Europe Cold Chain Monitoring Revenue (USD Million) By Product (2021-2032)
Figure 34. Asia Pacific Cold Chain Monitoring Revenue (USD Million) By Type (2021-2032)
Figure 35. Asia Pacific Cold Chain Monitoring Revenue (USD Million) By Application (2021-2032)
Figure 36. Asia Pacific Cold Chain Monitoring Revenue (USD Million) By Product (2021-2032)
Figure 37. South America Cold Chain Monitoring Revenue (USD Million) By Type (2021-2032)
Figure 38. South America Cold Chain Monitoring Revenue (USD Million) By Application (2021-2032)
Figure 39. South America Cold Chain Monitoring Revenue (USD Million) By Product (2021-2032)
Figure 40. Middle East and Africa Cold Chain Monitoring Revenue (USD Million) By Type (2021-2032)
Figure 41. Middle East and Africa Cold Chain Monitoring Revenue (USD Million) By Application (2021-2032)
Figure 42. Middle East and Africa Cold Chain Monitoring Revenue (USD Million) By Product (2021-2032)
By Component
Hardware
-Sensors
-RFID Devices
-Telematics
-Networking Devices
-Others
Software
-On-premise
-Cloud-based
By Application
Food & Beverages
Pharmaceuticals
Vaccines
Blood Banking
Others
Countries Analyzed
North America (US, Canada, Mexico)
Europe (Germany, UK, France, Spain, Italy, Russia, Rest of Europe)
Asia Pacific (China, India, Japan, South Korea, Australia, South East Asia, Rest of Asia)
South America (Brazil, Argentina, Rest of South America)
Middle East and Africa (Saudi Arabia, UAE, Rest of Middle East, South Africa, Egypt, Rest of Africa)
