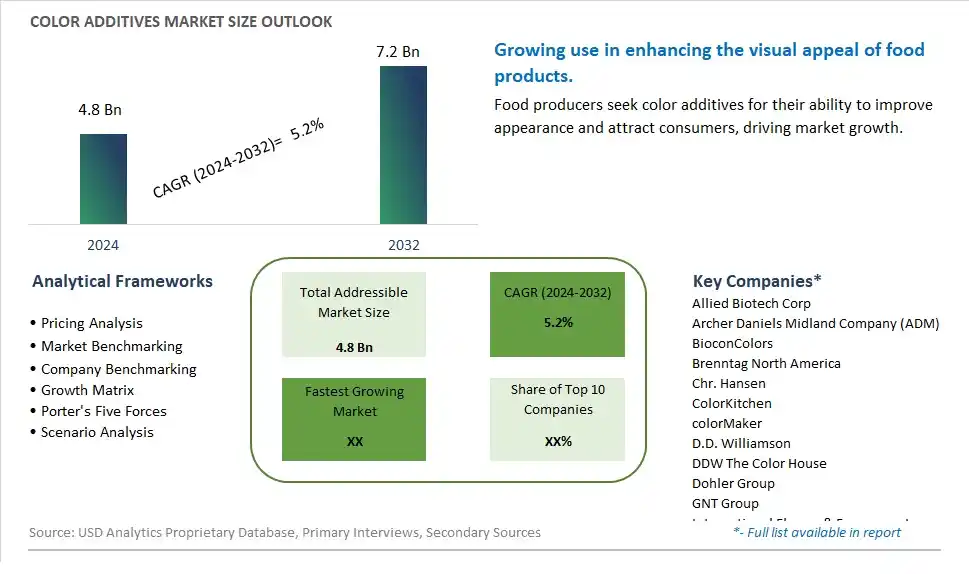
Global Color Additives Market Size is valued at $4.8 Billion in 2024 and is forecast to register a growth rate (CAGR) of 5.2% to reach $7.2 Billion by 2032.
The global Color Additives Market Comprehensive Study analyzes and forecasts the market size across 6 regions and 24 countries for diverse segments -By Type (Natural Colorants, Artificial Colorants), By Application (Food, Beverage)
An Introduction to Color Additives Market
The Color Additives market in 2024 is expanding rapidly, driven by the increasing demand for vibrant and appealing food, beverage, and cosmetic products. Color additives, including natural and synthetic options, are used to enhance the visual appeal of products. The market is supported by the growing trend towards clean-label and natural colorants. Advances in extraction and formulation technologies are enhancing the quality, stability, and safety of color additives. The market is also benefiting from the trend towards sustainable and eco-friendly ingredients, appealing to manufacturers and consumers seeking high-quality and responsible color solutions.
Color Additives Competitive Landscape
The market report analyses the leading companies in the industry including Allied Biotech Corp, Archer Daniels Midland Company (ADM), BioconColors, Brenntag North America, Chr. Hansen, ColorKitchen, colorMaker, D.D. Williamson, DDW The Color House, Dohler Group, GNT Group, International Flavors & Fragrances Inc (IFF), Kalsec, Naturex, ROHA Group USA, Royal DSM N.V., San-Ei Gen FFI, Sensient Technologies Corp, Symrise AG, and Others.
Color Additives Market Dynamics
Color Additives Market Trend: Clean Label and Natural Ingredients
A prominent market trend in the Color Additives sector is the shift towards clean label and natural ingredients. Consumers are becoming more conscious about the ingredients in their food and beverages, leading to a preference for color additives derived from natural sources such as fruits, vegetables, and plants. This trend aligns with the broader movement towards clean eating, transparency in food labeling, and the avoidance of artificial additives, colors, and preservatives.
Color Additives Market Driver: Demand for Vibrant and Appealing Food Products
The market for Color Additives is primarily driven by the demand for vibrant and appealing food products. Color additives play a crucial role in enhancing the visual appeal of food and beverages, influencing consumer perception, and creating attractive product presentations. The driver is reinforced by the importance of aesthetics in food marketing, culinary trends favoring visually appealing dishes, and the use of colors to signify freshness, flavor, and quality.
Color Additives Market Opportunity: Innovation in Natural Colors and Customized Solutions
An opportunity within the Color Additives market lies in innovation in natural colors and customized solutions. Manufacturers can focus on developing a wide range of natural color additives sourced from botanical extracts, spices, and other plant-based sources to meet consumer preferences for clean label products. Additionally, there's potential for offering customized color solutions tailored to specific food and beverage applications, including beverages, confectionery, bakery, and dairy products. By leveraging natural ingredients and providing customizable color options, companies can address consumer demand for clean label products while offering versatile and visually appealing solutions for the food industry.
Color Additives Market Share Analysis: Artificial Colorants segment generated the highest revenue share in the industry
The Artificial Colorants segment emerges as the largest segment in the Color Additives market. This dominance is primarily driven by the widespread use of artificial colorants across various industries such as food and beverages, pharmaceuticals, cosmetics, and textiles. Artificial colorants offer a wide range of vibrant and stable colors, making them highly desirable for enhancing the visual appeal of products. They are also relatively cost-effective and easily available compared to natural colorants, which contributes to their widespread adoption by manufacturers. Additionally, advancements in synthetic chemistry have led to the development of innovative artificial colorants with improved properties such as heat stability, lightfastness, and solubility, further boosting their demand. As consumer preferences for visually appealing products continue to grow, the Artificial Colorants segment is expected to maintain its position as the largest segment in the Color Additives market.
Color Additives Market Share Analysis: Food Color Additives is the fastest growing segment over the forecast period to 2032
The Food Color Additives segment stands out as the fastest-growing segment in the Color Additives market. This rapid growth can be attributed to several key factors. Firstly, the increasing consumer demand for visually appealing and enticing food products has driven manufacturers to use a wide range of food color additives to enhance the appearance of their products. Additionally, advancements in food processing technologies have enabled the incorporation of innovative color additives that provide vivid and stable colors while meeting regulatory standards for safety and quality. Further, as consumer awareness regarding the impact of natural and artificial colorants on health and wellness grows, there is a rising preference for natural color additives derived from fruits, vegetables, and other plant-based sources. This shift towards natural food color additives further contributes to the growth of the Food Color Additives segment. As food manufacturers continue to focus on product differentiation and consumer preferences, the Food Color Additives segment is poised for significant growth in the coming years.
Color Additives Market Segmentation
By Type
Natural Colorants
Artificial Colorants
By Application
Food
Beverage
Countries Analyzed
North America (US, Canada, Mexico)
Europe (Germany, UK, France, Spain, Italy, Russia, Rest of Europe)
Asia Pacific (China, India, Japan, South Korea, Australia, South East Asia, Rest of Asia)
South America (Brazil, Argentina, Rest of South America)
Middle East and Africa (Saudi Arabia, UAE, Rest of Middle East, South Africa, Egypt, Rest of Africa)
Color Additives Companies Profiled in the Study
Allied Biotech Corp
Archer Daniels Midland Company (ADM)
BioconColors
Brenntag North America
Chr. Hansen
ColorKitchen
colorMaker
D.D. Williamson
DDW The Color House
Dohler Group
GNT Group
International Flavors & Fragrances Inc (IFF)
Kalsec
Naturex
ROHA Group USA
Royal DSM N.V.
San-Ei Gen FFI
Sensient Technologies Corp
Symrise AG
*- List Not Exhaustive
Chapter 1. TABLE OF CONTENTS
Chapter 2. Introduction to Color Additives Market
2.1. Market Overview
2.2. Key Statistics and Report Highlights
2.3. Scope of the Comprehensive Study
2.3.1. Market Definition
2.3.2 Countries and Regions Covered
2.3.3 Research Objective
2.3.4 Units, Currency, and Conversions
2.3.5 Industry Value Chain
2.4. Key Market Segments
2.5. Key Companies
2.6. Study Period
Chapter 3. Strategic Analysis Review
3.1. Color Additives Pricing Analysis and Forecast
3.2. Porter’s Five Forces
3.3. Market Ecosystem
3.4. SWOT Analysis
3.5. Regulatory Scenario
3.3. Effects of Inflation, Russia-Ukraine War, moderating economic growth, and other macroeconomic factors
Chapter 4. Competitive Landscape
4.1. Market Share Analysis
4.1.1. Global Color Additives Market Share by Company, 2023
4.1.2. Product Offerings of Leading Color Additives Companies
4.2. Market Entropy
4.2.1. New Product Launches in the Industry
4.2.2. Mergers, Acquisitions, Joint ventures, and Partnerships
4.3. Key Strategies and Best Practices
Chapter 5. Global Market Projections: Best, Reference, and Low Case Scenarios
5.1. Growth Analysis- Case Scenario Definitions
5.2. Low Growth Case Scenario Forecasts
5.3. Reference Growth Case Scenario Forecasts
5.4. High Growth Case Scenario Forecasts
Chapter 6. Market Dynamics
6.1. Color Additives Market Drivers
6.2. Color Additives Market Challenges
6.6. Color Additives Market Opportunities
6.4. Color Additives Market Trends
Chapter 7. Global Color Additives Market Outlook Trends
7.1. Global Color Additives Revenue (USD Million) and CAGR (%) by Type (2021-2032)
7.2. Global Color Additives Revenue (USD Million) and CAGR (%) by Application (2021-2032)
7.3. Global Color Additives Revenue (USD Million) and CAGR (%) by Product (2021-2032)
By Type
Natural Colorants
Artificial Colorants
By Application
Food
Beverage
Chapter 8. Global Color Additives Regional Analysis and Outlook
8.1. Global Color Additives Revenue (USD Million) By Regions (2021- 2032)
8.2. North America Color Additives Revenue (USD Million) by Country (2021-2032)
8.2.1. United States Color Additives Regional Analysis and Outlook
8.2.2. Canada Color Additives Regional Analysis and Outlook
8.2.3. Mexico Color Additives Regional Analysis and Outlook
8.3. Europe Color Additives Revenue (USD Million), by Country (2021-2032)
8.3.1. Germany Color Additives Regional Analysis and Outlook
8.3.2. France Color Additives Regional Analysis and Outlook
8.3.3. United Kingdom Color Additives Regional Analysis and Outlook
8.3.4. Spain Color Additives Regional Analysis and Outlook
8.3.5. Italy Color Additives Regional Analysis and Outlook
8.3.6. Russia Color Additives Regional Analysis and Outlook
8.3.7. Rest of Europe Color Additives Regional Analysis and Outlook
8.4. Asia Pacific Color Additives Revenue (USD Million) by Country (2021-2032)
8.4.1. China Color Additives Regional Analysis and Outlook
8.4.2. Japan Color Additives Regional Analysis and Outlook
8.4.3. India Color Additives Regional Analysis and Outlook
8.4.4. South Korea Color Additives Regional Analysis and Outlook
8.4.5. Australia Color Additives Regional Analysis and Outlook
8.4.6. South East Asia Color Additives Regional Analysis and Outlook
8.4.7. Rest of Asia Pacific Color Additives Regional Analysis and Outlook
8.5. South America Color Additives Revenue (USD Million), by Country (2021-2032)
8.5.1. Brazil Color Additives Regional Analysis and Outlook
8.5.2. Argentina Color Additives Regional Analysis and Outlook
8.5.3. Rest of South America Color Additives Regional Analysis and Outlook
8.6. Middle East and Africa Color Additives Revenue (USD Million) by Country (2021-2032)
8.6.1. Middle East Color Additives Regional Analysis and Outlook
8.6.2. Africa Color Additives Regional Analysis and Outlook
Chapter 9. North America Color Additives Analysis and Outlook
9.1. North America Color Additives Revenue (USD Million) by Segments (2021-2032)
9.1.1. North America Color Additives Revenue (USD Million) by Type (2021-2032)
9.1.2. North America Color Additives Revenue (USD Million) by Application (2021-2032)
9.1.3. North America Color Additives Revenue (USD Million) by Product (2021-2032)
By Type
Natural Colorants
Artificial Colorants
By Application
Food
Beverage
Chapter 10. Europe Color Additives Analysis and Outlook
10.1. Europe Color Additives Revenue (USD Million), by Segments (USD Million) (2021-2032)
10.1.1. Europe Color Additives Revenue (USD Million) by Type (2021-2032)
10.1.2. Europe Color Additives Revenue (USD Million) by Application (2021-2032)
10.1.3. Europe Color Additives Revenue (USD Million) by Product (2021-2032)
By Type
Natural Colorants
Artificial Colorants
By Application
Food
Beverage
Chapter 11. Asia Pacific Color Additives Analysis and Outlook
11.1. Asia Pacific Color Additives Revenue (USD Million), and Revenue (USD Million) by Segments (2021-2032)
11.1.1. Asia Pacific Color Additives Revenue (USD Million) by Type (2021-2032)
11.1.2. Asia Pacific Color Additives Revenue (USD Million) by Application (2021-2032)
11.1.3. Asia Pacific Color Additives Revenue (USD Million) by Product (2021-2032)
By Type
Natural Colorants
Artificial Colorants
By Application
Food
Beverage
Chapter 12. South America Color Additives Analysis and Outlook
12.1. South America Color Additives Revenue (USD Million), by Segments (2021-2032)
12.1.1. South America Color Additives Revenue (USD Million) by Type (2021-2032)
12.1.2. South America Color Additives Revenue (USD Million) by Application (2021-2032)
12.1.3. South America Color Additives Revenue (USD Million) by Product (2021-2032)
By Type
Natural Colorants
Artificial Colorants
By Application
Food
Beverage
Chapter 13. Middle East and Africa Color Additives Analysis and Outlook
13.1. Middle East and Africa Color Additives Revenue (USD Million), by Segments (2021-2032)
13.1.1. Middle East and Africa Color Additives Revenue (USD Million) by Type (2021-2032)
13.1.2. Middle East and Africa Color Additives Revenue (USD Million) by Application (2021-2032)
13.1.3. Middle East and Africa Color Additives Revenue (USD Million) by Product (2021-2032)
By Type
Natural Colorants
Artificial Colorants
By Application
Food
Beverage
Chapter 14. Color Additives Company Profiles
14.1 Business Overview
14.2 Product Profiles
14.3 SWOT Profiles
14.5 Recent Developments
14.6 Financial Profile
List of Companies
Allied Biotech Corp
Archer Daniels Midland Company (ADM)
BioconColors
Brenntag North America
Chr. Hansen
ColorKitchen
colorMaker
D.D. Williamson
DDW The Color House
Dohler Group
GNT Group
International Flavors & Fragrances Inc (IFF)
Kalsec
Naturex
ROHA Group USA
Royal DSM N.V.
San-Ei Gen FFI
Sensient Technologies Corp
Symrise AG
15. Methodology and Data Sources
15.1 Customization Offerings
15.2 Subscription Services
15.3 Related Reports
15.4 Publisher Expertise
LIST OF TABLES
Table 1 Market Segmentation Analysis
Table 2 Global Color Additives Market Share of Leading Companies, 2023
Table 3 Product Offerings of Leading Companies
Table 4 Low Growth Scenario Forecasts
Table 5 Reference Case Growth Scenario
Table 6 High Growth Case Scenario
Table 7 Global Color Additives Revenue (USD Million) And CAGR (%) By Type (2021-2032)
Table 8 Global Color Additives Revenue (USD Million) And CAGR (%) By Application (2021-2032)
Table 9 Global Color Additives Revenue (USD Million) And CAGR (%) By Product (2021-2032)
Table 10 Global Color Additives Market Revenue (USD Million) By Regions (2021-2032)
Table 11 Global Color Additives Market Share (%) By Regions (2021-2032)
Table 12 North America Color Additives Revenue (USD Million) By Country (2021-2032)
Table 13 Europe Color Additives Revenue (USD Million) By Country (2021-2032)
Table 14 Asia Pacific Color Additives Revenue (USD Million) By Country (2021-2032)
Table 15 South America Color Additives Revenue (USD Million) By Country (2021-2032)
Table 16 Middle East and Africa Color Additives Revenue (USD Million) By Region (2021-2032)
Table 17 North America Color Additives Revenue (USD Million) By Type (2021-2032)
Table 18 North America Color Additives Revenue (USD Million) By Application (2021-2032)
Table 19 North America Color Additives Revenue (USD Million) By Product (2021-2032)
Table 20 Europe Color Additives Revenue (USD Million) By Type (2021-2032)
Table 21 Europe Color Additives Revenue (USD Million) By Application (2021-2032)
Table 22 Europe Color Additives Revenue (USD Million) By Product (2021-2032)
Table 23 Asia Pacific Color Additives Revenue (USD Million) By Type (2021-2032)
Table 24 Asia Pacific Color Additives Revenue (USD Million) By Application (2021-2032)
Table 25 Asia Pacific Color Additives Revenue (USD Million) By Product (2021-2032)
Table 26 South America Color Additives Revenue (USD Million) By Type (2021-2032)
Table 27 South America Color Additives Revenue (USD Million) By Application (2021-2032)
Table 28 South America Color Additives Revenue (USD Million) By Product (2021-2032)
Table 29 Middle East and Africa Color Additives Revenue (USD Million) By Type (2021-2032)
Table 30 Middle East and Africa Color Additives Revenue (USD Million) By Application (2021-2032)
Table 31 Middle East and Africa Color Additives Revenue (USD Million) By Product (2021-2032)
LIST OF FIGURES
Figure 1. Market Scope
Figure 2. Pricing Forecasts Per Unit, 2023- 2032
Figure 3. Porter’s Five Forces
Figure 4. Global Color Additives Market Revenue (USD Million) By Regions (2021-2032)
Figure 5. Global Color Additives Market Share (%) By Regions (2023)
Figure 6. North America Color Additives Revenue (USD Million) By Country (2021-2032)
Figure 7. United States Color Additives Revenue (USD Million) By Country (2021-2032)
Figure 8. Canada Color Additives Revenue (USD Million) By Country (2021-2032)
Figure 9. Mexico Color Additives Revenue (USD Million) By Country (2021-2032)
Figure 10. Europe Color Additives Revenue (USD Million) By Country (2021-2032)
Figure 11. Germany Color Additives Revenue (USD Million) By Country (2021-2032)
Figure 12. France Color Additives Revenue (USD Million) By Country (2021-2032)
Figure 13. United Kingdom Color Additives Revenue (USD Million) By Country (2021-2032)
Figure 14. Spain Color Additives Revenue (USD Million) By Country (2021-2032)
Figure 15. Italy Color Additives Revenue (USD Million) By Country (2021-2032)
Figure 16. Russia Color Additives Revenue (USD Million) By Country (2021-2032)
Figure 17. Rest of Europe Color Additives Revenue (USD Million) By Country (2021-2032)
Figure 11. Asia Pacific Color Additives Revenue (USD Million) By Country (2021-2032)
Figure 12. China Color Additives Revenue (USD Million) By Country (2021-2032)
Figure 13. Japan Color Additives Revenue (USD Million) By Country (2021-2032)
Figure 14. India Color Additives Revenue (USD Million) By Country (2021-2032)
Figure 15. South Korea Color Additives Revenue (USD Million) By Country (2021-2032)
Figure 16. Australia Color Additives Revenue (USD Million) By Country (2021-2032)
Figure 17. South East Asia Color Additives Revenue (USD Million) By Country (2021-2032)
Figure 18. South America Color Additives Revenue (USD Million) By Country (2021-2032)
Figure 19. Brazil Color Additives Revenue (USD Million) By Country (2021-2032)
Figure 20. Argentina Color Additives Revenue (USD Million) By Country (2021-2032)
Figure 21. Rest of Asia Pacific Color Additives Revenue (USD Million) By Country (2021-2032)
Figure 22. Middle East and Africa Color Additives Revenue (USD Million) By Region (2021-2032)
Figure 23. Saudi Arabia Color Additives Revenue (USD Million) By Region (2021-2032)
Figure 24. The UAE Color Additives Revenue (USD Million) By Region (2021-2032)
Figure 25. Rest of Middle East Color Additives Revenue (USD Million) By Region (2021-2032)
Figure 26. South Africa Color Additives Revenue (USD Million) By Region (2021-2032)
Figure 27. Africa Color Additives Revenue (USD Million) By Region (2021-2032)
Figure 28. North America Color Additives Revenue (USD Million) By Type (2021-2032)
Figure 29. North America Color Additives Revenue (USD Million) By Application (2021-2032)
Figure 30. North America Color Additives Revenue (USD Million) By Product (2021-2032)
Figure 31. Europe Color Additives Revenue (USD Million) By Type (2021-2032)
Figure 32. Europe Color Additives Revenue (USD Million) By Application (2021-2032)
Figure 33. Europe Color Additives Revenue (USD Million) By Product (2021-2032)
Figure 34. Asia Pacific Color Additives Revenue (USD Million) By Type (2021-2032)
Figure 35. Asia Pacific Color Additives Revenue (USD Million) By Application (2021-2032)
Figure 36. Asia Pacific Color Additives Revenue (USD Million) By Product (2021-2032)
Figure 37. South America Color Additives Revenue (USD Million) By Type (2021-2032)
Figure 38. South America Color Additives Revenue (USD Million) By Application (2021-2032)
Figure 39. South America Color Additives Revenue (USD Million) By Product (2021-2032)
Figure 40. Middle East and Africa Color Additives Revenue (USD Million) By Type (2021-2032)
Figure 41. Middle East and Africa Color Additives Revenue (USD Million) By Application (2021-2032)
Figure 42. Middle East and Africa Color Additives Revenue (USD Million) By Product (2021-2032)
By Type
Natural Colorants
Artificial Colorants
By Application
Food
Beverage
Countries Analyzed
North America (US, Canada, Mexico)
Europe (Germany, UK, France, Spain, Italy, Russia, Rest of Europe)
Asia Pacific (China, India, Japan, South Korea, Australia, South East Asia, Rest of Asia)
South America (Brazil, Argentina, Rest of South America)
Middle East and Africa (Saudi Arabia, UAE, Rest of Middle East, South Africa, Egypt, Rest of Africa)
