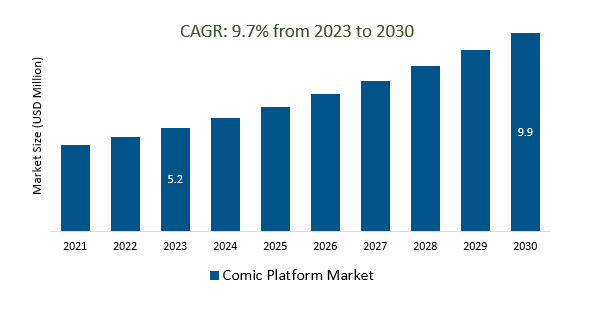
The Global Comic Platform Market is estimated to be US$ 5.2Billion in 2023. It is poised to register 9.7% growth over the forecast period from 2023 to 2030 to reach US $ 9.9billion 2030.
The market growth is driven by the increasing Integration of AR technology into comics enhances the reader's experience by adding interactive elements and multimedia features. Leading companies are focusing on Continued Growth in Digital, Virtual Reality (VR) and Augmented Reality (AR), Globalization and Localization, Cross-Media Integration, and others to boost market shares in the industry.
Market Overview
The Comic Platform Market comprises digital and physical platforms for creating, distributing, and consuming comics and graphic novels. It includes digital platforms like ComiXology and Webtoon, webcomics, print comics from publishers such as Marvel and DC, and self-publishing via crowdfunding. Trends include the rise of diverse voices, adaptations into movies and TV shows, the exploration of AR and VR, and the integration of blockchain and NFTs. The market caters to a global audience and offers opportunities for both established publishers and independent creators, with a growing emphasis on digitalization and interactivity in comic experiences.
Market Dynamics
Market Trends- The Rise of the Comic Book Store for a Comic Platform Market
Comic book stores are experiencing a resurgence in the Comic Platform Market, emphasizing their enduring value as physical spaces for comics and related merchandise, offering a curated selection, hosting events, and adapting to changing market dynamics, demonstrating continued relevance for comic fans and collectors.
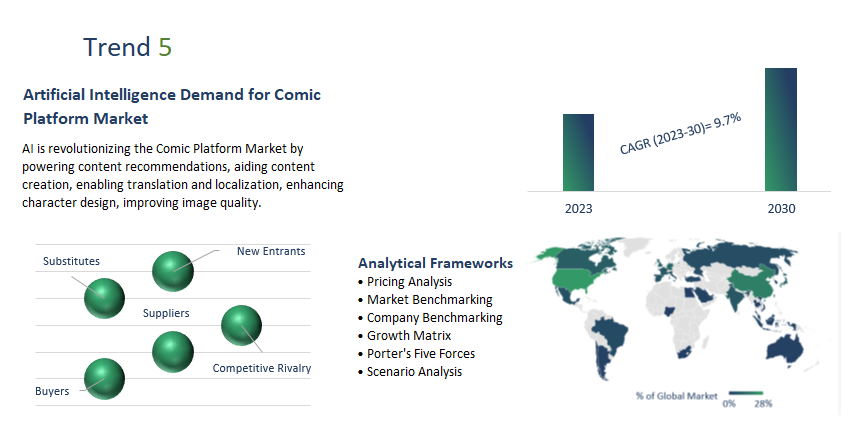
Market Driver- Artificial Intelligence Demand for Comic Platform Market
AI is revolutionizing the Comic Platform Market by powering content recommendations, aiding content creation, enabling translation and localization, enhancing character design, improving image quality, enabling interactive comics, combating piracy, engaging users with chatbots, offering data analytics insights, and enhancing AR and VR comic experiences, making AI central to both creative and user aspects of comic platforms.
Market Opportunity-Introduction of Digitalization of Comics
The digitalization of comics in the Comic Platform Market signifies a shift from print to digital formats, offering convenience and accessibility through mobile apps, subscription services, and interactive webcomics. This transformation broadens the market's reach, attracting a more global and tech-savvy audience while changing the way comics are created and consumed.
Market Share Analysis- Unrestricted Level Comic Platform Market will register the fastest growth
The Global Comic Platform Market is analyzed across Unrestricted Levels, Restricted Levels, and others. Of these, the Unrestricted Level will register the fastest growth. Unrestricted Level is not a recognized term within the Comic Platform Market and it lacks a specific industry definition or context. Please provide further information or clarify the term for a more accurate response.
Market Share Analysis- Comprehensive held a significant market share in 2023
The Global Comic Platform Market is analyzed across various Comic Types including Comprehensive, Action, Sci-fi, and others. Of these, the Comprehensive held a significant market share in 2023. The Comic Platform Market comprises digital and physical platforms for comics and graphic novels, serving a diverse audience. It encompasses digital platforms (e.g., ComiXology, Webtoon), print comics from major publishers, webcomics, and emerging technologies like AI, AR, and VR. Trends include diversity and inclusion efforts, blockchain and NFT adoption, and AI-driven content creation, offering opportunities for established publishers and independent creators in response to evolving consumer preferences and technology advances.
Comic Platform Market Segmentation
By Type
- Restricted Level
- Unrestricted Level
By Comic Type
- Romantic
- Comprehensive
- Action
- Kid
- Sci-fi
- Others
By Application
By End-User
By Region
- North America (United States, Canada, Mexico)
- Europe (Germany, France, United Kingdom, Spain, Italy, Others)
- Asia Pacific (China, India, Japan, South Korea, Australia, Others)
- Latin America (Brazil, Argentina, Others)
- Middle East and Africa (Saudi Arabia, UAE, Kuwait, Other Middle East, South Africa, Nigeria, Other Africa)
Comic Platform Market Companies
- DC Comics (United States)
- Kakao Page Corp (South Korea)
- Amazon (United States)
- Comic Book Plus (United States)
- Toomics (South Korea)
- Naver Corporation (South Korea)
- Hitotsubashi Group (Japan)
- Elf quest (United States)
- CONtv (United States)
- Bilibili Manga (China)
- Drive thru Comics (United States)
- Digital Manga (United States)
- Iconology (United States)
- WebToons Entertainment Inc. (United States)
- Internet Archive (United States)
- GoComics (United States)
- Marvel Entertainment (United States)
* List not exhaustive
Comic Platform Market Outlook 2023
1 Market Overview
1.1 Introduction to the Comic Platform Market
1.2 Scope of the Study
1.3 Research Objective
1.3.1 Key Market Scope and Segments
1.3.2 Players Covered
1.3.3 Years Considered
2 Executive Summary
2.1 2023 Comic Platform Industry- Market Statistics
3 Market Dynamics
3.1 Market Drivers
3.2 Market Challenges
3.3 Market Opportunities
3.4 Market Trends
4 Market Factor Analysis
4.1 Porter’s Five Forces
4.2 Market Entropy
4.2.1 Global Comic Platform Market Companies with Area Served
4.2.2 Products Offerings Global Comic Platform Market
5 COVID-19 Impact Analysis and Outlook Scenarios
5.1.1 Covid-19 Impact Analysis
5.1.2 post-COVID-19 Scenario- Low Growth Case
5.1.3 post-COVID-19 Scenario- Reference Growth Case
5.1.4 post-COVID-19 Scenario- Low Growth Case
6 Global Comic Platform Market Trends
6.1 Global Comic Platform Revenue (USD Million) and CAGR (%) by Type (2018-2030)
6.2 Global Comic Platform Revenue (USD Million) and CAGR (%) by Applications (2018-2030)
6.3 Global Comic Platform Revenue (USD Million) and CAGR (%) by regions (2018-2030)
7 Global Comic Platform Market Revenue (USD Million) by Type, and Applications (2018-2022)
7.1 Global Comic Platform Revenue (USD Million) by Type (2018-2022)
7.1.1 Global Comic Platform Revenue (USD Million), Market Share (%) by Type (2018-2022)
7.2 Global Comic Platform Revenue (USD Million) by Applications (2018-2022)
7.2.1 Global Comic Platform Revenue (USD Million), Market Share (%) by Applications (2018-2022)
8 Global Comic Platform Development Regional Status and Outlook
8.1 Global Comic Platform Revenue (USD Million) By Regions (2018-2022)
8.2 North America Comic Platform Revenue (USD Million) by Type, and Application (2018-2022)
8.2.1 North America Comic Platform Revenue (USD Million) by Country (2018-2022)
8.2.2 North America Comic Platform Revenue (USD Million) by Type (2018-2022)
8.2.3 North America Comic Platform Revenue (USD Million) by Applications (2018-2022)
8.3 Europe Comic Platform Revenue (USD Million), by Type, and Applications (USD Million) (2018-2022)
8.3.1 Europe Comic Platform Revenue (USD Million), by Country (2018-2022)
8.3.2 Europe Comic Platform Revenue (USD Million) by Type (2018-2022)
8.3.3 Europe Comic Platform Revenue (USD Million) by Applications (2018-2022)
8.4 Asia Pacific Comic Platform Revenue (USD Million), and Revenue (USD Million) by Type, and Applications (2018-2022)
8.4.1 Asia Pacific Comic Platform Revenue (USD Million) by Country (2018-2022)
8.4.2 Asia Pacific Comic Platform Revenue (USD Million) by Type (2018-2022)
8.4.3 Asia Pacific Comic Platform Revenue (USD Million) by Applications (2018-2022)
8.5 South America Comic Platform Revenue (USD Million), by Type, and Applications (2018-2022)
8.5.1 South America Comic Platform Revenue (USD Million), by Country (2018-2022)
8.5.2 South America Comic Platform Revenue (USD Million) by Type (2018-2022)
8.5.3 South America Comic Platform Revenue (USD Million) by Applications (2018-2022)
8.6 Middle East and Africa Comic Platform Revenue (USD Million), by Type, Technology, Application, Thickness (2018-2022)
8.6.1 Middle East and Africa Comic Platform Revenue (USD Million) by Country (2018-2022)
8.6.2 Middle East and Africa Comic Platform Revenue (USD Million) by Type (2018-2022)
8.6.3 Middle East and Africa Comic Platform Revenue (USD Million) by Applications (2018-2022)
9 Company Profiles
10 Global Comic Platform Market Revenue (USD Million), by Type, and Applications (2023-2030)
10.1 Global Comic Platform Revenue (USD Million) and Market Share (%) by Type (2023-2030)
10.1.1 Global Comic Platform Revenue (USD Million), and Market Share (%) by Type (2023-2030)
10.2 Global Comic Platform Revenue (USD Million) and Market Share (%) by Applications (2023-2030)
10.2.1 Global Comic Platform Revenue (USD Million), and Market Share (%) by Applications (2023-2030)
11 Global Comic Platform Development Regional Status and Outlook Forecast
11.1 Global Comic Platform Revenue (USD Million) By Regions (2023-2030)
11.2 North America Comic Platform Revenue (USD Million) by Type, and Applications (2023-2030)
11.2.1 North America Comic Platform Revenue (USD) Million by Country (2023-2030)
11.2.2 North America Comic Platform Revenue (USD Million), by Type (2023-2030)
11.2.3 North America Comic Platform Revenue (USD Million), Market Share (%) by Applications (2023-2030)
11.3 Europe Comic Platform Revenue (USD Million), by Type, and Applications (2023-2030)
11.3.1 Europe Comic Platform Revenue (USD Million), by Country (2023-2030)
11.3.2 Europe Comic Platform Revenue (USD Million), by Type (2023-2030)
11.3.3 Europe Comic Platform Revenue (USD Million), by Applications (2023-2030)
11.4 Asia Pacific Comic Platform Revenue (USD Million) by Type, and Applications (2023-2030)
11.4.1 Asia Pacific Comic Platform Revenue (USD Million), by Country (2023-2030)
11.4.2 Asia Pacific Comic Platform Revenue (USD Million), by Type (2023-2030)
11.4.3 Asia Pacific Comic Platform Revenue (USD Million), by Applications (2023-2030)
11.5 South America Comic Platform Revenue (USD Million), by Type, and Applications (2023-2030)
11.5.1 South America Comic Platform Revenue (USD Million), by Country (2023-2030)
11.5.2 South America Comic Platform Revenue (USD Million), by Type (2023-2030)
11.5.3 South America Comic Platform Revenue (USD Million), by Applications (2023-2030)
11.6 Middle East and Africa Comic Platform Revenue (USD Million), by Type, and Applications (2023-2030)
11.6.1 Middle East and Africa Comic Platform Revenue (USD Million), by region (2023-2030)
11.6.2 Middle East and Africa Comic Platform Revenue (USD Million), by Type (2023-2030)
11.6.3 Middle East and Africa Comic Platform Revenue (USD Million), by Applications (2023-2030)
12 Methodology and Data Sources
12.1 Methodology/Research Approach
12.1.1 Research Programs/Design
12.1.2 Market Size Estimation
12.1.3 Market Breakdown and Data Triangulation
12.2 Data Sources
12.2.1 Secondary Sources
12.2.2 Primary Sources
12.3 Disclaimer
List of Tables
Table 1 Market Segmentation Analysis
Table 2 Global Comic Platform Market Companies with Areas Served
Table 3 Products Offerings Global Comic Platform Market
Table 4 Low Growth Scenario Forecasts
Table 5 Reference Case Growth Scenario
Table 6 High Growth Case Scenario
Table 7 Global Comic Platform Revenue (USD Million) And CAGR (%) By Type (2018-2030)
Table 8 Global Comic Platform Revenue (USD Million) And CAGR (%) By Applications (2018-2030)
Table 9 Global Comic Platform Revenue (USD Million) And CAGR (%) By Regions (2018-2030)
Table 10 Global Comic Platform Revenue (USD Million) By Type (2018-2022)
Table 11 Global Comic Platform Revenue Market Share (%) By Type (2018-2022)
Table 12 Global Comic Platform Revenue (USD Million) By Applications (2018-2022)
Table 13 Global Comic Platform Revenue Market Share (%) By Applications (2018-2022)
Table 14 Global Comic Platform Market Revenue (USD Million) By Regions (2018-2022)
Table 15 Global Comic Platform Market Share (%) By Regions (2018-2022)
Table 16 North America Comic Platform Revenue (USD Million) By Country (2018-2022)
Table 17 North America Comic Platform Revenue (USD Million) By Type (2018-2022)
Table 18 North America Comic Platform Revenue (USD Million) By Applications (2018-2022)
Table 19 Europe Comic Platform Revenue (USD Million) By Country (2018-2022)
Table 20 Europe Comic Platform Revenue (USD Million) By Type (2018-2022)
Table 21 Europe Comic Platform Revenue (USD Million) By Applications (2018-2022)
Table 22 Asia Pacific Comic Platform Revenue (USD Million) By Country (2018-2022)
Table 23 Asia Pacific Comic Platform Revenue (USD Million) By Type (2018-2022)
Table 24 Asia Pacific Comic Platform Revenue (USD Million) By Applications (2018-2022)
Table 25 South America Comic Platform Revenue (USD Million) By Country (2018-2022)
Table 26 South America Comic Platform Revenue (USD Million) By Type (2018-2022)
Table 27 South America Comic Platform Revenue (USD Million) By Applications (2018-2022)
Table 28 Middle East and Africa Comic Platform Revenue (USD Million) By Region (2018-2022)
Table 29 Middle East and Africa Comic Platform Revenue (USD Million) By Type (2018-2022)
Table 30 Middle East and Africa Comic Platform Revenue (USD Million) By Applications (2018-2022)
Table 31 Financial Analysis
Table 32 Global Comic Platform Revenue (USD Million) By Type (2023-2030)
Table 33 Global Comic Platform Revenue Market Share (%) By Type (2023-2030)
Table 34 Global Comic Platform Revenue (USD Million) By Applications (2023-2030)
Table 35 Global Comic Platform Revenue Market Share (%) By Applications (2023-2030)
Table 36 Global Comic Platform Market Revenue (USD Million), And Revenue (USD Million) By Regions (2023-2030)
Table 37 North America Comic Platform Revenue (USD)By Country (2023-2030)
Table 38 North America Comic Platform Revenue (USD Million) By Type (2023-2030)
Table 39 North America Comic Platform Revenue (USD Million) By Applications (2023-2030)
Table 40 Europe Comic Platform Revenue (USD Million) By Country (2023-2030)
Table 41 Europe Comic Platform Revenue (USD Million) By Type (2023-2030)
Table 42 Europe Comic Platform Revenue (USD Million) By Applications (2023-2030)
Table 43 Asia Pacific Comic Platform Revenue (USD Million) By Country (2023-2030)
Table 44 Asia Pacific Comic Platform Revenue (USD Million) By Type (2023-2030)
Table 45 Asia Pacific Comic Platform Revenue (USD Million) By Applications (2023-2030)
Table 46 South America Comic Platform Revenue (USD Million) By Country (2023-2030)
Table 47 South America Comic Platform Revenue (USD Million) By Type (2023-2030)
Table 48 South America Comic Platform Revenue (USD Million) By Applications (2023-2030)
Table 49 Middle East and Africa Comic Platform Revenue (USD Million) By Region (2023-2030)
Table 50 Middle East and Africa Comic Platform Revenue (USD Million) By Region (2023-2030)
Table 51 Middle East and Africa Comic Platform Revenue (USD Million) By Type (2023-2030)
Table 52 Middle East and Africa Comic Platform Revenue (USD Million) By Applications (2023-2030)
Table 53 Research Programs/Design for This Report
Table 54 Key Data Information from Secondary Sources
Table 55 Key Data Information from Primary Sources
List of Figures
Figure 1 Market Scope
Figure 2 Porter’s Five Forces
Figure 3 Global Comic Platform Revenue (USD Million) By Type (2018-2022)
Figure 4 Global Comic Platform Revenue Market Share (%) By Type (2022)
Figure 5 Global Comic Platform Revenue (USD Million) By Applications (2018-2022)
Figure 6 Global Comic Platform Revenue Market Share (%) By Applications (2022)
Figure 7 Global Comic Platform Market Revenue (USD Million) By Regions (2018-2022)
Figure 8 Global Comic Platform Market Share (%) By Regions (2022)
Figure 9 North America Comic Platform Revenue (USD Million) By Country (2018-2022)
Figure 10 North America Comic Platform Revenue (USD Million) By Type (2018-2022)
Figure 11 North America Comic Platform Revenue (USD Million) By Applications (2018-2022)
Figure 12 Europe Comic Platform Revenue (USD Million) By Country (2018-2022)
Figure 13 Europe Comic Platform Revenue (USD Million) By Type (2018-2022)
Figure 14 Europe Comic Platform Revenue (USD Million) By Applications (2018-2022)
Figure 15 Asia Pacific Comic Platform Revenue (USD Million) By Country (2018-2022)
Figure 16 Asia Pacific Comic Platform Revenue (USD Million) By Type (2018-2022)
Figure 17 Asia Pacific Comic Platform Revenue (USD Million) By Applications (2018-2022)
Figure 18 South America Comic Platform Revenue (USD Million) By Country (2018-2022)
Figure 19 South America Comic Platform Revenue (USD Million) By Type (2018-2022)
Figure 20 South America Comic Platform Revenue (USD Million) By Applications (2018-2022)
Figure 21 Middle East and Africa Comic Platform Revenue (USD Million) By Region (2018-2022)
Figure 22 Middle East and Africa Comic Platform Revenue (USD Million) By Type (2018-2022)
Figure 23 Middle East and Africa Comic Platform Revenue (USD Million) By Applications (2018-2022)
Figure 24 Global Comic Platform Revenue (USD Million) By Type (2023-2030)
Figure 25 Global Comic Platform Revenue Market Share (%) By Type (2030)
Figure 26 Global Comic Platform Revenue (USD Million) By Applications (2023-2030)
Figure 27 Global Comic Platform Revenue Market Share (%) By Applications (2030)
Figure 28 Global Comic Platform Market Revenue (USD Million) By Regions (2023-2030)
Figure 29 North America Comic Platform Revenue (USD Million) By Country (2023-2030)
Figure 30 North America Comic Platform Revenue (USD Million) By Type (2023-2030)
Figure 31 North America Comic Platform Revenue (USD Million) By Applications (2023-2030)
Figure 32 Europe Comic Platform Revenue (USD Million) By Country (2023-2030)
Figure 33 Europe Comic Platform Revenue (USD Million) By Type (2023-2030)
Figure 34 Europe Comic Platform Revenue (USD Million) By Applications (2023-2030)
Figure 35 Asia Pacific Comic Platform Revenue (USD Million) By Country (2023-2030)
Figure 36 Asia Pacific Comic Platform Revenue (USD Million) By Type (2023-2030)
Figure 37 Asia Pacific Comic Platform Revenue (USD Million) By Applications (2023-2030)
Figure 38 South America Comic Platform Revenue (USD Million) By Country (2023-2030)
Figure 39 South America Comic Platform Revenue (USD Million) By Type (2023-2030)
Figure 40 South America Comic Platform Revenue (USD Million) By Applications (2023-2030)
Figure 41 Middle East and Africa Comic Platform Revenue (USD Million) By Region (2023-2030)
Figure 42 Middle East and Africa Comic Platform Revenue (USD Million) By Region (2023-2030)
Figure 43 Middle East and Africa Comic Platform Revenue (USD Million) By Type (2023-2030)
Figure 44 Middle East and Africa Comic Platform Revenue (USD Million) By Applications (2023-2030)
Figure 45 Bottom-Up and Top-Down Approaches for This Report
Figure 46 Data Triangulation
