
The Global Commercial Distributed Energy Generation Market is estimated to be US$ 274.0 Billion in 2023. It is poised to register 11.1% growth over the forecast period from 2023 to 2030 to reach US $ 572.5 billion 2030.
The market growth is driven by the increasing awareness of environmental sustainability and the need to reduce greenhouse gas emissions has led to an increasing emphasis on renewable energy sources such as solar, wind, and hydroelectric power in commercial distributed energy generation. Leading companies are focusing on Increased Adoption of Renewable Energy, Grid Decentralization, Technological Innovations, Data and Analytics, Hybrid Systems, and others to boost market shares in the industry.
The Commercial Distributed Energy Generation (CDEG) market involves on-site or nearby electricity generation for commercial and industrial facilities, driven by the need for energy resilience, sustainability, cost savings, and regulatory support. It encompasses diverse technologies like solar PV, wind, and microgrids, with major players offering turnkey solutions.
Distributed Energy Generation (DEG) plays a pivotal role in Electric Vehicle (EV) Charging Infrastructure by providing clean, on-site electricity for charging stations, reducing grid strain, enhancing resilience with backup power, lowering operational costs, aligning with sustainability objectives, enabling scalability, and offering regulatory incentives, all contributing to the growth and sustainability of EV charging networks.
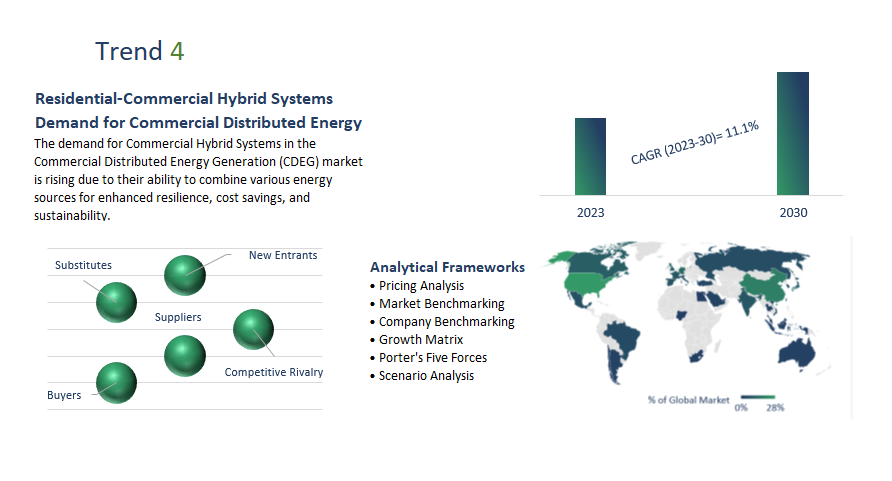
The demand for Commercial Hybrid Systems in the Commercial Distributed Energy Generation (CDEG) market is rising due to their ability to combine various energy sources for enhanced resilience, cost savings, and sustainability. These systems offer continuous power, grid independence, and efficient use of renewables, making them essential for businesses seeking diverse and reliable distributed energy solutions, with further growth expected as technology advances.
Technological advancements in the Commercial Distributed Energy Generation (CDEG) market are leading to increased efficiency in renewable energy sources like solar and wind, improved energy storage capabilities with advanced batteries, and the integration of IoT and AI for real-time energy management. These advancements are enhancing the cost-effectiveness, reliability, and sustainability of CDEG systems, driving their growth and adoption in the market.
The Global Commercial Distributed Energy Generation Market is analyzed across Solar Power Generation, Fuel Cell Power Generation, Wind Power Generation, Gas Turbines, and others. Of these, Solar Power Generation will register the fastest growth. Solar power generation is a crucial element in the Commercial Distributed Energy Generation (CDEG) market, involving the conversion of sunlight into electricity using solar panels located near commercial and industrial facilities. Solar power contributes to sustainability, cost savings, and reduced dependence on centralized utilities, making it increasingly adopted by businesses to lower carbon emissions, cut energy expenses, and enhance energy resilience.
The Global Commercial Distributed Energy Generation Market is analyzed across various applications including On-Grid, Off-Grid, and others. Of these, On-Grid held a significant market share in 2023. In the Commercial Distributed Energy Generation (CDEG) market, "on-grid" refers to systems that generate electricity on-site for commercial and industrial facilities while remaining connected to the traditional electrical grid. These systems enable businesses to offset energy costs, participate in net metering programs, and provide grid support during peak demand, offering a reliable and cost-effective approach to distributed energy generation within a grid-connected framework.
By Technology
By Application
By Region
* List not exhaustive
Commercial Distributed Energy Generation Market Outlook 2023
1 Market Overview
1.1 Introduction to the Commercial Distributed Energy Generation Market
1.2 Scope of the Study
1.3 Research Objective
1.3.1 Key Market Scope and Segments
1.3.2 Players Covered
1.3.3 Years Considered
2 Executive Summary
2.1 2023 Commercial Distributed Energy Generation Industry- Market Statistics
3 Market Dynamics
3.1 Market Drivers
3.2 Market Challenges
3.3 Market Opportunities
3.4 Market Trends
4 Market Factor Analysis
4.1 Porter’s Five Forces
4.2 Market Entropy
4.2.1 Global Commercial Distributed Energy Generation Market Companies with Area Served
4.2.2 Products Offerings Global Commercial Distributed Energy Generation Market
5 COVID-19 Impact Analysis and Outlook Scenarios
5.1.1 Covid-19 Impact Analysis
5.1.2 Post-COVID-19 Scenario- Low Growth Case
5.1.3 Post-COVID-19 Scenario- Reference Growth Case
5.1.4 Post-COVID-19 Scenario- Low Growth Case
6 Global Commercial Distributed Energy Generation Market Trends
6.1 Global Commercial Distributed Energy Generation Revenue (USD Million) and CAGR (%) by Type (2018-2030)
6.2 Global Commercial Distributed Energy Generation Revenue (USD Million) and CAGR (%) by Applications (2018-2030)
6.3 Global Commercial Distributed Energy Generation Revenue (USD Million) and CAGR (%) by Regions (2018-2030)
7 Global Commercial Distributed Energy Generation Market Revenue (USD Million) by Type, and Applications (2018-2022)
7.1 Global Commercial Distributed Energy Generation Revenue (USD Million) by Type (2018-2022)
7.1.1 Global Commercial Distributed Energy Generation Revenue (USD Million), Market Share (%) by Type (2018-2022)
7.2 Global Commercial Distributed Energy Generation Revenue (USD Million) by Applications (2018-2022)
7.2.1 Global Commercial Distributed Energy Generation Revenue (USD Million), Market Share (%) by Applications (2018-2022)
8 Global Commercial Distributed Energy Generation Development Regional Status and Outlook
8.1 Global Commercial Distributed Energy Generation Revenue (USD Million) By Regions (2018-2022)
8.2 North America Commercial Distributed Energy Generation Revenue (USD Million) by Type, and Application (2018-2022)
8.2.1 North America Commercial Distributed Energy Generation Revenue (USD Million) by Country (2018-2022)
8.2.2 North America Commercial Distributed Energy Generation Revenue (USD Million) by Type (2018-2022)
8.2.3 North America Commercial Distributed Energy Generation Revenue (USD Million) by Applications (2018-2022)
8.3 Europe Commercial Distributed Energy Generation Revenue (USD Million), by Type, and Applications (USD Million) (2018-2022)
8.3.1 Europe Commercial Distributed Energy Generation Revenue (USD Million), by Country (2018-2022)
8.3.2 Europe Commercial Distributed Energy Generation Revenue (USD Million) by Type (2018-2022)
8.3.3 Europe Commercial Distributed Energy Generation Revenue (USD Million) by Applications (2018-2022)
8.4 Asia Pacific Commercial Distributed Energy Generation Revenue (USD Million), and Revenue (USD Million) by Type, and Applications (2018-2022)
8.4.1 Asia Pacific Commercial Distributed Energy Generation Revenue (USD Million) by Country (2018-2022)
8.4.2 Asia Pacific Commercial Distributed Energy Generation Revenue (USD Million) by Type (2018-2022)
8.4.3 Asia Pacific Commercial Distributed Energy Generation Revenue (USD Million) by Applications (2018-2022)
8.5 South America Commercial Distributed Energy Generation Revenue (USD Million), by Type, and Applications (2018-2022)
8.5.1 South America Commercial Distributed Energy Generation Revenue (USD Million), by Country (2018-2022)
8.5.2 South America Commercial Distributed Energy Generation Revenue (USD Million) by Type (2018-2022)
8.5.3 South America Commercial Distributed Energy Generation Revenue (USD Million) by Applications (2018-2022)
8.6 Middle East and Africa Commercial Distributed Energy Generation Revenue (USD Million), by Type, Technology, Application, Thickness (2018-2022)
8.6.1 Middle East and Africa Commercial Distributed Energy Generation Revenue (USD Million) by Country (2018-2022)
8.6.2 Middle East and Africa Commercial Distributed Energy Generation Revenue (USD Million) by Type (2018-2022)
8.6.3 Middle East and Africa Commercial Distributed Energy Generation Revenue (USD Million) by Applications (2018-2022)
9 Company Profiles
10 Global Commercial Distributed Energy Generation Market Revenue (USD Million), by Type, and Applications (2023-2030)
10.1 Global Commercial Distributed Energy Generation Revenue (USD Million) and Market Share (%) by Type (2023-2030)
10.1.1 Global Commercial Distributed Energy Generation Revenue (USD Million), and Market Share (%) by Type (2023-2030)
10.2 Global Commercial Distributed Energy Generation Revenue (USD Million) and Market Share (%) by Applications (2023-2030)
10.2.1 Global Commercial Distributed Energy Generation Revenue (USD Million), and Market Share (%) by Applications (2023-2030)
11 Global Commercial Distributed Energy Generation Development Regional Status and Outlook Forecast
11.1 Global Commercial Distributed Energy Generation Revenue (USD Million) By Regions (2023-2030)
11.2 North America Commercial Distributed Energy Generation Revenue (USD Million) by Type, and Applications (2023-2030)
11.2.1 North America Commercial Distributed Energy Generation Revenue (USD) Million by Country (2023-2030)
11.2.2 North America Commercial Distributed Energy Generation Revenue (USD Million), by Type (2023-2030)
11.2.3 North America Commercial Distributed Energy Generation Revenue (USD Million), Market Share (%) by Applications (2023-2030)
11.3 Europe Commercial Distributed Energy Generation Revenue (USD Million), by Type, and Applications (2023-2030)
11.3.1 Europe Commercial Distributed Energy Generation Revenue (USD Million), by Country (2023-2030)
11.3.2 Europe Commercial Distributed Energy Generation Revenue (USD Million), by Type (2023-2030)
11.3.3 Europe Commercial Distributed Energy Generation Revenue (USD Million), by Applications (2023-2030)
11.4 Asia Pacific Commercial Distributed Energy Generation Revenue (USD Million) by Type, and Applications (2023-2030)
11.4.1 Asia Pacific Commercial Distributed Energy Generation Revenue (USD Million), by Country (2023-2030)
11.4.2 Asia Pacific Commercial Distributed Energy Generation Revenue (USD Million), by Type (2023-2030)
11.4.3 Asia Pacific Commercial Distributed Energy Generation Revenue (USD Million), by Applications (2023-2030)
11.5 South America Commercial Distributed Energy Generation Revenue (USD Million), by Type, and Applications (2023-2030)
11.5.1 South America Commercial Distributed Energy Generation Revenue (USD Million), by Country (2023-2030)
11.5.2 South America Commercial Distributed Energy Generation Revenue (USD Million), by Type (2023-2030)
11.5.3 South America Commercial Distributed Energy Generation Revenue (USD Million), by Applications (2023-2030)
11.6 Middle East and Africa Commercial Distributed Energy Generation Revenue (USD Million), by Type, and Applications (2023-2030)
11.6.1 Middle East and Africa Commercial Distributed Energy Generation Revenue (USD Million), by Region (2023-2030)
11.6.2 Middle East and Africa Commercial Distributed Energy Generation Revenue (USD Million), by Type (2023-2030)
11.6.3 Middle East and Africa Commercial Distributed Energy Generation Revenue (USD Million), by Applications (2023-2030)
12 Methodology and Data Sources
12.1 Methodology/Research Approach
12.1.1 Research Programs/Design
12.1.2 Market Size Estimation
12.1.3 Market Breakdown and Data Triangulation
12.2 Data Sources
12.2.1 Secondary Sources
12.2.2 Primary Sources
12.3 Disclaimer
List of Tables
Table 1 Market Segmentation Analysis
Table 2 Global Commercial Distributed Energy Generation Market Companies with Areas Served
Table 3 Products Offerings Global Commercial Distributed Energy Generation Market
Table 4 Low Growth Scenario Forecasts
Table 5 Reference Case Growth Scenario
Table 6 High Growth Case Scenario
Table 7 Global Commercial Distributed Energy Generation Revenue (USD Million) And CAGR (%) By Type (2018-2030)
Table 8 Global Commercial Distributed Energy Generation Revenue (USD Million) And CAGR (%) By Applications (2018-2030)
Table 9 Global Commercial Distributed Energy Generation Revenue (USD Million) And CAGR (%) By Regions (2018-2030)
Table 10 Global Commercial Distributed Energy Generation Revenue (USD Million) By Type (2018-2022)
Table 11 Global Commercial Distributed Energy Generation Revenue Market Share (%) By Type (2018-2022)
Table 12 Global Commercial Distributed Energy Generation Revenue (USD Million) By Applications (2018-2022)
Table 13 Global Commercial Distributed Energy Generation Revenue Market Share (%) By Applications (2018-2022)
Table 14 Global Commercial Distributed Energy Generation Market Revenue (USD Million) By Regions (2018-2022)
Table 15 Global Commercial Distributed Energy Generation Market Share (%) By Regions (2018-2022)
Table 16 North America Commercial Distributed Energy Generation Revenue (USD Million) By Country (2018-2022)
Table 17 North America Commercial Distributed Energy Generation Revenue (USD Million) By Type (2018-2022)
Table 18 North America Commercial Distributed Energy Generation Revenue (USD Million) By Applications (2018-2022)
Table 19 Europe Commercial Distributed Energy Generation Revenue (USD Million) By Country (2018-2022)
Table 20 Europe Commercial Distributed Energy Generation Revenue (USD Million) By Type (2018-2022)
Table 21 Europe Commercial Distributed Energy Generation Revenue (USD Million) By Applications (2018-2022)
Table 22 Asia Pacific Commercial Distributed Energy Generation Revenue (USD Million) By Country (2018-2022)
Table 23 Asia Pacific Commercial Distributed Energy Generation Revenue (USD Million) By Type (2018-2022)
Table 24 Asia Pacific Commercial Distributed Energy Generation Revenue (USD Million) By Applications (2018-2022)
Table 25 South America Commercial Distributed Energy Generation Revenue (USD Million) By Country (2018-2022)
Table 26 South America Commercial Distributed Energy Generation Revenue (USD Million) By Type (2018-2022)
Table 27 South America Commercial Distributed Energy Generation Revenue (USD Million) By Applications (2018-2022)
Table 28 Middle East and Africa Commercial Distributed Energy Generation Revenue (USD Million) By Region (2018-2022)
Table 29 Middle East and Africa Commercial Distributed Energy Generation Revenue (USD Million) By Type (2018-2022)
Table 30 Middle East and Africa Commercial Distributed Energy Generation Revenue (USD Million) By Applications (2018-2022)
Table 31 Financial Analysis
Table 32 Global Commercial Distributed Energy Generation Revenue (USD Million) By Type (2023-2030)
Table 33 Global Commercial Distributed Energy Generation Revenue Market Share (%) By Type (2023-2030)
Table 34 Global Commercial Distributed Energy Generation Revenue (USD Million) By Applications (2023-2030)
Table 35 Global Commercial Distributed Energy Generation Revenue Market Share (%) By Applications (2023-2030)
Table 36 Global Commercial Distributed Energy Generation Market Revenue (USD Million), And Revenue (USD Million) By Regions (2023-2030)
Table 37 North America Commercial Distributed Energy Generation Revenue (USD)By Country (2023-2030)
Table 38 North America Commercial Distributed Energy Generation Revenue (USD Million) By Type (2023-2030)
Table 39 North America Commercial Distributed Energy Generation Revenue (USD Million) By Applications (2023-2030)
Table 40 Europe Commercial Distributed Energy Generation Revenue (USD Million) By Country (2023-2030)
Table 41 Europe Commercial Distributed Energy Generation Revenue (USD Million) By Type (2023-2030)
Table 42 Europe Commercial Distributed Energy Generation Revenue (USD Million) By Applications (2023-2030)
Table 43 Asia Pacific Commercial Distributed Energy Generation Revenue (USD Million) By Country (2023-2030)
Table 44 Asia Pacific Commercial Distributed Energy Generation Revenue (USD Million) By Type (2023-2030)
Table 45 Asia Pacific Commercial Distributed Energy Generation Revenue (USD Million) By Applications (2023-2030)
Table 46 South America Commercial Distributed Energy Generation Revenue (USD Million) By Country (2023-2030)
Table 47 South America Commercial Distributed Energy Generation Revenue (USD Million) By Type (2023-2030)
Table 48 South America Commercial Distributed Energy Generation Revenue (USD Million) By Applications (2023-2030)
Table 49 Middle East and Africa Commercial Distributed Energy Generation Revenue (USD Million) By Region (2023-2030)
Table 50 Middle East and Africa Commercial Distributed Energy Generation Revenue (USD Million) By Region (2023-2030)
Table 51 Middle East and Africa Commercial Distributed Energy Generation Revenue (USD Million) By Type (2023-2030)
Table 52 Middle East and Africa Commercial Distributed Energy Generation Revenue (USD Million) By Applications (2023-2030)
Table 53 Research Programs/Design for This Report
Table 54 Key Data Information from Secondary Sources
Table 55 Key Data Information from Primary Sources
List of Figures
Figure 1 Market Scope
Figure 2 Porter’s Five Forces
Figure 3 Global Commercial Distributed Energy Generation Revenue (USD Million) By Type (2018-2022)
Figure 4 Global Commercial Distributed Energy Generation Revenue Market Share (%) By Type (2022)
Figure 5 Global Commercial Distributed Energy Generation Revenue (USD Million) By Applications (2018-2022)
Figure 6 Global Commercial Distributed Energy Generation Revenue Market Share (%) By Applications (2022)
Figure 7 Global Commercial Distributed Energy Generation Market Revenue (USD Million) By Regions (2018-2022)
Figure 8 Global Commercial Distributed Energy Generation Market Share (%) By Regions (2022)
Figure 9 North America Commercial Distributed Energy Generation Revenue (USD Million) By Country (2018-2022)
Figure 10 North America Commercial Distributed Energy Generation Revenue (USD Million) By Type (2018-2022)
Figure 11 North America Commercial Distributed Energy Generation Revenue (USD Million) By Applications (2018-2022)
Figure 12 Europe Commercial Distributed Energy Generation Revenue (USD Million) By Country (2018-2022)
Figure 13 Europe Commercial Distributed Energy Generation Revenue (USD Million) By Type (2018-2022)
Figure 14 Europe Commercial Distributed Energy Generation Revenue (USD Million) By Applications (2018-2022)
Figure 15 Asia Pacific Commercial Distributed Energy Generation Revenue (USD Million) By Country (2018-2022)
Figure 16 Asia Pacific Commercial Distributed Energy Generation Revenue (USD Million) By Type (2018-2022)
Figure 17 Asia Pacific Commercial Distributed Energy Generation Revenue (USD Million) By Applications (2018-2022)
Figure 18 South America Commercial Distributed Energy Generation Revenue (USD Million) By Country (2018-2022)
Figure 19 South America Commercial Distributed Energy Generation Revenue (USD Million) By Type (2018-2022)
Figure 20 South America Commercial Distributed Energy Generation Revenue (USD Million) By Applications (2018-2022)
Figure 21 Middle East and Africa Commercial Distributed Energy Generation Revenue (USD Million) By Region (2018-2022)
Figure 22 Middle East and Africa Commercial Distributed Energy Generation Revenue (USD Million) By Type (2018-2022)
Figure 23 Middle East and Africa Commercial Distributed Energy Generation Revenue (USD Million) By Applications (2018-2022)
Figure 24 Global Commercial Distributed Energy Generation Revenue (USD Million) By Type (2023-2030)
Figure 25 Global Commercial Distributed Energy Generation Revenue Market Share (%) By Type (2030)
Figure 26 Global Commercial Distributed Energy Generation Revenue (USD Million) By Applications (2023-2030)
Figure 27 Global Commercial Distributed Energy Generation Revenue Market Share (%) By Applications (2030)
Figure 28 Global Commercial Distributed Energy Generation Market Revenue (USD Million) By Regions (2023-2030)
Figure 29 North America Commercial Distributed Energy Generation Revenue (USD Million) By Country (2023-2030)
Figure 30 North America Commercial Distributed Energy Generation Revenue (USD Million) By Type (2023-2030)
Figure 31 North America Commercial Distributed Energy Generation Revenue (USD Million) By Applications (2023-2030)
Figure 32 Europe Commercial Distributed Energy Generation Revenue (USD Million) By Country (2023-2030)
Figure 33 Europe Commercial Distributed Energy Generation Revenue (USD Million) By Type (2023-2030)
Figure 34 Europe Commercial Distributed Energy Generation Revenue (USD Million) By Applications (2023-2030)
Figure 35 Asia Pacific Commercial Distributed Energy Generation Revenue (USD Million) By Country (2023-2030)
Figure 36 Asia Pacific Commercial Distributed Energy Generation Revenue (USD Million) By Type (2023-2030)
Figure 37 Asia Pacific Commercial Distributed Energy Generation Revenue (USD Million) By Applications (2023-2030)
Figure 38 South America Commercial Distributed Energy Generation Revenue (USD Million) By Country (2023-2030)
Figure 39 South America Commercial Distributed Energy Generation Revenue (USD Million) By Type (2023-2030)
Figure 40 South America Commercial Distributed Energy Generation Revenue (USD Million) By Applications (2023-2030)
Figure 41 Middle East and Africa Commercial Distributed Energy Generation Revenue (USD Million) By Region (2023-2030)
Figure 42 Middle East and Africa Commercial Distributed Energy Generation Revenue (USD Million) By Region (2023-2030)
Figure 43 Middle East and Africa Commercial Distributed Energy Generation Revenue (USD Million) By Type (2023-2030)
Figure 44 Middle East and Africa Commercial Distributed Energy Generation Revenue (USD Million) By Applications (2023-2030)
Figure 45 Bottom-Up and Top-Down Approaches For This Report
Figure 46 Data Triangulation
By Technology
By Application
By Region