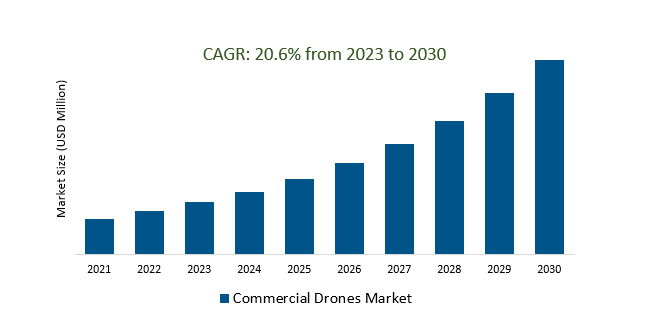
The Global Commercial Drones Market Size is estimated to register 20.6% growth over the forecast period from 2023 to 2030.
The market growth is driven by an increasing integration of commercial drones with 5G networks holds the potential to enhance communication capabilities, enabling real-time data transfer and low-latency control. This could open up new possibilities for applications such as automated drone fleets, remote monitoring, and collaborative drone operations. Leading Companies focusing on Urban Air Mobility (UAM), 5G Integration, Environmental Monitoring and Conservation, and others to boost market shares in the industry.
Market Overview
The commercial drone market has seen significant growth driven by technological advancements, with applications spanning agriculture, construction, oil and gas, delivery services, and environmental monitoring. Key technological trends include improvements in sensor capabilities, autonomous features, and battery technology. Regulatory developments, particularly in enabling beyond-visual line of sight (BVLOS) operations, have played a crucial role. Major players in the market include drone manufacturers, technology providers, and service companies. Anticipated future trends include the integration of drones into urban air mobility, the use of 5G for enhanced communication, and further expansion into sectors like public safety and healthcare.
Market Dynamics
Market Trends- Drones are revolutionizing aerial inspection and surveillance across various industries, enhancing safety, efficiency, and decision-making.
Drones are transforming aerial inspection and surveillance in various industries, enhancing safety and efficiency. With advanced sensor technologies, they access hard-to-reach areas for detailed inspections in fields like infrastructure and construction, reducing manual efforts. In security and emergency response, drones provide real-time situational awareness, aiding swift decision-making. The integration of high-resolution cameras and sensors allows for comprehensive data capture, reshaping traditional approaches and fostering innovation across sectors.
Market Driver- Evolving regulatory frameworks are shaping the demand for commercial drones, fostering innovation, and ensuring responsible integration into airspace.
Evolving regulatory frameworks are driving the demand for commercial drones, fostering innovation and responsible integration into airspace. Governments worldwide are establishing guidelines to balance safety and technological advancement, resulting in a paradigm shift in the industry. Clear regulations, including approvals for beyond visual line of sight (BVLOS) operations, have opened new opportunities for diverse industries. This dynamic interaction between regulators and stakeholders encourages responsible drone use, paving the way for continued growth and diversification in the commercial drone market
Market Opportunity- Rapid technological advancements are fueling the growth of the commercial drone market, enabling new capabilities and expanding the range of applications.
Rapid technological advancements are propelling the growth of the commercial drone market by unlocking new capabilities and expanding applications. Breakthroughs in sensors, artificial intelligence, and autonomous flight features enhance drone performance, while improved battery technology extends flight times. This surge in innovation is driving robust growth in the commercial drone industry, enabling businesses to enhance operational efficiency and explore novel applications in various sectors.
Market Share Analysis- Rotary Blade Commercial Drones Market will register the fastest growth
The Global Commercial Drones Market is analyzed across Fixed-wing, Rotary Blade, Hybrid, and others. Rotary Blade is poised to register the fastest growth. Rotary-blade commercial drones, featuring multiple spinning blades, are a significant segment in the commercial drone market, encompassing quadcopters, hexacopters, and octocopters. Widely used for applications like aerial photography, surveying, and inspection, these drones are valued for their versatility and stability. Market dynamics are influenced by technological advancements, especially in hardware and software, battery technology improvements, and the expanding range of applications across industries. Additionally, regulatory developments and enhanced payload capabilities, such as advanced cameras and sensors, are key factors shaping the market.
Market Share Analysis- Inspection and Maintenance held a significant market share in 2023
The Global Commercial Drones Market is analyzed across various applications including Filming and Photography, Inspection and Maintenance, Mapping and Surveying, Surveillance and Monitoring, Disaster Management, Maritime Security, Traffic Monitoring, and others. Of these, Inspection and Maintenance held a significant market share in 2023. The inspection and maintenance commercial drones market focuses on utilizing unmanned aerial vehicles equipped with advanced sensors for efficient monitoring and assessment of critical infrastructure. Industries such as energy, oil and gas, and construction leverage these drones for tasks such as structural assessments and facility maintenance, leading to cost savings and enhanced safety. The market growth is driven by technological advancements, the integration of artificial intelligence, and regulatory approvals for beyond-visual line-of-sight operations. As industries prioritize preventive maintenance and operational efficiency, the market is expected to witness further expansion.
Commercial Drones Market Segmentation
By Type
- Fixed-wing
- Rotary Blade
- Hybrid
By Application
- Filming and Photography
- Inspection and Maintenance
- Mapping and Surveying
- Surveillance and Monitoring
- Disaster Management
- Maritime Security
- Traffic Monitoring
- Others
By End-User
- Agriculture
- Delivery and Logistics
- Energy
- Media and Entertainment
- Real Estate and Construction
- Security and Law Enforcement
- Others
By Propulsion Type
By Range
- Visual Line of Sight (VLOS)
- Extended Visual Line of Sight (EVLOS)
- Beyond Visual Line of Sight (BVLOS)
By Operating Mode
- Remotely Piloted
- Partially Piloted
- Fully Autonomous
By Endurance
- Less than 5 Hours
- 5 to 10 Hours
- More than 10 Hours
By Maximum Take-off Weight
- Less than 25kg
- 25 to 500 kg
- Above 500 kg
By Region
- North America (United States, Canada, Mexico)
- Europe (Germany, France, United Kingdom, Spain, Italy, Others)
- Asia Pacific (China, India, Japan, South Korea, Australia, Others)
- Latin America (Brazil, Argentina, Others)
- Middle East and Africa (Saudi Arabia, UAE, Kuwait, Other Middle East, South Africa, Nigeria, Other Africa)
Commercial Drones Market Companies
- AeroVironment Inc
- Autel Robotics
- SZ DJI Technology Co Ltd
- Aeronavics Ltd
- Draganfly Innovations Inc
- YUNEEC International
- Intel Corporation
- Parrot Drones SAS
- PrecisionHawk Inc
- Guangzhou EHang Intelligent Technology Co Ltd
*List not exhaustive
Commercial Drones Market Outlook 2023
1 Market Overview
1.1 Introduction to the Commercial Drones Market
1.2 Scope of the Study
1.3 Research Objective
1.3.1 Key Market Scope and Segments
1.3.2 Players Covered
1.3.3 Years Considered
2 Executive Summary
2.1 2023 Commercial Drones Industry- Market Statistics
3 Market Dynamics
3.1 Market Drivers
3.2 Market Challenges
3.3 Market Opportunities
3.4 Market Trends
4 Market Factor Analysis
4.1 Porter’s Five Forces
4.2 Market Entropy
4.2.1 Global Commercial Drones Market Companies with Area Served
4.2.2 Products Offerings Global Commercial Drones Market
5 COVID-19 Impact Analysis and Outlook Scenarios
5.1.1 Covid-19 Impact Analysis
5.1.2 post-COVID-19 Scenario- Low Growth Case
5.1.3 post-COVID-19 Scenario- Reference Growth Case
5.1.4 post-COVID-19 Scenario- Low Growth Case
6 Global Commercial Drones Market Trends
6.1 Global Commercial Drones Revenue (USD Million) and CAGR (%) by Type (2018-2030)
6.2 Global Commercial Drones Revenue (USD Million) and CAGR (%) by Applications (2018-2030)
6.3 Global Commercial Drones Revenue (USD Million) and CAGR (%) by regions (2018-2030)
7 Global Commercial Drones Market Revenue (USD Million) by Type, and Applications (2018-2022)
7.1 Global Commercial Drones Revenue (USD Million) by Type (2018-2022)
7.1.1 Global Commercial Drones Revenue (USD Million), Market Share (%) by Type (2018-2022)
7.2 Global Commercial Drones Revenue (USD Million) by Applications (2018-2022)
7.2.1 Global Commercial Drones Revenue (USD Million), Market Share (%) by Applications (2018-2022)
8 Global Commercial Drones Development Regional Status and Outlook
8.1 Global Commercial Drones Revenue (USD Million) By Regions (2018-2022)
8.2 North America Commercial Drones Revenue (USD Million) by Type, and Application (2018-2022)
8.2.1 North America Commercial Drones Revenue (USD Million) by Country (2018-2022)
8.2.2 North America Commercial Drones Revenue (USD Million) by Type (2018-2022)
8.2.3 North America Commercial Drones Revenue (USD Million) by Applications (2018-2022)
8.3 Europe Commercial Drones Revenue (USD Million), by Type, and Applications (USD Million) (2018-2022)
8.3.1 Europe Commercial Drones Revenue (USD Million), by Country (2018-2022)
8.3.2 Europe Commercial Drones Revenue (USD Million) by Type (2018-2022)
8.3.3 Europe Commercial Drones Revenue (USD Million) by Applications (2018-2022)
8.4 Asia Pacific Commercial Drones Revenue (USD Million), and Revenue (USD Million) by Type, and Applications (2018-2022)
8.4.1 Asia Pacific Commercial Drones Revenue (USD Million) by Country (2018-2022)
8.4.2 Asia Pacific Commercial Drones Revenue (USD Million) by Type (2018-2022)
8.4.3 Asia Pacific Commercial Drones Revenue (USD Million) by Applications (2018-2022)
8.5 South America Commercial Drones Revenue (USD Million), by Type, and Applications (2018-2022)
8.5.1 South America Commercial Drones Revenue (USD Million), by Country (2018-2022)
8.5.2 South America Commercial Drones Revenue (USD Million) by Type (2018-2022)
8.5.3 South America Commercial Drones Revenue (USD Million) by Applications (2018-2022)
8.6 Middle East and Africa Commercial Drones Revenue (USD Million), by Type, Technology, Application, Thickness (2018-2022)
8.6.1 Middle East and Africa Commercial Drones Revenue (USD Million) by Country (2018-2022)
8.6.2 Middle East and Africa Commercial Drones Revenue (USD Million) by Type (2018-2022)
8.6.3 Middle East and Africa Commercial Drones Revenue (USD Million) by Applications (2018-2022)
9 Company Profiles
10 Global Commercial Drones Market Revenue (USD Million), by Type, and Applications (2023-2030)
10.1 Global Commercial Drones Revenue (USD Million) and Market Share (%) by Type (2023-2030)
10.1.1 Global Commercial Drones Revenue (USD Million), and Market Share (%) by Type (2023-2030)
10.2 Global Commercial Drones Revenue (USD Million) and Market Share (%) by Applications (2023-2030)
10.2.1 Global Commercial Drones Revenue (USD Million), and Market Share (%) by Applications (2023-2030)
11 Global Commercial Drones Development Regional Status and Outlook Forecast
11.1 Global Commercial Drones Revenue (USD Million) By Regions (2023-2030)
11.2 North America Commercial Drones Revenue (USD Million) by Type, and Applications (2023-2030)
11.2.1 North America Commercial Drones Revenue (USD) Million by Country (2023-2030)
11.2.2 North America Commercial Drones Revenue (USD Million), by Type (2023-2030)
11.2.3 North America Commercial Drones Revenue (USD Million), Market Share (%) by Applications (2023-2030)
11.3 Europe Commercial Drones Revenue (USD Million), by Type, and Applications (2023-2030)
11.3.1 Europe Commercial Drones Revenue (USD Million), by Country (2023-2030)
11.3.2 Europe Commercial Drones Revenue (USD Million), by Type (2023-2030)
11.3.3 Europe Commercial Drones Revenue (USD Million), by Applications (2023-2030)
11.4 Asia Pacific Commercial Drones Revenue (USD Million) by Type, and Applications (2023-2030)
11.4.1 Asia Pacific Commercial Drones Revenue (USD Million), by Country (2023-2030)
11.4.2 Asia Pacific Commercial Drones Revenue (USD Million), by Type (2023-2030)
11.4.3 Asia Pacific Commercial Drones Revenue (USD Million), by Applications (2023-2030)
11.5 South America Commercial Drones Revenue (USD Million), by Type, and Applications (2023-2030)
11.5.1 South America Commercial Drones Revenue (USD Million), by Country (2023-2030)
11.5.2 South America Commercial Drones Revenue (USD Million), by Type (2023-2030)
11.5.3 South America Commercial Drones Revenue (USD Million), by Applications (2023-2030)
11.6 Middle East and Africa Commercial Drones Revenue (USD Million), by Type, and Applications (2023-2030)
11.6.1 Middle East and Africa Commercial Drones Revenue (USD Million), by region (2023-2030)
11.6.2 Middle East and Africa Commercial Drones Revenue (USD Million), by Type (2023-2030)
11.6.3 Middle East and Africa Commercial Drones Revenue (USD Million), by Applications (2023-2030)
12 Methodology and Data Sources
12.1 Methodology/Research Approach
12.1.1 Research Programs/Design
12.1.2 Market Size Estimation
12.1.3 Market Breakdown and Data Triangulation
12.2 Data Sources
12.2.1 Secondary Sources
12.2.2 Primary Sources
12.3 Disclaimer
List of Tables
Table 1 Market Segmentation Analysis
Table 2 Global Commercial Drones Market Companies with Areas Served
Table 3 Products Offerings Global Commercial Drones Market
Table 4 Low Growth Scenario Forecasts
Table 5 Reference Case Growth Scenario
Table 6 High Growth Case Scenario
Table 7 Global Commercial Drones Revenue (USD Million) And CAGR (%) By Type (2018-2030)
Table 8 Global Commercial Drones Revenue (USD Million) And CAGR (%) By Applications (2018-2030)
Table 9 Global Commercial Drones Revenue (USD Million) And CAGR (%) By Regions (2018-2030)
Table 10 Global Commercial Drones Revenue (USD Million) By Type (2018-2022)
Table 11 Global Commercial Drones Revenue Market Share (%) By Type (2018-2022)
Table 12 Global Commercial Drones Revenue (USD Million) By Applications (2018-2022)
Table 13 Global Commercial Drones Revenue Market Share (%) By Applications (2018-2022)
Table 14 Global Commercial Drones Market Revenue (USD Million) By Regions (2018-2022)
Table 15 Global Commercial Drones Market Share (%) By Regions (2018-2022)
Table 16 North America Commercial Drones Revenue (USD Million) By Country (2018-2022)
Table 17 North America Commercial Drones Revenue (USD Million) By Type (2018-2022)
Table 18 North America Commercial Drones Revenue (USD Million) By Applications (2018-2022)
Table 19 Europe Commercial Drones Revenue (USD Million) By Country (2018-2022)
Table 20 Europe Commercial Drones Revenue (USD Million) By Type (2018-2022)
Table 21 Europe Commercial Drones Revenue (USD Million) By Applications (2018-2022)
Table 22 Asia Pacific Commercial Drones Revenue (USD Million) By Country (2018-2022)
Table 23 Asia Pacific Commercial Drones Revenue (USD Million) By Type (2018-2022)
Table 24 Asia Pacific Commercial Drones Revenue (USD Million) By Applications (2018-2022)
Table 25 South America Commercial Drones Revenue (USD Million) By Country (2018-2022)
Table 26 South America Commercial Drones Revenue (USD Million) By Type (2018-2022)
Table 27 South America Commercial Drones Revenue (USD Million) By Applications (2018-2022)
Table 28 Middle East and Africa Commercial Drones Revenue (USD Million) By Region (2018-2022)
Table 29 Middle East and Africa Commercial Drones Revenue (USD Million) By Type (2018-2022)
Table 30 Middle East and Africa Commercial Drones Revenue (USD Million) By Applications (2018-2022)
Table 31 Financial Analysis
Table 32 Global Commercial Drones Revenue (USD Million) By Type (2023-2030)
Table 33 Global Commercial Drones Revenue Market Share (%) By Type (2023-2030)
Table 34 Global Commercial Drones Revenue (USD Million) By Applications (2023-2030)
Table 35 Global Commercial Drones Revenue Market Share (%) By Applications (2023-2030)
Table 36 Global Commercial Drones Market Revenue (USD Million), And Revenue (USD Million) By Regions (2023-2030)
Table 37 North America Commercial Drones Revenue (USD)By Country (2023-2030)
Table 38 North America Commercial Drones Revenue (USD Million) By Type (2023-2030)
Table 39 North America Commercial Drones Revenue (USD Million) By Applications (2023-2030)
Table 40 Europe Commercial Drones Revenue (USD Million) By Country (2023-2030)
Table 41 Europe Commercial Drones Revenue (USD Million) By Type (2023-2030)
Table 42 Europe Commercial Drones Revenue (USD Million) By Applications (2023-2030)
Table 43 Asia Pacific Commercial Drones Revenue (USD Million) By Country (2023-2030)
Table 44 Asia Pacific Commercial Drones Revenue (USD Million) By Type (2023-2030)
Table 45 Asia Pacific Commercial Drones Revenue (USD Million) By Applications (2023-2030)
Table 46 South America Commercial Drones Revenue (USD Million) By Country (2023-2030)
Table 47 South America Commercial Drones Revenue (USD Million) By Type (2023-2030)
Table 48 South America Commercial Drones Revenue (USD Million) By Applications (2023-2030)
Table 49 Middle East and Africa Commercial Drones Revenue (USD Million) By Region (2023-2030)
Table 50 Middle East and Africa Commercial Drones Revenue (USD Million) By Region (2023-2030)
Table 51 Middle East and Africa Commercial Drones Revenue (USD Million) By Type (2023-2030)
Table 52 Middle East and Africa Commercial Drones Revenue (USD Million) By Applications (2023-2030)
Table 53 Research Programs/Design for This Report
Table 54 Key Data Information from Secondary Sources
Table 55 Key Data Information from Primary Sources
List of Figures
Figure 1 Market Scope
Figure 2 Porter’s Five Forces
Figure 3 Global Commercial Drones Revenue (USD Million) By Type (2018-2022)
Figure 4 Global Commercial Drones Revenue Market Share (%) By Type (2022)
Figure 5 Global Commercial Drones Revenue (USD Million) By Applications (2018-2022)
Figure 6 Global Commercial Drones Revenue Market Share (%) By Applications (2022)
Figure 7 Global Commercial Drones Market Revenue (USD Million) By Regions (2018-2022)
Figure 8 Global Commercial Drones Market Share (%) By Regions (2022)
Figure 9 North America Commercial Drones Revenue (USD Million) By Country (2018-2022)
Figure 10 North America Commercial Drones Revenue (USD Million) By Type (2018-2022)
Figure 11 North America Commercial Drones Revenue (USD Million) By Applications (2018-2022)
Figure 12 Europe Commercial Drones Revenue (USD Million) By Country (2018-2022)
Figure 13 Europe Commercial Drones Revenue (USD Million) By Type (2018-2022)
Figure 14 Europe Commercial Drones Revenue (USD Million) By Applications (2018-2022)
Figure 15 Asia Pacific Commercial Drones Revenue (USD Million) By Country (2018-2022)
Figure 16 Asia Pacific Commercial Drones Revenue (USD Million) By Type (2018-2022)
Figure 17 Asia Pacific Commercial Drones Revenue (USD Million) By Applications (2018-2022)
Figure 18 South America Commercial Drones Revenue (USD Million) By Country (2018-2022)
Figure 19 South America Commercial Drones Revenue (USD Million) By Type (2018-2022)
Figure 20 South America Commercial Drones Revenue (USD Million) By Applications (2018-2022)
Figure 21 Middle East and Africa Commercial Drones Revenue (USD Million) By Region (2018-2022)
Figure 22 Middle East and Africa Commercial Drones Revenue (USD Million) By Type (2018-2022)
Figure 23 Middle East and Africa Commercial Drones Revenue (USD Million) By Applications (2018-2022)
Figure 24 Global Commercial Drones Revenue (USD Million) By Type (2023-2030)
Figure 25 Global Commercial Drones Revenue Market Share (%) By Type (2030)
Figure 26 Global Commercial Drones Revenue (USD Million) By Applications (2023-2030)
Figure 27 Global Commercial Drones Revenue Market Share (%) By Applications (2030)
Figure 28 Global Commercial Drones Market Revenue (USD Million) By Regions (2023-2030)
Figure 29 North America Commercial Drones Revenue (USD Million) By Country (2023-2030)
Figure 30 North America Commercial Drones Revenue (USD Million) By Type (2023-2030)
Figure 31 North America Commercial Drones Revenue (USD Million) By Applications (2023-2030)
Figure 32 Europe Commercial Drones Revenue (USD Million) By Country (2023-2030)
Figure 33 Europe Commercial Drones Revenue (USD Million) By Type (2023-2030)
Figure 34 Europe Commercial Drones Revenue (USD Million) By Applications (2023-2030)
Figure 35 Asia Pacific Commercial Drones Revenue (USD Million) By Country (2023-2030)
Figure 36 Asia Pacific Commercial Drones Revenue (USD Million) By Type (2023-2030)
Figure 37 Asia Pacific Commercial Drones Revenue (USD Million) By Applications (2023-2030)
Figure 38 South America Commercial Drones Revenue (USD Million) By Country (2023-2030)
Figure 39 South America Commercial Drones Revenue (USD Million) By Type (2023-2030)
Figure 40 South America Commercial Drones Revenue (USD Million) By Applications (2023-2030)
Figure 41 Middle East and Africa Commercial Drones Revenue (USD Million) By Region (2023-2030)
Figure 42 Middle East and Africa Commercial Drones Revenue (USD Million) By Region (2023-2030)
Figure 43 Middle East and Africa Commercial Drones Revenue (USD Million) By Type (2023-2030)
Figure 44 Middle East and Africa Commercial Drones Revenue (USD Million) By Applications (2023-2030)
Figure 45 Bottom-Up and Top-Down Approaches for This Report
Figure 46 Data Triangulation
