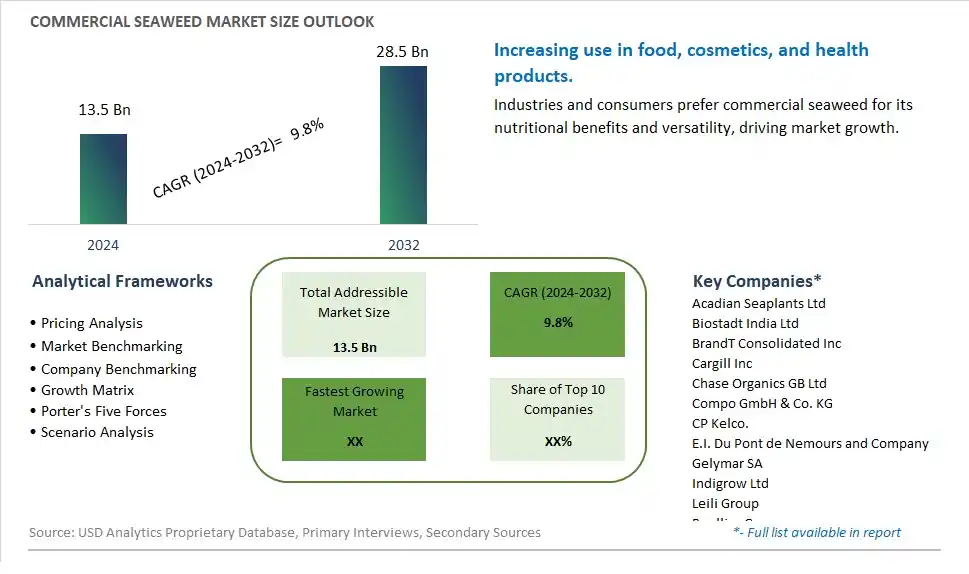
Global Commercial Seaweed Market Size is valued at $13.5 Billion in 2024 and is forecast to register a growth rate (CAGR) of 9.8% to reach $28.5 Billion by 2032.
The global Commercial Seaweed Market Comprehensive Study analyzes and forecasts the market size across 6 regions and 24 countries for diverse segments -By Product (Brown seaweed, Red seaweed, Green seaweed), By Application (Agriculture, Animal Feed, Human Consumption, Others), By Form (Leaf, Powder, Flakes)
An Introduction to Commercial Seaweed Market
The Commercial Seaweed market in 2024 is expanding rapidly, driven by the increasing demand for nutrient-rich and sustainable food and industrial ingredients. Seaweed, valued for its high content of vitamins, minerals, and bioactive compounds, is used in various applications including food, cosmetics, pharmaceuticals, and agriculture. The market is supported by the growing trend towards plant-based and functional foods. Advances in seaweed cultivation and processing technologies are enhancing the quality, safety, and availability of commercial seaweed products. The market is also benefiting from the trend towards sustainable and environmentally friendly ingredients, appealing to industries and consumers seeking high-quality and responsible seaweed solutions.
Commercial Seaweed Competitive Landscape
The market report analyses the leading companies in the industry including Acadian Seaplants Ltd, Biostadt India Ltd, BrandT Consolidated Inc, Cargill Inc, Chase Organics GB Ltd, Compo GmbH & Co. KG, CP Kelco., E.I. Du Pont de Nemours and Company, Gelymar SA, Indigrow Ltd, Leili Group, Roullier Group, Seasol International Pty. Ltd, Travena Organic Solutions Ltd , West Coast Marine Bio-Processing Corp, and Others.
Commercial Seaweed Market Dynamics
Commercial Seaweed Market Trend: Increasing Demand for Sustainable and Nutrient-Rich Foods
A prominent market trend in the Commercial Seaweed sector is the increasing demand for sustainable and nutrient-rich foods. Seaweed is gaining popularity as a versatile and healthy ingredient due to its high nutritional content, including vitamins, minerals, antioxidants, and omega-3 fatty acids. Consumers are attracted to seaweed-based products for their health benefits, environmental sustainability, and unique flavor profiles, driving the growth of the commercial seaweed market.
Commercial Seaweed Market Driver: Health and Wellness Conscious Consumer Behavior
The market for Commercial Seaweed is primarily driven by health and wellness-conscious consumer behavior. As consumers become more aware of the health benefits associated with seaweed consumption, including its potential to support immune function, heart health, and weight management, there is a growing demand for seaweed-based products in various food and beverage categories. The driver is reinforced by the perception of seaweed as a natural and nutritious superfood, contributing to its popularity among health-conscious individuals.
Commercial Seaweed Market Opportunity: Diversification of Seaweed-Based Products
An opportunity within the Commercial Seaweed market lies in the diversification of seaweed-based products. Manufacturers can explore new product categories and formulations incorporating seaweed, such as snacks, condiments, sauces, beverages, and functional food products. Additionally, there's potential for developing innovative processing techniques, flavor profiles, and packaging formats to enhance the appeal and versatility of seaweed as an ingredient. By leveraging the nutritional benefits and sustainability aspects of seaweed, companies can capitalize on the growing consumer interest in healthy and eco-friendly food choices and expand their market reach.
Commercial Seaweed Market Share Analysis: Brown Seaweed segment generated the highest revenue share in the industry
The largest segment in the Commercial Seaweed Market is Brown Seaweed. Brown seaweed holds a prominent position in the market due to its versatile applications and nutritional benefits. Brown seaweed is rich in essential nutrients like vitamins, minerals, and antioxidants, making it highly desirable in various industries such as food, pharmaceuticals, cosmetics, and agriculture. In the food sector, brown seaweed is used in the production of various products such as seaweed snacks, sushi rolls, soups, and salads, adding a unique flavor profile and nutritional value. Its high content of alginate, a natural polysaccharide, also makes it a valuable ingredient in food processing as a thickening and stabilizing agent. Further, brown seaweed extracts are utilized in the pharmaceutical and nutraceutical industries for their potential health benefits, including anti-inflammatory, antioxidant, and immune-boosting properties. Additionally, brown seaweed is increasingly being explored for its applications in biofuels, animal feed, and bioplastics, contributing to its substantial market share and growth prospects in the Commercial Seaweed Market.
Commercial Seaweed Market Share Analysis: Human Consumption is the fastest growing segment over the forecast period to 2032
The Human Consumption segment is the fastest growing in the Commercial Seaweed Market, showing remarkable growth potential up to 2032. This surge is primarily fueled by increasing consumer awareness regarding the health benefits of seaweed consumption. Seaweed is recognized for its rich nutritional profile, containing essential vitamins, minerals, antioxidants, and unique bioactive compounds such as polysaccharides and polyphenols. As a result, there is a growing demand for seaweed-based products in the food and beverage industry, including snacks, salads, sushi, soups, sauces, and beverages. Seaweed is also gaining traction as a plant-based alternative in various food formulations, catering to the rising trend of vegetarian and vegan diets. Furthermore, ongoing research and development initiatives are exploring innovative ways to incorporate seaweed into functional foods, dietary supplements, and nutraceuticals, amplifying its appeal among health-conscious consumers. This rapid expansion in the Human Consumption segment underscores the immense market opportunities and potential for seaweed-based products in the coming years.
Commercial Seaweed Market Share Analysis: Leaf segment generated the highest revenue share in the industry
The Leaf segment stands out as the largest in the Commercial Seaweed Market, commanding a significant share of the market. This dominance can be attributed to several factors. Firstly, seaweed in leaf form offers versatility in culinary applications, making it a preferred choice for various food preparations such as salads, wraps, and sushi. Its distinct texture and flavor profile contribute to enhancing the sensory appeal of dishes, thereby driving its adoption in restaurants, food service establishments, and households. Further, the leaf form retains the nutritional integrity of seaweed, ensuring that consumers benefit from its rich nutrient content, including vitamins, minerals, and antioxidants. As health-conscious consumer preferences continue to evolve, the leaf form of seaweed aligns well with the demand for natural, plant-based ingredients that promote well-being. Additionally, advancements in processing technologies have improved the shelf life and quality of seaweed leaves, further boosting their market presence and consumer acceptance. Overall, the Leaf segment's prominence underscores its widespread usage across various food sectors and its integral role in the Commercial Seaweed Market.
Commercial Seaweed Market Segmentation
By Product
Brown seaweed
Red seaweed
Green seaweed
By Application
Agriculture
Animal Feed
Human Consumption
Others
By Form
Leaf
Powder
Flakes
Countries Analyzed
North America (US, Canada, Mexico)
Europe (Germany, UK, France, Spain, Italy, Russia, Rest of Europe)
Asia Pacific (China, India, Japan, South Korea, Australia, South East Asia, Rest of Asia)
South America (Brazil, Argentina, Rest of South America)
Middle East and Africa (Saudi Arabia, UAE, Rest of Middle East, South Africa, Egypt, Rest of Africa)
Commercial Seaweed Companies Profiled in the Study
Acadian Seaplants Ltd
Biostadt India Ltd
BrandT Consolidated Inc
Cargill Inc
Chase Organics GB Ltd
Compo GmbH & Co. KG
CP Kelco.
E.I. Du Pont de Nemours and Company
Gelymar SA
Indigrow Ltd
Leili Group
Roullier Group
Seasol International Pty. Ltd
Travena Organic Solutions Ltd
West Coast Marine Bio-Processing Corp
*- List Not Exhaustive
Chapter 1. TABLE OF CONTENTS
Chapter 2. Introduction to Commercial Seaweed Market
2.1. Market Overview
2.2. Key Statistics and Report Highlights
2.3. Scope of the Comprehensive Study
2.3.1. Market Definition
2.3.2 Countries and Regions Covered
2.3.3 Research Objective
2.3.4 Units, Currency, and Conversions
2.3.5 Industry Value Chain
2.4. Key Market Segments
2.5. Key Companies
2.6. Study Period
Chapter 3. Strategic Analysis Review
3.1. Commercial Seaweed Pricing Analysis and Forecast
3.2. Porter’s Five Forces
3.3. Market Ecosystem
3.4. SWOT Analysis
3.5. Regulatory Scenario
3.3. Effects of Inflation, Russia-Ukraine War, moderating economic growth, and other macroeconomic factors
Chapter 4. Competitive Landscape
4.1. Market Share Analysis
4.1.1. Global Commercial Seaweed Market Share by Company, 2023
4.1.2. Product Offerings of Leading Commercial Seaweed Companies
4.2. Market Entropy
4.2.1. New Product Launches in the Industry
4.2.2. Mergers, Acquisitions, Joint ventures, and Partnerships
4.3. Key Strategies and Best Practices
Chapter 5. Global Market Projections: Best, Reference, and Low Case Scenarios
5.1. Growth Analysis- Case Scenario Definitions
5.2. Low Growth Case Scenario Forecasts
5.3. Reference Growth Case Scenario Forecasts
5.4. High Growth Case Scenario Forecasts
Chapter 6. Market Dynamics
6.1. Commercial Seaweed Market Drivers
6.2. Commercial Seaweed Market Challenges
6.6. Commercial Seaweed Market Opportunities
6.4. Commercial Seaweed Market Trends
Chapter 7. Global Commercial Seaweed Market Outlook Trends
7.1. Global Commercial Seaweed Revenue (USD Million) and CAGR (%) by Type (2021-2032)
7.2. Global Commercial Seaweed Revenue (USD Million) and CAGR (%) by Application (2021-2032)
7.3. Global Commercial Seaweed Revenue (USD Million) and CAGR (%) by Product (2021-2032)
By Product
Brown seaweed
Red seaweed
Green seaweed
By Application
Agriculture
Animal Feed
Human Consumption
Others
By Form
Leaf
Powder
Flakes
Chapter 8. Global Commercial Seaweed Regional Analysis and Outlook
8.1. Global Commercial Seaweed Revenue (USD Million) By Regions (2021- 2032)
8.2. North America Commercial Seaweed Revenue (USD Million) by Country (2021-2032)
8.2.1. United States Commercial Seaweed Regional Analysis and Outlook
8.2.2. Canada Commercial Seaweed Regional Analysis and Outlook
8.2.3. Mexico Commercial Seaweed Regional Analysis and Outlook
8.3. Europe Commercial Seaweed Revenue (USD Million), by Country (2021-2032)
8.3.1. Germany Commercial Seaweed Regional Analysis and Outlook
8.3.2. France Commercial Seaweed Regional Analysis and Outlook
8.3.3. United Kingdom Commercial Seaweed Regional Analysis and Outlook
8.3.4. Spain Commercial Seaweed Regional Analysis and Outlook
8.3.5. Italy Commercial Seaweed Regional Analysis and Outlook
8.3.6. Russia Commercial Seaweed Regional Analysis and Outlook
8.3.7. Rest of Europe Commercial Seaweed Regional Analysis and Outlook
8.4. Asia Pacific Commercial Seaweed Revenue (USD Million) by Country (2021-2032)
8.4.1. China Commercial Seaweed Regional Analysis and Outlook
8.4.2. Japan Commercial Seaweed Regional Analysis and Outlook
8.4.3. India Commercial Seaweed Regional Analysis and Outlook
8.4.4. South Korea Commercial Seaweed Regional Analysis and Outlook
8.4.5. Australia Commercial Seaweed Regional Analysis and Outlook
8.4.6. South East Asia Commercial Seaweed Regional Analysis and Outlook
8.4.7. Rest of Asia Pacific Commercial Seaweed Regional Analysis and Outlook
8.5. South America Commercial Seaweed Revenue (USD Million), by Country (2021-2032)
8.5.1. Brazil Commercial Seaweed Regional Analysis and Outlook
8.5.2. Argentina Commercial Seaweed Regional Analysis and Outlook
8.5.3. Rest of South America Commercial Seaweed Regional Analysis and Outlook
8.6. Middle East and Africa Commercial Seaweed Revenue (USD Million) by Country (2021-2032)
8.6.1. Middle East Commercial Seaweed Regional Analysis and Outlook
8.6.2. Africa Commercial Seaweed Regional Analysis and Outlook
Chapter 9. North America Commercial Seaweed Analysis and Outlook
9.1. North America Commercial Seaweed Revenue (USD Million) by Segments (2021-2032)
9.1.1. North America Commercial Seaweed Revenue (USD Million) by Type (2021-2032)
9.1.2. North America Commercial Seaweed Revenue (USD Million) by Application (2021-2032)
9.1.3. North America Commercial Seaweed Revenue (USD Million) by Product (2021-2032)
By Product
Brown seaweed
Red seaweed
Green seaweed
By Application
Agriculture
Animal Feed
Human Consumption
Others
By Form
Leaf
Powder
Flakes
Chapter 10. Europe Commercial Seaweed Analysis and Outlook
10.1. Europe Commercial Seaweed Revenue (USD Million), by Segments (USD Million) (2021-2032)
10.1.1. Europe Commercial Seaweed Revenue (USD Million) by Type (2021-2032)
10.1.2. Europe Commercial Seaweed Revenue (USD Million) by Application (2021-2032)
10.1.3. Europe Commercial Seaweed Revenue (USD Million) by Product (2021-2032)
By Product
Brown seaweed
Red seaweed
Green seaweed
By Application
Agriculture
Animal Feed
Human Consumption
Others
By Form
Leaf
Powder
Flakes
Chapter 11. Asia Pacific Commercial Seaweed Analysis and Outlook
11.1. Asia Pacific Commercial Seaweed Revenue (USD Million), and Revenue (USD Million) by Segments (2021-2032)
11.1.1. Asia Pacific Commercial Seaweed Revenue (USD Million) by Type (2021-2032)
11.1.2. Asia Pacific Commercial Seaweed Revenue (USD Million) by Application (2021-2032)
11.1.3. Asia Pacific Commercial Seaweed Revenue (USD Million) by Product (2021-2032)
By Product
Brown seaweed
Red seaweed
Green seaweed
By Application
Agriculture
Animal Feed
Human Consumption
Others
By Form
Leaf
Powder
Flakes
Chapter 12. South America Commercial Seaweed Analysis and Outlook
12.1. South America Commercial Seaweed Revenue (USD Million), by Segments (2021-2032)
12.1.1. South America Commercial Seaweed Revenue (USD Million) by Type (2021-2032)
12.1.2. South America Commercial Seaweed Revenue (USD Million) by Application (2021-2032)
12.1.3. South America Commercial Seaweed Revenue (USD Million) by Product (2021-2032)
By Product
Brown seaweed
Red seaweed
Green seaweed
By Application
Agriculture
Animal Feed
Human Consumption
Others
By Form
Leaf
Powder
Flakes
Chapter 13. Middle East and Africa Commercial Seaweed Analysis and Outlook
13.1. Middle East and Africa Commercial Seaweed Revenue (USD Million), by Segments (2021-2032)
13.1.1. Middle East and Africa Commercial Seaweed Revenue (USD Million) by Type (2021-2032)
13.1.2. Middle East and Africa Commercial Seaweed Revenue (USD Million) by Application (2021-2032)
13.1.3. Middle East and Africa Commercial Seaweed Revenue (USD Million) by Product (2021-2032)
By Product
Brown seaweed
Red seaweed
Green seaweed
By Application
Agriculture
Animal Feed
Human Consumption
Others
By Form
Leaf
Powder
Flakes
Chapter 14. Commercial Seaweed Company Profiles
14.1 Business Overview
14.2 Product Profiles
14.3 SWOT Profiles
14.5 Recent Developments
14.6 Financial Profile
List of Companies
Acadian Seaplants Ltd
Biostadt India Ltd
BrandT Consolidated Inc
Cargill Inc
Chase Organics GB Ltd
Compo GmbH & Co. KG
CP Kelco.
E.I. Du Pont de Nemours and Company
Gelymar SA
Indigrow Ltd
Leili Group
Roullier Group
Seasol International Pty. Ltd
Travena Organic Solutions Ltd
West Coast Marine Bio-Processing Corp
15. Methodology and Data Sources
15.1 Customization Offerings
15.2 Subscription Services
15.3 Related Reports
15.4 Publisher Expertise
LIST OF TABLES
Table 1 Market Segmentation Analysis
Table 2 Global Commercial Seaweed Market Share of Leading Companies, 2023
Table 3 Product Offerings of Leading Companies
Table 4 Low Growth Scenario Forecasts
Table 5 Reference Case Growth Scenario
Table 6 High Growth Case Scenario
Table 7 Global Commercial Seaweed Revenue (USD Million) And CAGR (%) By Type (2021-2032)
Table 8 Global Commercial Seaweed Revenue (USD Million) And CAGR (%) By Application (2021-2032)
Table 9 Global Commercial Seaweed Revenue (USD Million) And CAGR (%) By Product (2021-2032)
Table 10 Global Commercial Seaweed Market Revenue (USD Million) By Regions (2021-2032)
Table 11 Global Commercial Seaweed Market Share (%) By Regions (2021-2032)
Table 12 North America Commercial Seaweed Revenue (USD Million) By Country (2021-2032)
Table 13 Europe Commercial Seaweed Revenue (USD Million) By Country (2021-2032)
Table 14 Asia Pacific Commercial Seaweed Revenue (USD Million) By Country (2021-2032)
Table 15 South America Commercial Seaweed Revenue (USD Million) By Country (2021-2032)
Table 16 Middle East and Africa Commercial Seaweed Revenue (USD Million) By Region (2021-2032)
Table 17 North America Commercial Seaweed Revenue (USD Million) By Type (2021-2032)
Table 18 North America Commercial Seaweed Revenue (USD Million) By Application (2021-2032)
Table 19 North America Commercial Seaweed Revenue (USD Million) By Product (2021-2032)
Table 20 Europe Commercial Seaweed Revenue (USD Million) By Type (2021-2032)
Table 21 Europe Commercial Seaweed Revenue (USD Million) By Application (2021-2032)
Table 22 Europe Commercial Seaweed Revenue (USD Million) By Product (2021-2032)
Table 23 Asia Pacific Commercial Seaweed Revenue (USD Million) By Type (2021-2032)
Table 24 Asia Pacific Commercial Seaweed Revenue (USD Million) By Application (2021-2032)
Table 25 Asia Pacific Commercial Seaweed Revenue (USD Million) By Product (2021-2032)
Table 26 South America Commercial Seaweed Revenue (USD Million) By Type (2021-2032)
Table 27 South America Commercial Seaweed Revenue (USD Million) By Application (2021-2032)
Table 28 South America Commercial Seaweed Revenue (USD Million) By Product (2021-2032)
Table 29 Middle East and Africa Commercial Seaweed Revenue (USD Million) By Type (2021-2032)
Table 30 Middle East and Africa Commercial Seaweed Revenue (USD Million) By Application (2021-2032)
Table 31 Middle East and Africa Commercial Seaweed Revenue (USD Million) By Product (2021-2032)
LIST OF FIGURES
Figure 1. Market Scope
Figure 2. Pricing Forecasts Per Unit, 2023- 2032
Figure 3. Porter’s Five Forces
Figure 4. Global Commercial Seaweed Market Revenue (USD Million) By Regions (2021-2032)
Figure 5. Global Commercial Seaweed Market Share (%) By Regions (2023)
Figure 6. North America Commercial Seaweed Revenue (USD Million) By Country (2021-2032)
Figure 7. United States Commercial Seaweed Revenue (USD Million) By Country (2021-2032)
Figure 8. Canada Commercial Seaweed Revenue (USD Million) By Country (2021-2032)
Figure 9. Mexico Commercial Seaweed Revenue (USD Million) By Country (2021-2032)
Figure 10. Europe Commercial Seaweed Revenue (USD Million) By Country (2021-2032)
Figure 11. Germany Commercial Seaweed Revenue (USD Million) By Country (2021-2032)
Figure 12. France Commercial Seaweed Revenue (USD Million) By Country (2021-2032)
Figure 13. United Kingdom Commercial Seaweed Revenue (USD Million) By Country (2021-2032)
Figure 14. Spain Commercial Seaweed Revenue (USD Million) By Country (2021-2032)
Figure 15. Italy Commercial Seaweed Revenue (USD Million) By Country (2021-2032)
Figure 16. Russia Commercial Seaweed Revenue (USD Million) By Country (2021-2032)
Figure 17. Rest of Europe Commercial Seaweed Revenue (USD Million) By Country (2021-2032)
Figure 11. Asia Pacific Commercial Seaweed Revenue (USD Million) By Country (2021-2032)
Figure 12. China Commercial Seaweed Revenue (USD Million) By Country (2021-2032)
Figure 13. Japan Commercial Seaweed Revenue (USD Million) By Country (2021-2032)
Figure 14. India Commercial Seaweed Revenue (USD Million) By Country (2021-2032)
Figure 15. South Korea Commercial Seaweed Revenue (USD Million) By Country (2021-2032)
Figure 16. Australia Commercial Seaweed Revenue (USD Million) By Country (2021-2032)
Figure 17. South East Asia Commercial Seaweed Revenue (USD Million) By Country (2021-2032)
Figure 18. South America Commercial Seaweed Revenue (USD Million) By Country (2021-2032)
Figure 19. Brazil Commercial Seaweed Revenue (USD Million) By Country (2021-2032)
Figure 20. Argentina Commercial Seaweed Revenue (USD Million) By Country (2021-2032)
Figure 21. Rest of Asia Pacific Commercial Seaweed Revenue (USD Million) By Country (2021-2032)
Figure 22. Middle East and Africa Commercial Seaweed Revenue (USD Million) By Region (2021-2032)
Figure 23. Saudi Arabia Commercial Seaweed Revenue (USD Million) By Region (2021-2032)
Figure 24. The UAE Commercial Seaweed Revenue (USD Million) By Region (2021-2032)
Figure 25. Rest of Middle East Commercial Seaweed Revenue (USD Million) By Region (2021-2032)
Figure 26. South Africa Commercial Seaweed Revenue (USD Million) By Region (2021-2032)
Figure 27. Africa Commercial Seaweed Revenue (USD Million) By Region (2021-2032)
Figure 28. North America Commercial Seaweed Revenue (USD Million) By Type (2021-2032)
Figure 29. North America Commercial Seaweed Revenue (USD Million) By Application (2021-2032)
Figure 30. North America Commercial Seaweed Revenue (USD Million) By Product (2021-2032)
Figure 31. Europe Commercial Seaweed Revenue (USD Million) By Type (2021-2032)
Figure 32. Europe Commercial Seaweed Revenue (USD Million) By Application (2021-2032)
Figure 33. Europe Commercial Seaweed Revenue (USD Million) By Product (2021-2032)
Figure 34. Asia Pacific Commercial Seaweed Revenue (USD Million) By Type (2021-2032)
Figure 35. Asia Pacific Commercial Seaweed Revenue (USD Million) By Application (2021-2032)
Figure 36. Asia Pacific Commercial Seaweed Revenue (USD Million) By Product (2021-2032)
Figure 37. South America Commercial Seaweed Revenue (USD Million) By Type (2021-2032)
Figure 38. South America Commercial Seaweed Revenue (USD Million) By Application (2021-2032)
Figure 39. South America Commercial Seaweed Revenue (USD Million) By Product (2021-2032)
Figure 40. Middle East and Africa Commercial Seaweed Revenue (USD Million) By Type (2021-2032)
Figure 41. Middle East and Africa Commercial Seaweed Revenue (USD Million) By Application (2021-2032)
Figure 42. Middle East and Africa Commercial Seaweed Revenue (USD Million) By Product (2021-2032)
By Product
Brown seaweed
Red seaweed
Green seaweed
By Application
Agriculture
Animal Feed
Human Consumption
Others
By Form
Leaf
Powder
Flakes
Countries Analyzed
North America (US, Canada, Mexico)
Europe (Germany, UK, France, Spain, Italy, Russia, Rest of Europe)
Asia Pacific (China, India, Japan, South Korea, Australia, South East Asia, Rest of Asia)
South America (Brazil, Argentina, Rest of South America)
Middle East and Africa (Saudi Arabia, UAE, Rest of Middle East, South Africa, Egypt, Rest of Africa)
