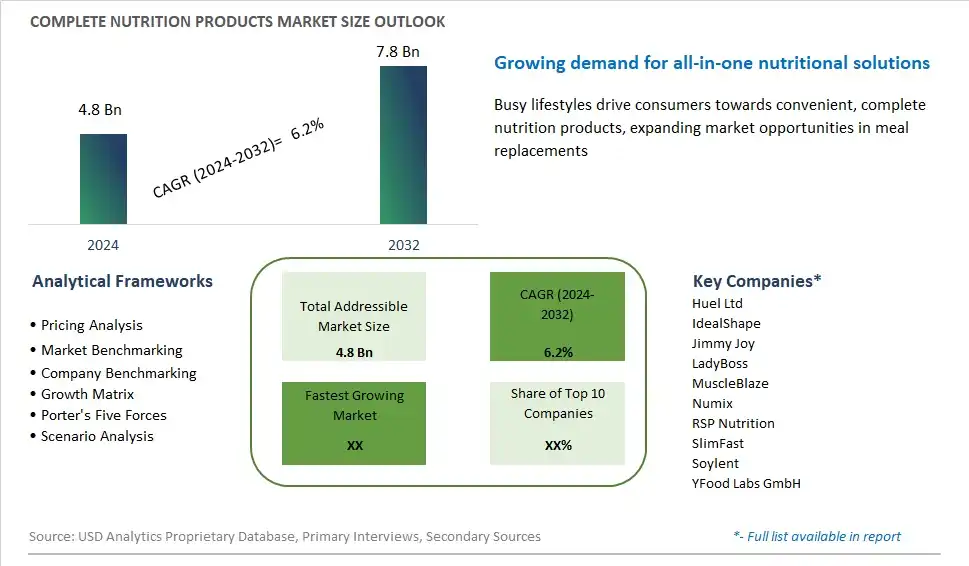
Global Complete Nutrition Products Market Size is valued at $4.8 Billion in 2024 and is forecast to register a growth rate (CAGR) of 6.2% to reach $7.8 Billion by 2032.
The global Complete Nutrition Products Market Comprehensive Study analyzes and forecasts the market size across 6 regions and 24 countries for diverse segments -By Product (Powder, RTD Shakes, Bars), By Distribution Channel (Supermarkets/Hypermarkets, Convenience Stores, Online, Others)
An Introduction to Complete Nutrition Products Market
The complete nutrition products market in 2024 is growing rapidly, driven by the increasing demand for convenient and balanced meal solutions. Complete nutrition products, which include meal replacement shakes, bars, and ready-to-drink beverages, are designed to provide all the essential nutrients required for a balanced diet. These products are popular among busy professionals, athletes, and individuals seeking weight management solutions. The market is characterized by innovations in product formulations to enhance taste, texture, and nutritional profile, including the incorporation of plant-based proteins, superfoods, and probiotics. The trend towards personalized nutrition is also driving growth, with companies offering customized solutions based on individual dietary needs and preferences. Additionally, the rising awareness of health and wellness is encouraging consumers to seek out complete nutrition products that are organic, non-GMO, and free from artificial ingredients.
Complete Nutrition Products Competitive Landscape
The market report analyses the leading companies in the industry including Huel Ltd, IdealShape, Jimmy Joy, LadyBoss, MuscleBlaze, Numix, RSP Nutrition, SlimFast, Soylent, YFood Labs GmbH, and Others.
Complete Nutrition Products Market Dynamics
Complete Nutrition Products Market Trend: Rise of Personalized Nutrition Solutions
One of the most prominent trends in the market for complete nutrition products is the rise of personalized nutrition solutions. As consumers become more health-conscious and seek tailored approaches to meet their unique dietary needs and wellness goals, there is a growing demand for complete nutrition products that offer personalized formulations and dietary plans. This trend is driven by advancements in technology, such as genetic testing and digital health platforms, that enable individuals to access personalized nutrition advice based on their genetic makeup, lifestyle factors, and health objectives. Complete nutrition products that incorporate personalized recommendations for vitamins, minerals, macronutrients, and functional ingredients cater to the individualized needs of consumers, offering comprehensive solutions for optimal health and performance.
Market Driver: Increasing Focus on Health and Wellness
The primary driver of the complete nutrition products market is the increasing focus on health and wellness among consumers. With rising awareness of the importance of nutrition in preventing chronic diseases, maintaining vitality, and enhancing overall well-being, individuals are seeking convenient and comprehensive solutions to support their health goals. Complete nutrition products, which provide a balanced combination of essential nutrients, vitamins, and minerals in convenient formats such as shakes, bars, and supplements, address the needs of health-conscious consumers who prioritize nutrition as a key component of their lifestyle. This driver is fueled by changing consumer behaviors towards proactive health management, driving demand for products that offer holistic nutrition support and promote long-term wellness.
Market Opportunity: Expansion into Functional Ingredients and Targeted Health Solutions
A significant opportunity for the complete nutrition products market lies in expansion into functional ingredients and targeted health solutions. By incorporating innovative functional ingredients such as probiotics, prebiotics, adaptogens, plant-based proteins, and superfoods into their formulations, complete nutrition product manufacturers can offer enhanced health benefits and address specific wellness concerns. For example, products targeting digestive health may contain probiotics and fiber, while those focused on energy and vitality may include adaptogenic herbs and vitamins for stress management and immune support. Moreover, there is an opportunity to develop targeted health solutions for specific demographic groups such as athletes, seniors, pregnant women, and individuals with dietary restrictions or medical conditions. By leveraging the power of functional ingredients and catering to diverse consumer needs, complete nutrition product manufacturers can differentiate their offerings, capture new market segments, and drive growth in the competitive nutrition industry.
Complete Nutrition Products Market Share Analysis: Powder Products held the dominant market share in 2024
Within the Complete Nutrition Products Market, powder products emerge as the largest segment, dominating the industry landscape. This supremacy can be attributed to several key factors, including versatility, convenience, and consumer preferences. Powdered nutrition products offer a wide range of benefits, including ease of storage, longer shelf life, and the ability to customize serving sizes according to individual needs. Further, powdered products are versatile and can be easily incorporated into various recipes and beverages, making them suitable for consumers with diverse dietary preferences and lifestyles. Additionally, the affordability of powdered nutrition products compared to ready-to-drink shakes and bars makes them accessible to a broader consumer base. As health-conscious consumers increasingly seek convenient and nutritionally balanced options to support their active lifestyles, the demand for powder products in the Complete Nutrition Products Market continues to grow steadily, solidifying its position as the largest segment in the industry.
Complete Nutrition Products Market Share Analysis: Online Distribution Channel held the dominant market share in 2024
Among the distribution channels in the Complete Nutrition Products Market, the online segment is the fastest-growing, witnessing exponential expansion in recent years. The robust growth outlook is driven by the increasing adoption of e-commerce platforms, driven by the convenience, accessibility, and extensive product offerings they provide to consumers. With the rise of digitalization, online channels offer a seamless shopping experience, allowing consumers to browse through a diverse range of nutrition products, compare prices, read reviews, and make purchases from the comfort of their homes or on-the-go. Further, the online distribution channel facilitates targeted marketing efforts, personalized recommendations, and subscription-based models, enhancing customer engagement and loyalty. As consumers continue to prioritize convenience and seek personalized nutrition solutions tailored to their specific needs, the online segment of the Complete Nutrition Products Market is poised to sustain its rapid growth trajectory, reshaping the landscape of how consumers access and purchase nutrition products.
Complete Nutrition Products Market Segmentation
By Product
Powder
RTD Shakes
Bars
By Distribution Channel
Supermarkets/Hypermarkets
Convenience Stores
Online
Others
Countries Analyzed
North America (US, Canada, Mexico)
Europe (Germany, UK, France, Spain, Italy, Russia, Rest of Europe)
Asia Pacific (China, India, Japan, South Korea, Australia, South East Asia, Rest of Asia)
South America (Brazil, Argentina, Rest of South America)
Middle East and Africa (Saudi Arabia, UAE, Rest of Middle East, South Africa, Egypt, Rest of Africa)
Complete Nutrition Products Companies Profiled in the Study
Huel Ltd
IdealShape
Jimmy Joy
LadyBoss
MuscleBlaze
Numix
RSP Nutrition
SlimFast
Soylent
YFood Labs GmbH
*- List Not Exhaustive
Chapter 1. TABLE OF CONTENTS
Chapter 2. Introduction to Complete Nutrition Products Market
2.1. Market Overview
2.2. Key Statistics and Report Highlights
2.3. Scope of the Comprehensive Study
2.3.1. Market Definition
2.3.2 Countries and Regions Covered
2.3.3 Research Objective
2.3.4 Units, Currency, and Conversions
2.3.5 Industry Value Chain
2.4. Key Market Segments
2.5. Key Companies
2.6. Study Period
Chapter 3. Strategic Analysis Review
3.1. Complete Nutrition Products Pricing Analysis and Forecast
3.2. Porter’s Five Forces
3.3. Market Ecosystem
3.4. SWOT Analysis
3.5. Regulatory Scenario
3.3. Effects of Inflation, Russia-Ukraine War, moderating economic growth, and other macroeconomic factors
Chapter 4. Competitive Landscape
4.1. Market Share Analysis
4.1.1. Global Complete Nutrition Products Market Share by Company, 2023
4.1.2. Product Offerings of Leading Complete Nutrition Products Companies
4.2. Market Entropy
4.2.1. New Product Launches in the Industry
4.2.2. Mergers, Acquisitions, Joint ventures, and Partnerships
4.3. Key Strategies and Best Practices
Chapter 5. Global Market Projections: Best, Reference, and Low Case Scenarios
5.1. Growth Analysis- Case Scenario Definitions
5.2. Low Growth Case Scenario Forecasts
5.3. Reference Growth Case Scenario Forecasts
5.4. High Growth Case Scenario Forecasts
Chapter 6. Market Dynamics
6.1. Complete Nutrition Products Market Drivers
6.2. Complete Nutrition Products Market Challenges
6.6. Complete Nutrition Products Market Opportunities
6.4. Complete Nutrition Products Market Trends
Chapter 7. Global Complete Nutrition Products Market Outlook Trends
7.1. Global Complete Nutrition Products Revenue (USD Million) and CAGR (%) by Type (2021-2032)
7.2. Global Complete Nutrition Products Revenue (USD Million) and CAGR (%) by Application (2021-2032)
7.3. Global Complete Nutrition Products Revenue (USD Million) and CAGR (%) by Product (2021-2032)
By Product
Powder
RTD Shakes
Bars
By Distribution Channel
Supermarkets/Hypermarkets
Convenience Stores
Online
Others
Chapter 8. Global Complete Nutrition Products Regional Analysis and Outlook
8.1. Global Complete Nutrition Products Revenue (USD Million) By Regions (2021- 2032)
8.2. North America Complete Nutrition Products Revenue (USD Million) by Country (2021-2032)
8.2.1. United States Complete Nutrition Products Regional Analysis and Outlook
8.2.2. Canada Complete Nutrition Products Regional Analysis and Outlook
8.2.3. Mexico Complete Nutrition Products Regional Analysis and Outlook
8.3. Europe Complete Nutrition Products Revenue (USD Million), by Country (2021-2032)
8.3.1. Germany Complete Nutrition Products Regional Analysis and Outlook
8.3.2. France Complete Nutrition Products Regional Analysis and Outlook
8.3.3. United Kingdom Complete Nutrition Products Regional Analysis and Outlook
8.3.4. Spain Complete Nutrition Products Regional Analysis and Outlook
8.3.5. Italy Complete Nutrition Products Regional Analysis and Outlook
8.3.6. Russia Complete Nutrition Products Regional Analysis and Outlook
8.3.7. Rest of Europe Complete Nutrition Products Regional Analysis and Outlook
8.4. Asia Pacific Complete Nutrition Products Revenue (USD Million) by Country (2021-2032)
8.4.1. China Complete Nutrition Products Regional Analysis and Outlook
8.4.2. Japan Complete Nutrition Products Regional Analysis and Outlook
8.4.3. India Complete Nutrition Products Regional Analysis and Outlook
8.4.4. South Korea Complete Nutrition Products Regional Analysis and Outlook
8.4.5. Australia Complete Nutrition Products Regional Analysis and Outlook
8.4.6. South East Asia Complete Nutrition Products Regional Analysis and Outlook
8.4.7. Rest of Asia Pacific Complete Nutrition Products Regional Analysis and Outlook
8.5. South America Complete Nutrition Products Revenue (USD Million), by Country (2021-2032)
8.5.1. Brazil Complete Nutrition Products Regional Analysis and Outlook
8.5.2. Argentina Complete Nutrition Products Regional Analysis and Outlook
8.5.3. Rest of South America Complete Nutrition Products Regional Analysis and Outlook
8.6. Middle East and Africa Complete Nutrition Products Revenue (USD Million) by Country (2021-2032)
8.6.1. Middle East Complete Nutrition Products Regional Analysis and Outlook
8.6.2. Africa Complete Nutrition Products Regional Analysis and Outlook
Chapter 9. North America Complete Nutrition Products Analysis and Outlook
9.1. North America Complete Nutrition Products Revenue (USD Million) by Segments (2021-2032)
9.1.1. North America Complete Nutrition Products Revenue (USD Million) by Type (2021-2032)
9.1.2. North America Complete Nutrition Products Revenue (USD Million) by Application (2021-2032)
9.1.3. North America Complete Nutrition Products Revenue (USD Million) by Product (2021-2032)
By Product
Powder
RTD Shakes
Bars
By Distribution Channel
Supermarkets/Hypermarkets
Convenience Stores
Online
Others
Chapter 10. Europe Complete Nutrition Products Analysis and Outlook
10.1. Europe Complete Nutrition Products Revenue (USD Million), by Segments (USD Million) (2021-2032)
10.1.1. Europe Complete Nutrition Products Revenue (USD Million) by Type (2021-2032)
10.1.2. Europe Complete Nutrition Products Revenue (USD Million) by Application (2021-2032)
10.1.3. Europe Complete Nutrition Products Revenue (USD Million) by Product (2021-2032)
By Product
Powder
RTD Shakes
Bars
By Distribution Channel
Supermarkets/Hypermarkets
Convenience Stores
Online
Others
Chapter 11. Asia Pacific Complete Nutrition Products Analysis and Outlook
11.1. Asia Pacific Complete Nutrition Products Revenue (USD Million), and Revenue (USD Million) by Segments (2021-2032)
11.1.1. Asia Pacific Complete Nutrition Products Revenue (USD Million) by Type (2021-2032)
11.1.2. Asia Pacific Complete Nutrition Products Revenue (USD Million) by Application (2021-2032)
11.1.3. Asia Pacific Complete Nutrition Products Revenue (USD Million) by Product (2021-2032)
By Product
Powder
RTD Shakes
Bars
By Distribution Channel
Supermarkets/Hypermarkets
Convenience Stores
Online
Others
Chapter 12. South America Complete Nutrition Products Analysis and Outlook
12.1. South America Complete Nutrition Products Revenue (USD Million), by Segments (2021-2032)
12.1.1. South America Complete Nutrition Products Revenue (USD Million) by Type (2021-2032)
12.1.2. South America Complete Nutrition Products Revenue (USD Million) by Application (2021-2032)
12.1.3. South America Complete Nutrition Products Revenue (USD Million) by Product (2021-2032)
By Product
Powder
RTD Shakes
Bars
By Distribution Channel
Supermarkets/Hypermarkets
Convenience Stores
Online
Others
Chapter 13. Middle East and Africa Complete Nutrition Products Analysis and Outlook
13.1. Middle East and Africa Complete Nutrition Products Revenue (USD Million), by Segments (2021-2032)
13.1.1. Middle East and Africa Complete Nutrition Products Revenue (USD Million) by Type (2021-2032)
13.1.2. Middle East and Africa Complete Nutrition Products Revenue (USD Million) by Application (2021-2032)
13.1.3. Middle East and Africa Complete Nutrition Products Revenue (USD Million) by Product (2021-2032)
By Product
Powder
RTD Shakes
Bars
By Distribution Channel
Supermarkets/Hypermarkets
Convenience Stores
Online
Others
Chapter 14. Complete Nutrition Products Company Profiles
14.1 Business Overview
14.2 Product Profiles
14.3 SWOT Profiles
14.5 Recent Developments
14.6 Financial Profile
List of Companies
Huel Ltd
IdealShape
Jimmy Joy
LadyBoss
MuscleBlaze
Numix
RSP Nutrition
SlimFast
Soylent
YFood Labs GmbH
15. Methodology and Data Sources
15.1 Customization Offerings
15.2 Subscription Services
15.3 Related Reports
15.4 Publisher Expertise
LIST OF TABLES
Table 1 Market Segmentation Analysis
Table 2 Global Complete Nutrition Products Market Share of Leading Companies, 2023
Table 3 Product Offerings of Leading Companies
Table 4 Low Growth Scenario Forecasts
Table 5 Reference Case Growth Scenario
Table 6 High Growth Case Scenario
Table 7 Global Complete Nutrition Products Revenue (USD Million) And CAGR (%) By Type (2021-2032)
Table 8 Global Complete Nutrition Products Revenue (USD Million) And CAGR (%) By Application (2021-2032)
Table 9 Global Complete Nutrition Products Revenue (USD Million) And CAGR (%) By Product (2021-2032)
Table 10 Global Complete Nutrition Products Market Revenue (USD Million) By Regions (2021-2032)
Table 11 Global Complete Nutrition Products Market Share (%) By Regions (2021-2032)
Table 12 North America Complete Nutrition Products Revenue (USD Million) By Country (2021-2032)
Table 13 Europe Complete Nutrition Products Revenue (USD Million) By Country (2021-2032)
Table 14 Asia Pacific Complete Nutrition Products Revenue (USD Million) By Country (2021-2032)
Table 15 South America Complete Nutrition Products Revenue (USD Million) By Country (2021-2032)
Table 16 Middle East and Africa Complete Nutrition Products Revenue (USD Million) By Region (2021-2032)
Table 17 North America Complete Nutrition Products Revenue (USD Million) By Type (2021-2032)
Table 18 North America Complete Nutrition Products Revenue (USD Million) By Application (2021-2032)
Table 19 North America Complete Nutrition Products Revenue (USD Million) By Product (2021-2032)
Table 20 Europe Complete Nutrition Products Revenue (USD Million) By Type (2021-2032)
Table 21 Europe Complete Nutrition Products Revenue (USD Million) By Application (2021-2032)
Table 22 Europe Complete Nutrition Products Revenue (USD Million) By Product (2021-2032)
Table 23 Asia Pacific Complete Nutrition Products Revenue (USD Million) By Type (2021-2032)
Table 24 Asia Pacific Complete Nutrition Products Revenue (USD Million) By Application (2021-2032)
Table 25 Asia Pacific Complete Nutrition Products Revenue (USD Million) By Product (2021-2032)
Table 26 South America Complete Nutrition Products Revenue (USD Million) By Type (2021-2032)
Table 27 South America Complete Nutrition Products Revenue (USD Million) By Application (2021-2032)
Table 28 South America Complete Nutrition Products Revenue (USD Million) By Product (2021-2032)
Table 29 Middle East and Africa Complete Nutrition Products Revenue (USD Million) By Type (2021-2032)
Table 30 Middle East and Africa Complete Nutrition Products Revenue (USD Million) By Application (2021-2032)
Table 31 Middle East and Africa Complete Nutrition Products Revenue (USD Million) By Product (2021-2032)
LIST OF FIGURES
Figure 1. Market Scope
Figure 2. Pricing Forecasts Per Unit, 2023- 2032
Figure 3. Porter’s Five Forces
Figure 4. Global Complete Nutrition Products Market Revenue (USD Million) By Regions (2021-2032)
Figure 5. Global Complete Nutrition Products Market Share (%) By Regions (2023)
Figure 6. North America Complete Nutrition Products Revenue (USD Million) By Country (2021-2032)
Figure 7. United States Complete Nutrition Products Revenue (USD Million) By Country (2021-2032)
Figure 8. Canada Complete Nutrition Products Revenue (USD Million) By Country (2021-2032)
Figure 9. Mexico Complete Nutrition Products Revenue (USD Million) By Country (2021-2032)
Figure 10. Europe Complete Nutrition Products Revenue (USD Million) By Country (2021-2032)
Figure 11. Germany Complete Nutrition Products Revenue (USD Million) By Country (2021-2032)
Figure 12. France Complete Nutrition Products Revenue (USD Million) By Country (2021-2032)
Figure 13. United Kingdom Complete Nutrition Products Revenue (USD Million) By Country (2021-2032)
Figure 14. Spain Complete Nutrition Products Revenue (USD Million) By Country (2021-2032)
Figure 15. Italy Complete Nutrition Products Revenue (USD Million) By Country (2021-2032)
Figure 16. Russia Complete Nutrition Products Revenue (USD Million) By Country (2021-2032)
Figure 17. Rest of Europe Complete Nutrition Products Revenue (USD Million) By Country (2021-2032)
Figure 11. Asia Pacific Complete Nutrition Products Revenue (USD Million) By Country (2021-2032)
Figure 12. China Complete Nutrition Products Revenue (USD Million) By Country (2021-2032)
Figure 13. Japan Complete Nutrition Products Revenue (USD Million) By Country (2021-2032)
Figure 14. India Complete Nutrition Products Revenue (USD Million) By Country (2021-2032)
Figure 15. South Korea Complete Nutrition Products Revenue (USD Million) By Country (2021-2032)
Figure 16. Australia Complete Nutrition Products Revenue (USD Million) By Country (2021-2032)
Figure 17. South East Asia Complete Nutrition Products Revenue (USD Million) By Country (2021-2032)
Figure 18. South America Complete Nutrition Products Revenue (USD Million) By Country (2021-2032)
Figure 19. Brazil Complete Nutrition Products Revenue (USD Million) By Country (2021-2032)
Figure 20. Argentina Complete Nutrition Products Revenue (USD Million) By Country (2021-2032)
Figure 21. Rest of Asia Pacific Complete Nutrition Products Revenue (USD Million) By Country (2021-2032)
Figure 22. Middle East and Africa Complete Nutrition Products Revenue (USD Million) By Region (2021-2032)
Figure 23. Saudi Arabia Complete Nutrition Products Revenue (USD Million) By Region (2021-2032)
Figure 24. The UAE Complete Nutrition Products Revenue (USD Million) By Region (2021-2032)
Figure 25. Rest of Middle East Complete Nutrition Products Revenue (USD Million) By Region (2021-2032)
Figure 26. South Africa Complete Nutrition Products Revenue (USD Million) By Region (2021-2032)
Figure 27. Africa Complete Nutrition Products Revenue (USD Million) By Region (2021-2032)
Figure 28. North America Complete Nutrition Products Revenue (USD Million) By Type (2021-2032)
Figure 29. North America Complete Nutrition Products Revenue (USD Million) By Application (2021-2032)
Figure 30. North America Complete Nutrition Products Revenue (USD Million) By Product (2021-2032)
Figure 31. Europe Complete Nutrition Products Revenue (USD Million) By Type (2021-2032)
Figure 32. Europe Complete Nutrition Products Revenue (USD Million) By Application (2021-2032)
Figure 33. Europe Complete Nutrition Products Revenue (USD Million) By Product (2021-2032)
Figure 34. Asia Pacific Complete Nutrition Products Revenue (USD Million) By Type (2021-2032)
Figure 35. Asia Pacific Complete Nutrition Products Revenue (USD Million) By Application (2021-2032)
Figure 36. Asia Pacific Complete Nutrition Products Revenue (USD Million) By Product (2021-2032)
Figure 37. South America Complete Nutrition Products Revenue (USD Million) By Type (2021-2032)
Figure 38. South America Complete Nutrition Products Revenue (USD Million) By Application (2021-2032)
Figure 39. South America Complete Nutrition Products Revenue (USD Million) By Product (2021-2032)
Figure 40. Middle East and Africa Complete Nutrition Products Revenue (USD Million) By Type (2021-2032)
Figure 41. Middle East and Africa Complete Nutrition Products Revenue (USD Million) By Application (2021-2032)
Figure 42. Middle East and Africa Complete Nutrition Products Revenue (USD Million) By Product (2021-2032)
By Product
Powder
RTD Shakes
Bars
By Distribution Channel
Supermarkets/Hypermarkets
Convenience Stores
Online
Others
Countries Analyzed
North America (US, Canada, Mexico)
Europe (Germany, UK, France, Spain, Italy, Russia, Rest of Europe)
Asia Pacific (China, India, Japan, South Korea, Australia, South East Asia, Rest of Asia)
South America (Brazil, Argentina, Rest of South America)
Middle East and Africa (Saudi Arabia, UAE, Rest of Middle East, South Africa, Egypt, Rest of Africa)
