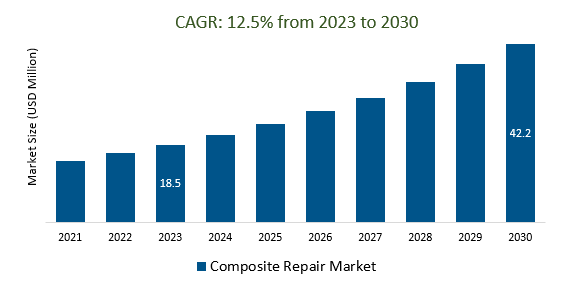
The global Composite Repair Market Size is estimated to be US$ 18.5 Billion in 2023 and is poised to register 12.5% growth over the forecast period from 2023 to 2030 to reach US $ 42.2 billion in 2030.
The Composite Repair Market is driven by factors such as aging infrastructure, cost-effective repairs, environmental regulations, technological advancements, safety and reliability, and energy efficiency. The use of advanced composite materials, automation and robotics, digital twin technology, customization, sustainability, 3D printing, non-invasive inspection, global expansion, and regulatory compliance are key drivers. The aging of infrastructure, cost-effective repairs, and increasing environmental regulations are driving the adoption of composite repair solutions. The industry is also focusing on sustainability, with a focus on recyclable materials and eco-friendly repair processes. The market is expanding globally, with increasing demand in emerging markets, and stricter regulatory requirements influencing the development and adoption of composite repair methods.
Meeting the Challenge of Aging Infrastructure by Exploring Composite Repair Solutions is boosting the market.
The challenge of aging infrastructure is being effectively addressed through the exploration of composite repair solutions, which is in turn significantly boosting the Composite Repair Market. As buildings, bridges, pipelines, and other critical infrastructure age, they often require maintenance and repair to ensure their continued safety and functionality. Composite repair solutions offer a cost-effective and durable way to extend the lifespan of these structures, reducing the need for expensive replacements. This has led to a growing demand for composite repair materials and services in various industries, including construction, transportation, and energy. Companies specializing in composite repair are thriving as they play a crucial role in maintaining and enhancing the longevity of essential infrastructure assets, making this market a key player in infrastructure sustainability.
Cost-Effective Composite Repairs as A Smart Solution for Maintenance Cost Reduction is attracting a wide range of customers.
Cost-effective composite Repairs have emerged as a highly sought-after solution in the Composite Repair Market, captivating a diverse clientele seeking to optimize their maintenance expenditure. This innovative approach not only ensures the structural integrity of composite materials but also significantly reduces operational costs. Its appeal lies in its ability to seamlessly mend and reinforce composite components, extending their lifespan and minimizing the need for costly replacements. As industries increasingly recognize the financial benefits and long-term sustainability of these repairs, the demand continues to surge. The Composite Repair Market is witnessing a growing influx of customers, all eager to leverage this intelligent solution to streamline their maintenance budgets and enhance the durability of their composite assets.
Harnessing Advanced Composite Materials and Technological Advancements is creating a demand in the market.
The utilization of advanced composite materials and the integration of cutting-edge technological advancements have sparked a significant surge in the demand for composite repair solutions. These materials, known for their remarkable strength-to-weight ratio and durability, are increasingly prevalent in industries such as aerospace, automotive, wind energy, and construction. As these sectors continue to rely on composites for critical components, the need for efficient repair and maintenance services has grown exponentially. Moreover, technological innovations in repair methods, such as automated robotic systems and advanced inspection techniques, are enhancing the efficiency and precision of composite repairs, further fuelling market growth. This dynamic landscape is shaping the composite repair market into a pivotal sector for industries seeking reliable and cost-effective maintenance solutions.
Market Share Analysis:
Structural composite repair stands as the prevailing and widely embraced approach within the composite repair sector.
The method is characterized by its paramount importance in various industries, including aerospace, automotive, marine, and construction. Its prominence stems from its ability to restore the structural integrity of composite materials, making it an indispensable solution for repairing damage or wear and tear. In aerospace, structural composite repair plays a pivotal role in ensuring the safety and longevity of aircraft, where composite components are increasingly utilized for their lightweight and durable properties. Similarly, in the automotive industry, it enables the restoration of carbon fiber-reinforced parts, contributing to vehicle performance and efficiency. In the marine sector, composite repair is essential for maintaining the structural soundness of boat hulls, while in construction, it aids in strengthening and reinforcing composite structures. With continual advancements in materials and repair techniques, structural composite repair remains at the forefront of composite technology, offering durable, cost-effective solutions for maintaining and enhancing the performance of composite structures across various industries.
Vacuum infusion is the most dominant composite repair process in terms of market share.
Vacuum infusion is the leading composite repair method by market share, employing vacuum pressure to infuse resin into dry reinforcement preforms. It is favoured for its simplicity, affordability, and versatility in repairing a broad spectrum of composite components. This process yields high strength and stiffness, achieves excellent surface finishes, accommodates complex shapes, and maintains cost-effectiveness. Vacuum infusion finds extensive application across diverse sectors, including aerospace, automotive, marine, and wind energy. In aerospace, it mends aircraft components like wings and fuselages, while the automotive sector relies on it for body panel and bumper repairs. In the marine industry, vacuum infusion is used for boat hull and deck repairs, and in wind energy, it plays a crucial role in the restoration of wind turbine blades.
The aerospace and defense sector stands as the paramount application within the composite repair market.
The dominance is underpinned by the industry's incessant pursuit of lightweight and high-strength materials, wherein composites play a pivotal role. Composites, with their exceptional strength-to-weight ratios and resistance to corrosion, have become indispensable in aircraft and defence systems. They offer the dual benefit of reducing overall weight while enhancing structural integrity, thus contributing to increased fuel efficiency and manoeuvrability in aerospace. In the defence sector, composites find applications in armoured vehicles, ballistic protection, and naval vessels, bolstering both durability and performance. The critical nature of these applications necessitates regular maintenance and repair, ensuring the continued reliability and safety of these assets. Consequently, the demand for composite repair solutions has surged, making aerospace and defence the frontrunners in the composite repair market, with a promising outlook for sustained growth and innovation.
Composite Repair Market Segmentation
Type
- Structural
- Semi-Structural
- Cosmetic
Process
- Hand Lay-Up
- Vacuum Infusion
- Autoclave
- Composite Wrap
- Prepeg Moulding
- Others
Application
- Aerospace and Defense
- Marine
- Automotive and Transportation
- Wind Energy
- Construction
- Oil and Gas
- Chemical
- Irrigation
- Medical
- Electrical and Electronics
- Others
By Region
- North America (United States, Canada, Mexico)
- Europe (Germany, France, United Kingdom, Spain, Italy, Others)
- Asia Pacific (China, India, Japan, South Korea, Australia, Others)
- Latin America (Brazil, Argentina, Others)
- Middle East and Africa (Saudi Arabia, UAE, Kuwait, Other Middle East, South Africa, Nigeria, Other Africa)
Composite Repair Market Companies
- Lufthansa Technik AG
- Air France–KLM S.A.
- Hong Kong Aircraft Engineering Company Limited (Haeco)
- UpWind Solutions, Inc
- Total Wind Group
- Technical Wind Services Limited
- Citadel Technologies
- Milliken & Company group
- T.D. Williamson, Inc.
- West System
- WR Composite
- Fibrwrap Construction Pte Ltd
- Concrete Repairs Ltd
- Walker Technical Resources Ltd
- Composite Technologies Ltd
*List not exhaustive
Composite Repair Market Outlook 2023
1 Market Overview
1.1 Introduction to the Composite Repair Market
1.2 Scope of the Study
1.3 Research Objective
1.3.1 Key Market Scope and Segments
1.3.2 Players Covered
1.3.3 Years Considered
2 Executive Summary
2.1 2023 Composite Repair Industry- Market Statistics
3 Market Dynamics
3.1 Market Drivers
3.2 Market Challenges
3.3 Market Opportunities
3.4 Market Trends
4 Market Factor Analysis
4.1 Porter’s Five Forces
4.2 Market Entropy
4.2.1 Global Composite Repair Market Companies with Area Served
4.2.2 Products Offerings Global Composite Repair Market
5 COVID-19 Impact Analysis and Outlook Scenarios
5.1.1 Covid-19 Impact Analysis
5.1.2 Post-COVID-19 Scenario- Low Growth Case
5.1.3 Post-COVID-19 Scenario- Reference Growth Case
5.1.4 Post-COVID-19 Scenario- Low Growth Case
6 Global Composite Repair Market Trends
6.1 Global Composite Repair Revenue (USD Million) and CAGR (%) by Type (2018-2030)
6.2 Global Composite Repair Revenue (USD Million) and CAGR (%) by Applications (2018-2030)
6.3 Global Composite Repair Revenue (USD Million) and CAGR (%) by Regions (2018-2030)
7 Global Composite Repair Market Revenue (USD Million) by Type, and Applications (2018-2022)
7.1 Global Composite Repair Revenue (USD Million) by Type (2018-2022)
7.1.1 Global Composite Repair Revenue (USD Million), Market Share (%) by Type (2018-2022)
7.2 Global Composite Repair Revenue (USD Million) by Applications (2018-2022)
7.2.1 Global Composite Repair Revenue (USD Million), Market Share (%) by Applications (2018-2022)
8 Global Composite Repair Development Regional Status and Outlook
8.1 Global Composite Repair Revenue (USD Million) By Regions (2018-2022)
8.2 North America Composite Repair Revenue (USD Million) by Type, and Application (2018-2022)
8.2.1 North America Composite Repair Revenue (USD Million) by Country (2018-2022)
8.2.2 North America Composite Repair Revenue (USD Million) by Type (2018-2022)
8.2.3 North America Composite Repair Revenue (USD Million) by Applications (2018-2022)
8.3 Europe Composite Repair Revenue (USD Million), by Type, and Applications (USD Million) (2018-2022)
8.3.1 Europe Composite Repair Revenue (USD Million), by Country (2018-2022)
8.3.2 Europe Composite Repair Revenue (USD Million) by Type (2018-2022)
8.3.3 Europe Composite Repair Revenue (USD Million) by Applications (2018-2022)
8.4 Asia Pacific Composite Repair Revenue (USD Million), and Revenue (USD Million) by Type, and Applications (2018-2022)
8.4.1 Asia Pacific Composite Repair Revenue (USD Million) by Country (2018-2022)
8.4.2 Asia Pacific Composite Repair Revenue (USD Million) by Type (2018-2022)
8.4.3 Asia Pacific Composite Repair Revenue (USD Million) by Applications (2018-2022)
8.5 South America Composite Repair Revenue (USD Million), by Type, and Applications (2018-2022)
8.5.1 South America Composite Repair Revenue (USD Million), by Country (2018-2022)
8.5.2 South America Composite Repair Revenue (USD Million) by Type (2018-2022)
8.5.3 South America Composite Repair Revenue (USD Million) by Applications (2018-2022)
8.6 Middle East and Africa Composite Repair Revenue (USD Million), by Type, Technology, Application, Thickness (2018-2022)
8.6.1 Middle East and Africa Composite Repair Revenue (USD Million) by Country (2018-2022)
8.6.2 Middle East and Africa Composite Repair Revenue (USD Million) by Type (2018-2022)
8.6.3 Middle East and Africa Composite Repair Revenue (USD Million) by Applications (2018-2022)
9 Company Profiles
10 Global Composite Repair Market Revenue (USD Million), by Type, and Applications (2023-2030)
10.1 Global Composite Repair Revenue (USD Million) and Market Share (%) by Type (2023-2030)
10.1.1 Global Composite Repair Revenue (USD Million), and Market Share (%) by Type (2023-2030)
10.2 Global Composite Repair Revenue (USD Million) and Market Share (%) by Applications (2023-2030)
10.2.1 Global Composite Repair Revenue (USD Million), and Market Share (%) by Applications (2023-2030)
11 Global Composite Repair Development Regional Status and Outlook Forecast
11.1 Global Composite Repair Revenue (USD Million) By Regions (2023-2030)
11.2 North America Composite Repair Revenue (USD Million) by Type, and Applications (2023-2030)
11.2.1 North America Composite Repair Revenue (USD) Million by Country (2023-2030)
11.2.2 North America Composite Repair Revenue (USD Million), by Type (2023-2030)
11.2.3 North America Composite Repair Revenue (USD Million), Market Share (%) by Applications (2023-2030)
11.3 Europe Composite Repair Revenue (USD Million), by Type, and Applications (2023-2030)
11.3.1 Europe Composite Repair Revenue (USD Million), by Country (2023-2030)
11.3.2 Europe Composite Repair Revenue (USD Million), by Type (2023-2030)
11.3.3 Europe Composite Repair Revenue (USD Million), by Applications (2023-2030)
11.4 Asia Pacific Composite Repair Revenue (USD Million) by Type, and Applications (2023-2030)
11.4.1 Asia Pacific Composite Repair Revenue (USD Million), by Country (2023-2030)
11.4.2 Asia Pacific Composite Repair Revenue (USD Million), by Type (2023-2030)
11.4.3 Asia Pacific Composite Repair Revenue (USD Million), by Applications (2023-2030)
11.5 South America Composite Repair Revenue (USD Million), by Type, and Applications (2023-2030)
11.5.1 South America Composite Repair Revenue (USD Million), by Country (2023-2030)
11.5.2 South America Composite Repair Revenue (USD Million), by Type (2023-2030)
11.5.3 South America Composite Repair Revenue (USD Million), by Applications (2023-2030)
11.6 Middle East and Africa Composite Repair Revenue (USD Million), by Type, and Applications (2023-2030)
11.6.1 Middle East and Africa Composite Repair Revenue (USD Million), by Region (2023-2030)
11.6.2 Middle East and Africa Composite Repair Revenue (USD Million), by Type (2023-2030)
11.6.3 Middle East and Africa Composite Repair Revenue (USD Million), by Applications (2023-2030)
12 Methodology and Data Sources
12.1 Methodology/Research Approach
12.1.1 Research Programs/Design
12.1.2 Market Size Estimation
12.1.3 Market Breakdown and Data Triangulation
12.2 Data Sources
12.2.1 Secondary Sources
12.2.2 Primary Sources
12.3 Disclaimer
List of Tables
Table 1 Market Segmentation Analysis
Table 2 Global Composite Repair Market Companies with Areas Served
Table 3 Products Offerings Global Composite Repair Market
Table 4 Low Growth Scenario Forecasts
Table 5 Reference Case Growth Scenario
Table 6 High Growth Case Scenario
Table 7 Global Composite Repair Revenue (USD Million) And CAGR (%) By Type (2018-2030)
Table 8 Global Composite Repair Revenue (USD Million) And CAGR (%) By Applications (2018-2030)
Table 9 Global Composite Repair Revenue (USD Million) And CAGR (%) By Regions (2018-2030)
Table 10 Global Composite Repair Revenue (USD Million) By Type (2018-2022)
Table 11 Global Composite Repair Revenue Market Share (%) By Type (2018-2022)
Table 12 Global Composite Repair Revenue (USD Million) By Applications (2018-2022)
Table 13 Global Composite Repair Revenue Market Share (%) By Applications (2018-2022)
Table 14 Global Composite Repair Market Revenue (USD Million) By Regions (2018-2022)
Table 15 Global Composite Repair Market Share (%) By Regions (2018-2022)
Table 16 North America Composite Repair Revenue (USD Million) By Country (2018-2022)
Table 17 North America Composite Repair Revenue (USD Million) By Type (2018-2022)
Table 18 North America Composite Repair Revenue (USD Million) By Applications (2018-2022)
Table 19 Europe Composite Repair Revenue (USD Million) By Country (2018-2022)
Table 20 Europe Composite Repair Revenue (USD Million) By Type (2018-2022)
Table 21 Europe Composite Repair Revenue (USD Million) By Applications (2018-2022)
Table 22 Asia Pacific Composite Repair Revenue (USD Million) By Country (2018-2022)
Table 23 Asia Pacific Composite Repair Revenue (USD Million) By Type (2018-2022)
Table 24 Asia Pacific Composite Repair Revenue (USD Million) By Applications (2018-2022)
Table 25 South America Composite Repair Revenue (USD Million) By Country (2018-2022)
Table 26 South America Composite Repair Revenue (USD Million) By Type (2018-2022)
Table 27 South America Composite Repair Revenue (USD Million) By Applications (2018-2022)
Table 28 Middle East and Africa Composite Repair Revenue (USD Million) By Region (2018-2022)
Table 29 Middle East and Africa Composite Repair Revenue (USD Million) By Type (2018-2022)
Table 30 Middle East and Africa Composite Repair Revenue (USD Million) By Applications (2018-2022)
Table 31 Financial Analysis
Table 32 Global Composite Repair Revenue (USD Million) By Type (2023-2030)
Table 33 Global Composite Repair Revenue Market Share (%) By Type (2023-2030)
Table 34 Global Composite Repair Revenue (USD Million) By Applications (2023-2030)
Table 35 Global Composite Repair Revenue Market Share (%) By Applications (2023-2030)
Table 36 Global Composite Repair Market Revenue (USD Million), And Revenue (USD Million) By Regions (2023-2030)
Table 37 North America Composite Repair Revenue (USD)By Country (2023-2030)
Table 38 North America Composite Repair Revenue (USD Million) By Type (2023-2030)
Table 39 North America Composite Repair Revenue (USD Million) By Applications (2023-2030)
Table 40 Europe Composite Repair Revenue (USD Million) By Country (2023-2030)
Table 41 Europe Composite Repair Revenue (USD Million) By Type (2023-2030)
Table 42 Europe Composite Repair Revenue (USD Million) By Applications (2023-2030)
Table 43 Asia Pacific Composite Repair Revenue (USD Million) By Country (2023-2030)
Table 44 Asia Pacific Composite Repair Revenue (USD Million) By Type (2023-2030)
Table 45 Asia Pacific Composite Repair Revenue (USD Million) By Applications (2023-2030)
Table 46 South America Composite Repair Revenue (USD Million) By Country (2023-2030)
Table 47 South America Composite Repair Revenue (USD Million) By Type (2023-2030)
Table 48 South America Composite Repair Revenue (USD Million) By Applications (2023-2030)
Table 49 Middle East and Africa Composite Repair Revenue (USD Million) By Region (2023-2030)
Table 50 Middle East and Africa Composite Repair Revenue (USD Million) By Region (2023-2030)
Table 51 Middle East and Africa Composite Repair Revenue (USD Million) By Type (2023-2030)
Table 52 Middle East and Africa Composite Repair Revenue (USD Million) By Applications (2023-2030)
Table 53 Research Programs/Design for This Report
Table 54 Key Data Information from Secondary Sources
Table 55 Key Data Information from Primary Sources
List of Figures
Figure 1 Market Scope
Figure 2 Porter’s Five Forces
Figure 3 Global Composite Repair Revenue (USD Million) By Type (2018-2022)
Figure 4 Global Composite Repair Revenue Market Share (%) By Type (2022)
Figure 5 Global Composite Repair Revenue (USD Million) By Applications (2018-2022)
Figure 6 Global Composite Repair Revenue Market Share (%) By Applications (2022)
Figure 7 Global Composite Repair Market Revenue (USD Million) By Regions (2018-2022)
Figure 8 Global Composite Repair Market Share (%) By Regions (2022)
Figure 9 North America Composite Repair Revenue (USD Million) By Country (2018-2022)
Figure 10 North America Composite Repair Revenue (USD Million) By Type (2018-2022)
Figure 11 North America Composite Repair Revenue (USD Million) By Applications (2018-2022)
Figure 12 Europe Composite Repair Revenue (USD Million) By Country (2018-2022)
Figure 13 Europe Composite Repair Revenue (USD Million) By Type (2018-2022)
Figure 14 Europe Composite Repair Revenue (USD Million) By Applications (2018-2022)
Figure 15 Asia Pacific Composite Repair Revenue (USD Million) By Country (2018-2022)
Figure 16 Asia Pacific Composite Repair Revenue (USD Million) By Type (2018-2022)
Figure 17 Asia Pacific Composite Repair Revenue (USD Million) By Applications (2018-2022)
Figure 18 South America Composite Repair Revenue (USD Million) By Country (2018-2022)
Figure 19 South America Composite Repair Revenue (USD Million) By Type (2018-2022)
Figure 20 South America Composite Repair Revenue (USD Million) By Applications (2018-2022)
Figure 21 Middle East and Africa Composite Repair Revenue (USD Million) By Region (2018-2022)
Figure 22 Middle East and Africa Composite Repair Revenue (USD Million) By Type (2018-2022)
Figure 23 Middle East and Africa Composite Repair Revenue (USD Million) By Applications (2018-2022)
Figure 24 Global Composite Repair Revenue (USD Million) By Type (2023-2030)
Figure 25 Global Composite Repair Revenue Market Share (%) By Type (2030)
Figure 26 Global Composite Repair Revenue (USD Million) By Applications (2023-2030)
Figure 27 Global Composite Repair Revenue Market Share (%) By Applications (2030)
Figure 28 Global Composite Repair Market Revenue (USD Million) By Regions (2023-2030)
Figure 29 North America Composite Repair Revenue (USD Million) By Country (2023-2030)
Figure 30 North America Composite Repair Revenue (USD Million) By Type (2023-2030)
Figure 31 North America Composite Repair Revenue (USD Million) By Applications (2023-2030)
Figure 32 Europe Composite Repair Revenue (USD Million) By Country (2023-2030)
Figure 33 Europe Composite Repair Revenue (USD Million) By Type (2023-2030)
Figure 34 Europe Composite Repair Revenue (USD Million) By Applications (2023-2030)
Figure 35 Asia Pacific Composite Repair Revenue (USD Million) By Country (2023-2030)
Figure 36 Asia Pacific Composite Repair Revenue (USD Million) By Type (2023-2030)
Figure 37 Asia Pacific Composite Repair Revenue (USD Million) By Applications (2023-2030)
Figure 38 South America Composite Repair Revenue (USD Million) By Country (2023-2030)
Figure 39 South America Composite Repair Revenue (USD Million) By Type (2023-2030)
Figure 40 South America Composite Repair Revenue (USD Million) By Applications (2023-2030)
Figure 41 Middle East and Africa Composite Repair Revenue (USD Million) By Region (2023-2030)
Figure 42 Middle East and Africa Composite Repair Revenue (USD Million) By Region (2023-2030)
Figure 43 Middle East and Africa Composite Repair Revenue (USD Million) By Type (2023-2030)
Figure 44 Middle East and Africa Composite Repair Revenue (USD Million) By Applications (2023-2030)
Figure 45 Bottom-Up and Top-Down Approaches For This Report
Figure 46 Data Triangulation
