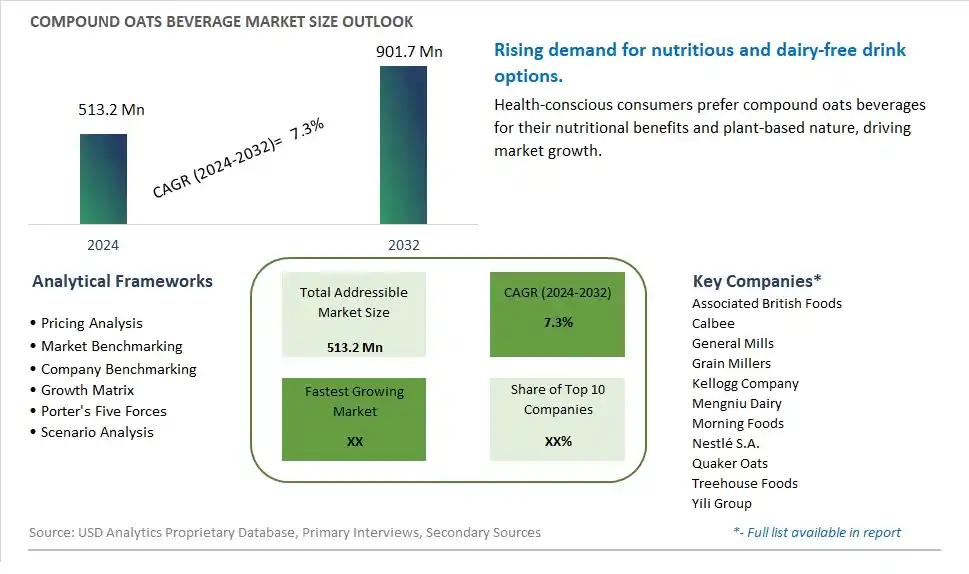
Global Compound Oats Beverage Market Size is valued at $513.2 Million in 2024 and is forecast to register a growth rate (CAGR) of 7.3% to reach $901.7 Million by 2032.
The global Compound Oats Beverage Market Comprehensive Study analyzes and forecasts the market size across 6 regions and 24 countries for diverse segments -By Type (Dairy, Non-Dairy), By Application (Household, Commercial)
An Introduction to Compound Oats Beverage Market
In 2024, the Compound Oats Beverages market is expanding rapidly, driven by the increasing demand for plant-based and nutritious drink options. Compound oats beverages, made from oats and fortified with additional nutrients such as vitamins, minerals, and proteins, are popular for their health benefits and versatility. The market is supported by the growing trend towards vegan and lactose-free diets. Advances in beverage formulation and processing technologies are enhancing the quality, flavor, and nutritional content of compound oats beverages. The market is also benefiting from the trend towards clean-label and functional beverages, appealing to health-conscious consumers seeking high-quality and nutritious drink options.
Compound Oats Beverage Competitive Landscape
The market report analyses the leading companies in the industry including Associated British Foods, Calbee, General Mills, Grain Millers, Kellogg Company, Mengniu Dairy, Morning Foods, Nestlé S.A., Quaker Oats, Treehouse Foods, Yili Group, and Others.
Compound Oats Beverage Market Dynamics
Compound Oats Beverages Market Trend: Growing Demand for Plant-Based Beverages
A prominent market trend in the Compound Oats Beverages sector is the growing demand for plant-based beverages. As consumers increasingly seek healthier and environmentally-friendly alternatives to traditional dairy products, plant-based beverages such as oat milk have gained popularity. This trend is driven by factors such as rising awareness of health benefits associated with plant-based diets, lactose intolerance considerations, and concerns about sustainability and animal welfare.
Compound Oats Beverages Market Driver: Innovation in Plant-Based Beverage Formulations
The market for Compound Oats Beverages is primarily driven by innovation in plant-based beverage formulations. Companies are continuously developing new and improved recipes for oat-based drinks, focusing on taste, texture, nutritional profile, and functional benefits. The driver is reinforced by the versatility of oats as a plant-based ingredient, allowing for the creation of various beverage options like flavored oat milk, oat-based smoothies, and ready-to-drink oat beverages, catering to diverse consumer preferences.
Compound Oats Beverages Market Opportunity: Expansion into Niche Segments and Functional Beverages
An opportunity within the Compound Oats Beverages market lies in expansion into niche segments and functional beverages. Companies can explore opportunities to introduce specialty oat-based beverages targeting specific consumer segments such as athletes, health-conscious individuals, or those seeking functional benefits like added vitamins, minerals, or protein. Additionally, there's potential for developing oat-based beverages with unique flavors, organic certifications, or fortified with ingredients promoting gut health, immunity, or energy, tapping into the growing market for functional and specialty plant-based drinks. By focusing on innovation and catering to niche consumer needs, companies can capitalize on the expanding demand for Compound Oats Beverages.
Compound Oats Beverage Market Share Analysis- Largest Segment by Type
The Non-Dairy segment is the largest in the Compound Oats Beverage Market by type. This dominance is driven by the increasing consumer preference for plant-based and lactose-free alternatives to traditional dairy beverages. Non-dairy oat beverages are popular among consumers who are lactose intolerant, vegan, or seeking healthier and more sustainable options. The rich, creamy texture and nutritional benefits of oat beverages, including high fiber and beta-glucan content, appeal to health-conscious consumers. Additionally, the growing trend of plant-based diets and the increasing awareness of the environmental impact of dairy production support the significant market share of non-dairy oat beverages. The continuous innovation in flavor varieties and fortified options, along with the expansion of distribution channels, further enhance the appeal and accessibility of non-dairy oat beverages.
Compound Oats Beverage Market Share Analysis- Fastest Growing Segment by Application
The Commercial segment is poised to grow the fastest in the Compound Oats Beverage Market by application over the next five years. This rapid growth is driven by the increasing demand for plant-based beverages in cafes, restaurants, and other foodservice establishments. The growing popularity of oat milk as an alternative to dairy milk in coffee shops and smoothie bars contributes significantly to the commercial segment's expansion. Additionally, the rising trend of offering plant-based options on menus to cater to diverse consumer preferences supports the adoption of compound oat beverages in the commercial sector. The continuous innovation in oat beverage formulations, including barista blends specifically designed for frothing and steaming, further drives their use in commercial applications. The expanding availability of oat beverages through foodservice distributors and the growing consumer demand for sustainable and plant-based products in dining establishments accelerate the growth of the commercial segment.
Compound Oats Beverage Market Segmentation
By Type
Dairy
Non-Dairy
By Application
Household
Commercial
Countries Analyzed
North America (US, Canada, Mexico)
Europe (Germany, UK, France, Spain, Italy, Russia, Rest of Europe)
Asia Pacific (China, India, Japan, South Korea, Australia, South East Asia, Rest of Asia)
South America (Brazil, Argentina, Rest of South America)
Middle East and Africa (Saudi Arabia, UAE, Rest of Middle East, South Africa, Egypt, Rest of Africa)
Compound Oats Beverage Companies Profiled in the Study
Associated British Foods
Calbee
General Mills
Grain Millers
Kellogg Company
Mengniu Dairy
Morning Foods
Nestlé S.A.
Quaker Oats
Treehouse Foods
Yili Group
*- List Not Exhaustive
Chapter 1. TABLE OF CONTENTS
Chapter 2. Introduction to Compound Oats Beverage Market
2.1. Market Overview
2.2. Key Statistics and Report Highlights
2.3. Scope of the Comprehensive Study
2.3.1. Market Definition
2.3.2 Countries and Regions Covered
2.3.3 Research Objective
2.3.4 Units, Currency, and Conversions
2.3.5 Industry Value Chain
2.4. Key Market Segments
2.5. Key Companies
2.6. Study Period
Chapter 3. Strategic Analysis Review
3.1. Compound Oats Beverage Pricing Analysis and Forecast
3.2. Porter’s Five Forces
3.3. Market Ecosystem
3.4. SWOT Analysis
3.5. Regulatory Scenario
3.3. Effects of Inflation, Russia-Ukraine War, moderating economic growth, and other macroeconomic factors
Chapter 4. Competitive Landscape
4.1. Market Share Analysis
4.1.1. Global Compound Oats Beverage Market Share by Company, 2023
4.1.2. Product Offerings of Leading Compound Oats Beverage Companies
4.2. Market Entropy
4.2.1. New Product Launches in the Industry
4.2.2. Mergers, Acquisitions, Joint ventures, and Partnerships
4.3. Key Strategies and Best Practices
Chapter 5. Global Market Projections: Best, Reference, and Low Case Scenarios
5.1. Growth Analysis- Case Scenario Definitions
5.2. Low Growth Case Scenario Forecasts
5.3. Reference Growth Case Scenario Forecasts
5.4. High Growth Case Scenario Forecasts
Chapter 6. Market Dynamics
6.1. Compound Oats Beverage Market Drivers
6.2. Compound Oats Beverage Market Challenges
6.6. Compound Oats Beverage Market Opportunities
6.4. Compound Oats Beverage Market Trends
Chapter 7. Global Compound Oats Beverage Market Outlook Trends
7.1. Global Compound Oats Beverage Revenue (USD Million) and CAGR (%) by Type (2021-2032)
7.2. Global Compound Oats Beverage Revenue (USD Million) and CAGR (%) by Application (2021-2032)
7.3. Global Compound Oats Beverage Revenue (USD Million) and CAGR (%) by Product (2021-2032)
By Type
Dairy
Non-Dairy
By Application
Household
Commercial
Chapter 8. Global Compound Oats Beverage Regional Analysis and Outlook
8.1. Global Compound Oats Beverage Revenue (USD Million) By Regions (2021- 2032)
8.2. North America Compound Oats Beverage Revenue (USD Million) by Country (2021-2032)
8.2.1. United States Compound Oats Beverage Regional Analysis and Outlook
8.2.2. Canada Compound Oats Beverage Regional Analysis and Outlook
8.2.3. Mexico Compound Oats Beverage Regional Analysis and Outlook
8.3. Europe Compound Oats Beverage Revenue (USD Million), by Country (2021-2032)
8.3.1. Germany Compound Oats Beverage Regional Analysis and Outlook
8.3.2. France Compound Oats Beverage Regional Analysis and Outlook
8.3.3. United Kingdom Compound Oats Beverage Regional Analysis and Outlook
8.3.4. Spain Compound Oats Beverage Regional Analysis and Outlook
8.3.5. Italy Compound Oats Beverage Regional Analysis and Outlook
8.3.6. Russia Compound Oats Beverage Regional Analysis and Outlook
8.3.7. Rest of Europe Compound Oats Beverage Regional Analysis and Outlook
8.4. Asia Pacific Compound Oats Beverage Revenue (USD Million) by Country (2021-2032)
8.4.1. China Compound Oats Beverage Regional Analysis and Outlook
8.4.2. Japan Compound Oats Beverage Regional Analysis and Outlook
8.4.3. India Compound Oats Beverage Regional Analysis and Outlook
8.4.4. South Korea Compound Oats Beverage Regional Analysis and Outlook
8.4.5. Australia Compound Oats Beverage Regional Analysis and Outlook
8.4.6. South East Asia Compound Oats Beverage Regional Analysis and Outlook
8.4.7. Rest of Asia Pacific Compound Oats Beverage Regional Analysis and Outlook
8.5. South America Compound Oats Beverage Revenue (USD Million), by Country (2021-2032)
8.5.1. Brazil Compound Oats Beverage Regional Analysis and Outlook
8.5.2. Argentina Compound Oats Beverage Regional Analysis and Outlook
8.5.3. Rest of South America Compound Oats Beverage Regional Analysis and Outlook
8.6. Middle East and Africa Compound Oats Beverage Revenue (USD Million) by Country (2021-2032)
8.6.1. Middle East Compound Oats Beverage Regional Analysis and Outlook
8.6.2. Africa Compound Oats Beverage Regional Analysis and Outlook
Chapter 9. North America Compound Oats Beverage Analysis and Outlook
9.1. North America Compound Oats Beverage Revenue (USD Million) by Segments (2021-2032)
9.1.1. North America Compound Oats Beverage Revenue (USD Million) by Type (2021-2032)
9.1.2. North America Compound Oats Beverage Revenue (USD Million) by Application (2021-2032)
9.1.3. North America Compound Oats Beverage Revenue (USD Million) by Product (2021-2032)
By Type
Dairy
Non-Dairy
By Application
Household
Commercial
Chapter 10. Europe Compound Oats Beverage Analysis and Outlook
10.1. Europe Compound Oats Beverage Revenue (USD Million), by Segments (USD Million) (2021-2032)
10.1.1. Europe Compound Oats Beverage Revenue (USD Million) by Type (2021-2032)
10.1.2. Europe Compound Oats Beverage Revenue (USD Million) by Application (2021-2032)
10.1.3. Europe Compound Oats Beverage Revenue (USD Million) by Product (2021-2032)
By Type
Dairy
Non-Dairy
By Application
Household
Commercial
Chapter 11. Asia Pacific Compound Oats Beverage Analysis and Outlook
11.1. Asia Pacific Compound Oats Beverage Revenue (USD Million), and Revenue (USD Million) by Segments (2021-2032)
11.1.1. Asia Pacific Compound Oats Beverage Revenue (USD Million) by Type (2021-2032)
11.1.2. Asia Pacific Compound Oats Beverage Revenue (USD Million) by Application (2021-2032)
11.1.3. Asia Pacific Compound Oats Beverage Revenue (USD Million) by Product (2021-2032)
By Type
Dairy
Non-Dairy
By Application
Household
Commercial
Chapter 12. South America Compound Oats Beverage Analysis and Outlook
12.1. South America Compound Oats Beverage Revenue (USD Million), by Segments (2021-2032)
12.1.1. South America Compound Oats Beverage Revenue (USD Million) by Type (2021-2032)
12.1.2. South America Compound Oats Beverage Revenue (USD Million) by Application (2021-2032)
12.1.3. South America Compound Oats Beverage Revenue (USD Million) by Product (2021-2032)
By Type
Dairy
Non-Dairy
By Application
Household
Commercial
Chapter 13. Middle East and Africa Compound Oats Beverage Analysis and Outlook
13.1. Middle East and Africa Compound Oats Beverage Revenue (USD Million), by Segments (2021-2032)
13.1.1. Middle East and Africa Compound Oats Beverage Revenue (USD Million) by Type (2021-2032)
13.1.2. Middle East and Africa Compound Oats Beverage Revenue (USD Million) by Application (2021-2032)
13.1.3. Middle East and Africa Compound Oats Beverage Revenue (USD Million) by Product (2021-2032)
By Type
Dairy
Non-Dairy
By Application
Household
Commercial
Chapter 14. Compound Oats Beverage Company Profiles
14.1 Business Overview
14.2 Product Profiles
14.3 SWOT Profiles
14.5 Recent Developments
14.6 Financial Profile
List of Companies
Associated British Foods
Calbee
General Mills
Grain Millers
Kellogg Company
Mengniu Dairy
Morning Foods
Nestlé S.A.
Quaker Oats
Treehouse Foods
Yili Group
15. Methodology and Data Sources
15.1 Customization Offerings
15.2 Subscription Services
15.3 Related Reports
15.4 Publisher Expertise
LIST OF TABLES
Table 1 Market Segmentation Analysis
Table 2 Global Compound Oats Beverage Market Share of Leading Companies, 2023
Table 3 Product Offerings of Leading Companies
Table 4 Low Growth Scenario Forecasts
Table 5 Reference Case Growth Scenario
Table 6 High Growth Case Scenario
Table 7 Global Compound Oats Beverage Revenue (USD Million) And CAGR (%) By Type (2021-2032)
Table 8 Global Compound Oats Beverage Revenue (USD Million) And CAGR (%) By Application (2021-2032)
Table 9 Global Compound Oats Beverage Revenue (USD Million) And CAGR (%) By Product (2021-2032)
Table 10 Global Compound Oats Beverage Market Revenue (USD Million) By Regions (2021-2032)
Table 11 Global Compound Oats Beverage Market Share (%) By Regions (2021-2032)
Table 12 North America Compound Oats Beverage Revenue (USD Million) By Country (2021-2032)
Table 13 Europe Compound Oats Beverage Revenue (USD Million) By Country (2021-2032)
Table 14 Asia Pacific Compound Oats Beverage Revenue (USD Million) By Country (2021-2032)
Table 15 South America Compound Oats Beverage Revenue (USD Million) By Country (2021-2032)
Table 16 Middle East and Africa Compound Oats Beverage Revenue (USD Million) By Region (2021-2032)
Table 17 North America Compound Oats Beverage Revenue (USD Million) By Type (2021-2032)
Table 18 North America Compound Oats Beverage Revenue (USD Million) By Application (2021-2032)
Table 19 North America Compound Oats Beverage Revenue (USD Million) By Product (2021-2032)
Table 20 Europe Compound Oats Beverage Revenue (USD Million) By Type (2021-2032)
Table 21 Europe Compound Oats Beverage Revenue (USD Million) By Application (2021-2032)
Table 22 Europe Compound Oats Beverage Revenue (USD Million) By Product (2021-2032)
Table 23 Asia Pacific Compound Oats Beverage Revenue (USD Million) By Type (2021-2032)
Table 24 Asia Pacific Compound Oats Beverage Revenue (USD Million) By Application (2021-2032)
Table 25 Asia Pacific Compound Oats Beverage Revenue (USD Million) By Product (2021-2032)
Table 26 South America Compound Oats Beverage Revenue (USD Million) By Type (2021-2032)
Table 27 South America Compound Oats Beverage Revenue (USD Million) By Application (2021-2032)
Table 28 South America Compound Oats Beverage Revenue (USD Million) By Product (2021-2032)
Table 29 Middle East and Africa Compound Oats Beverage Revenue (USD Million) By Type (2021-2032)
Table 30 Middle East and Africa Compound Oats Beverage Revenue (USD Million) By Application (2021-2032)
Table 31 Middle East and Africa Compound Oats Beverage Revenue (USD Million) By Product (2021-2032)
LIST OF FIGURES
Figure 1. Market Scope
Figure 2. Pricing Forecasts Per Unit, 2023- 2032
Figure 3. Porter’s Five Forces
Figure 4. Global Compound Oats Beverage Market Revenue (USD Million) By Regions (2021-2032)
Figure 5. Global Compound Oats Beverage Market Share (%) By Regions (2023)
Figure 6. North America Compound Oats Beverage Revenue (USD Million) By Country (2021-2032)
Figure 7. United States Compound Oats Beverage Revenue (USD Million) By Country (2021-2032)
Figure 8. Canada Compound Oats Beverage Revenue (USD Million) By Country (2021-2032)
Figure 9. Mexico Compound Oats Beverage Revenue (USD Million) By Country (2021-2032)
Figure 10. Europe Compound Oats Beverage Revenue (USD Million) By Country (2021-2032)
Figure 11. Germany Compound Oats Beverage Revenue (USD Million) By Country (2021-2032)
Figure 12. France Compound Oats Beverage Revenue (USD Million) By Country (2021-2032)
Figure 13. United Kingdom Compound Oats Beverage Revenue (USD Million) By Country (2021-2032)
Figure 14. Spain Compound Oats Beverage Revenue (USD Million) By Country (2021-2032)
Figure 15. Italy Compound Oats Beverage Revenue (USD Million) By Country (2021-2032)
Figure 16. Russia Compound Oats Beverage Revenue (USD Million) By Country (2021-2032)
Figure 17. Rest of Europe Compound Oats Beverage Revenue (USD Million) By Country (2021-2032)
Figure 11. Asia Pacific Compound Oats Beverage Revenue (USD Million) By Country (2021-2032)
Figure 12. China Compound Oats Beverage Revenue (USD Million) By Country (2021-2032)
Figure 13. Japan Compound Oats Beverage Revenue (USD Million) By Country (2021-2032)
Figure 14. India Compound Oats Beverage Revenue (USD Million) By Country (2021-2032)
Figure 15. South Korea Compound Oats Beverage Revenue (USD Million) By Country (2021-2032)
Figure 16. Australia Compound Oats Beverage Revenue (USD Million) By Country (2021-2032)
Figure 17. South East Asia Compound Oats Beverage Revenue (USD Million) By Country (2021-2032)
Figure 18. South America Compound Oats Beverage Revenue (USD Million) By Country (2021-2032)
Figure 19. Brazil Compound Oats Beverage Revenue (USD Million) By Country (2021-2032)
Figure 20. Argentina Compound Oats Beverage Revenue (USD Million) By Country (2021-2032)
Figure 21. Rest of Asia Pacific Compound Oats Beverage Revenue (USD Million) By Country (2021-2032)
Figure 22. Middle East and Africa Compound Oats Beverage Revenue (USD Million) By Region (2021-2032)
Figure 23. Saudi Arabia Compound Oats Beverage Revenue (USD Million) By Region (2021-2032)
Figure 24. The UAE Compound Oats Beverage Revenue (USD Million) By Region (2021-2032)
Figure 25. Rest of Middle East Compound Oats Beverage Revenue (USD Million) By Region (2021-2032)
Figure 26. South Africa Compound Oats Beverage Revenue (USD Million) By Region (2021-2032)
Figure 27. Africa Compound Oats Beverage Revenue (USD Million) By Region (2021-2032)
Figure 28. North America Compound Oats Beverage Revenue (USD Million) By Type (2021-2032)
Figure 29. North America Compound Oats Beverage Revenue (USD Million) By Application (2021-2032)
Figure 30. North America Compound Oats Beverage Revenue (USD Million) By Product (2021-2032)
Figure 31. Europe Compound Oats Beverage Revenue (USD Million) By Type (2021-2032)
Figure 32. Europe Compound Oats Beverage Revenue (USD Million) By Application (2021-2032)
Figure 33. Europe Compound Oats Beverage Revenue (USD Million) By Product (2021-2032)
Figure 34. Asia Pacific Compound Oats Beverage Revenue (USD Million) By Type (2021-2032)
Figure 35. Asia Pacific Compound Oats Beverage Revenue (USD Million) By Application (2021-2032)
Figure 36. Asia Pacific Compound Oats Beverage Revenue (USD Million) By Product (2021-2032)
Figure 37. South America Compound Oats Beverage Revenue (USD Million) By Type (2021-2032)
Figure 38. South America Compound Oats Beverage Revenue (USD Million) By Application (2021-2032)
Figure 39. South America Compound Oats Beverage Revenue (USD Million) By Product (2021-2032)
Figure 40. Middle East and Africa Compound Oats Beverage Revenue (USD Million) By Type (2021-2032)
Figure 41. Middle East and Africa Compound Oats Beverage Revenue (USD Million) By Application (2021-2032)
Figure 42. Middle East and Africa Compound Oats Beverage Revenue (USD Million) By Product (2021-2032)
By Type
Dairy
Non-Dairy
By Application
Household
Commercial
Countries Analyzed
North America (US, Canada, Mexico)
Europe (Germany, UK, France, Spain, Italy, Russia, Rest of Europe)
Asia Pacific (China, India, Japan, South Korea, Australia, South East Asia, Rest of Asia)
South America (Brazil, Argentina, Rest of South America)
Middle East and Africa (Saudi Arabia, UAE, Rest of Middle East, South Africa, Egypt, Rest of Africa)
