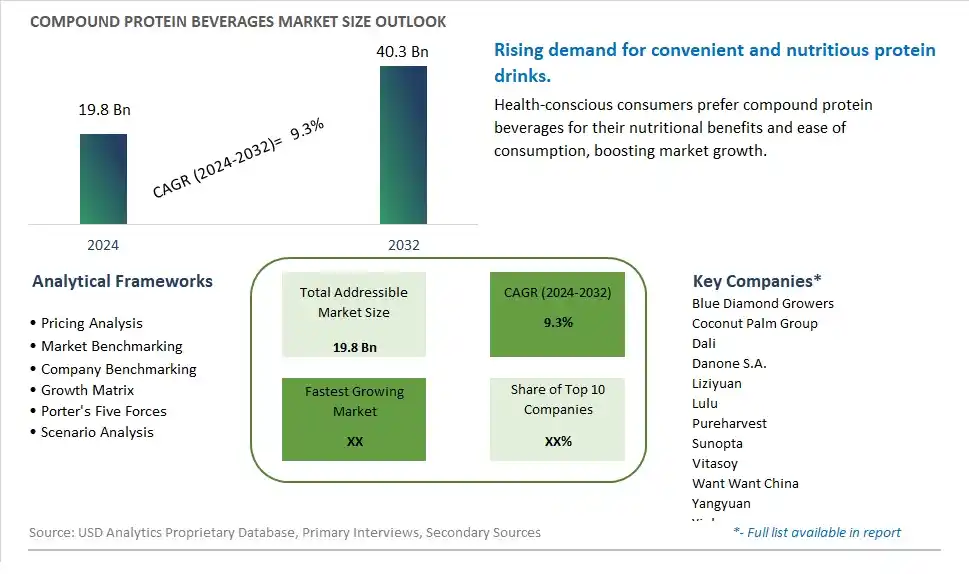
Global Compound Protein Beverages Market Size is valued at $19.8 Billion in 2024 and is forecast to register a growth rate (CAGR) of 9.3% to reach $40.3 Billion by 2032.
The global Compound Protein Beverages Market Comprehensive Study analyzes and forecasts the market size across 6 regions and 24 countries for diverse segments -By Type (Nuts, Beans, Tubers, Others), By Application (Supermarkets/Hypermarkets, Convenience Stores, Online Retail, Others)
An Introduction to Compound Protein Beverages Market
In 2024, the Compound Protein Beverage market is witnessing robust growth, driven by the increasing demand for high-protein and functional drink options. Compound protein beverages, formulated with a mix of proteins from various sources such as dairy, plant, and soy, are valued for their ability to support muscle growth, recovery, and overall health. The market is supported by the growing trend towards fitness and health-conscious lifestyles. Advances in beverage formulation and processing technologies are enhancing the quality, flavor, and nutritional content of compound protein beverages. The market is also benefiting from the trend towards clean-label and natural ingredients, appealing to consumers seeking high-quality and effective protein drinks.
Compound Protein Beverages Competitive Landscape
The market report analyses the leading companies in the industry including Blue Diamond Growers, Coconut Palm Group, Dali, Danone S.A., Liziyuan, Lulu, Pureharvest, Sunopta, Vitasoy, Want Want China, Yangyuan, Yinlu, and Others.
Compound Protein Beverages Market Dynamics
Compound Protein Beverage Market Trend: Growing Demand for Protein-Enriched Beverages
A prominent market trend in the Compound Protein Beverage sector is the growing demand for protein-enriched beverages. As consumers become more health-conscious and seek convenient ways to meet their daily protein requirements, there's a rising interest in beverages fortified with protein. This trend is driven by factors such as increased awareness of the importance of protein in a balanced diet, growing fitness and wellness trends, and the popularity of plant-based protein sources among vegetarian and vegan consumers.
Compound Protein Beverage Market Driver: Focus on Functional and Nutritional Benefits
The market for Compound Protein Beverages is primarily driven by a focus on functional and nutritional benefits. Manufacturers are developing innovative beverage formulations that not only provide a convenient source of protein but also offer additional health benefits such as muscle recovery, satiety, and energy support. The driver is reinforced by the versatility of protein sources, including whey, soy, pea, and other plant-based proteins, allowing for a diverse range of protein beverages catering to different dietary preferences and health goals.
Compound Protein Beverage Market Opportunity: Expansion into Targeted Consumer Segments and Functional Beverages
An opportunity within the Compound Protein Beverage market lies in expansion into targeted consumer segments and functional beverages. Companies can capitalize on the growing demand for protein beverages among fitness enthusiasts, athletes, and individuals seeking post-workout recovery options by offering specialized protein drinks with enhanced amino acid profiles, added vitamins, minerals, or performance-enhancing ingredients. Additionally, there's potential for developing protein-enriched functional beverages targeting specific health concerns such as immune support, weight management, or bone health, tapping into the broader market for functional and fortified beverages. By focusing on innovation and addressing specific consumer needs, companies can unlock new opportunities and differentiate their products in the competitive Compound Protein Beverage market.
Compound Protein Beverages Market Share Analysis- Largest Segment by Type
The Nuts segment is the largest in the Compound Protein Beverages Market by type. This dominance is due to the high consumer demand for nut-based protein beverages, which are perceived as nutritious and flavorful. Nut-based beverages, such as almond milk and cashew milk, are rich in proteins, healthy fats, vitamins, and minerals, making them a popular choice among health-conscious consumers. Additionally, the growing trend towards plant-based diets and the increasing prevalence of lactose intolerance and dairy allergies have driven the demand for nut-based protein beverages. The versatility of nuts in creating various flavored and fortified beverages further enhances their appeal. Moreover, the strong brand presence and extensive marketing efforts by major producers of nut-based beverages support their significant market share. The continuous innovation in product formulations, including the addition of protein isolates and superfoods, also contributes to the popularity and dominance of the nuts segment.
Compound Protein Beverages Market Share Analysis- Fastest Growing Segment by Application
The Online Retail segment is poised to grow the fastest in the Compound Protein Beverages Market by application over the next five years. This rapid growth is driven by the increasing consumer preference for the convenience and accessibility of online shopping. E-commerce platforms offer a broad selection of compound protein beverages, including niche and specialty products that may not be readily available in physical stores. The convenience of browsing and purchasing from home, coupled with the option of home delivery, appeals to a wide range of consumers. The COVID-19 pandemic has further accelerated the adoption of online shopping, and this trend is expected to continue. Additionally, online retailers often provide detailed product descriptions, customer reviews, and competitive pricing, which enhance consumer confidence and satisfaction. The growth of digital marketing and targeted online advertisements also boosts the visibility and sales of compound protein beverages through online retail channels.
Compound Protein Beverages Market Segmentation
By Type
Nuts
Beans
Tubers
Others
By Application
Supermarkets/Hypermarkets
Convenience Stores
Online Retail
Others
Countries Analyzed
North America (US, Canada, Mexico)
Europe (Germany, UK, France, Spain, Italy, Russia, Rest of Europe)
Asia Pacific (China, India, Japan, South Korea, Australia, South East Asia, Rest of Asia)
South America (Brazil, Argentina, Rest of South America)
Middle East and Africa (Saudi Arabia, UAE, Rest of Middle East, South Africa, Egypt, Rest of Africa)
Compound Protein Beverages Companies Profiled in the Study
Blue Diamond Growers
Coconut Palm Group
Dali
Danone S.A.
Liziyuan
Lulu
Pureharvest
Sunopta
Vitasoy
Want Want China
Yangyuan
Yinlu
*- List Not Exhaustive
Chapter 1. TABLE OF CONTENTS
Chapter 2. Introduction to Compound Protein Beverages Market
2.1. Market Overview
2.2. Key Statistics and Report Highlights
2.3. Scope of the Comprehensive Study
2.3.1. Market Definition
2.3.2 Countries and Regions Covered
2.3.3 Research Objective
2.3.4 Units, Currency, and Conversions
2.3.5 Industry Value Chain
2.4. Key Market Segments
2.5. Key Companies
2.6. Study Period
Chapter 3. Strategic Analysis Review
3.1. Compound Protein Beverages Pricing Analysis and Forecast
3.2. Porter’s Five Forces
3.3. Market Ecosystem
3.4. SWOT Analysis
3.5. Regulatory Scenario
3.3. Effects of Inflation, Russia-Ukraine War, moderating economic growth, and other macroeconomic factors
Chapter 4. Competitive Landscape
4.1. Market Share Analysis
4.1.1. Global Compound Protein Beverages Market Share by Company, 2023
4.1.2. Product Offerings of Leading Compound Protein Beverages Companies
4.2. Market Entropy
4.2.1. New Product Launches in the Industry
4.2.2. Mergers, Acquisitions, Joint ventures, and Partnerships
4.3. Key Strategies and Best Practices
Chapter 5. Global Market Projections: Best, Reference, and Low Case Scenarios
5.1. Growth Analysis- Case Scenario Definitions
5.2. Low Growth Case Scenario Forecasts
5.3. Reference Growth Case Scenario Forecasts
5.4. High Growth Case Scenario Forecasts
Chapter 6. Market Dynamics
6.1. Compound Protein Beverages Market Drivers
6.2. Compound Protein Beverages Market Challenges
6.6. Compound Protein Beverages Market Opportunities
6.4. Compound Protein Beverages Market Trends
Chapter 7. Global Compound Protein Beverages Market Outlook Trends
7.1. Global Compound Protein Beverages Revenue (USD Million) and CAGR (%) by Type (2021-2032)
7.2. Global Compound Protein Beverages Revenue (USD Million) and CAGR (%) by Application (2021-2032)
7.3. Global Compound Protein Beverages Revenue (USD Million) and CAGR (%) by Product (2021-2032)
By Type
Nuts
Beans
Tubers
Others
By Application
Supermarkets/Hypermarkets
Convenience Stores
Online Retail
Others
Chapter 8. Global Compound Protein Beverages Regional Analysis and Outlook
8.1. Global Compound Protein Beverages Revenue (USD Million) By Regions (2021- 2032)
8.2. North America Compound Protein Beverages Revenue (USD Million) by Country (2021-2032)
8.2.1. United States Compound Protein Beverages Regional Analysis and Outlook
8.2.2. Canada Compound Protein Beverages Regional Analysis and Outlook
8.2.3. Mexico Compound Protein Beverages Regional Analysis and Outlook
8.3. Europe Compound Protein Beverages Revenue (USD Million), by Country (2021-2032)
8.3.1. Germany Compound Protein Beverages Regional Analysis and Outlook
8.3.2. France Compound Protein Beverages Regional Analysis and Outlook
8.3.3. United Kingdom Compound Protein Beverages Regional Analysis and Outlook
8.3.4. Spain Compound Protein Beverages Regional Analysis and Outlook
8.3.5. Italy Compound Protein Beverages Regional Analysis and Outlook
8.3.6. Russia Compound Protein Beverages Regional Analysis and Outlook
8.3.7. Rest of Europe Compound Protein Beverages Regional Analysis and Outlook
8.4. Asia Pacific Compound Protein Beverages Revenue (USD Million) by Country (2021-2032)
8.4.1. China Compound Protein Beverages Regional Analysis and Outlook
8.4.2. Japan Compound Protein Beverages Regional Analysis and Outlook
8.4.3. India Compound Protein Beverages Regional Analysis and Outlook
8.4.4. South Korea Compound Protein Beverages Regional Analysis and Outlook
8.4.5. Australia Compound Protein Beverages Regional Analysis and Outlook
8.4.6. South East Asia Compound Protein Beverages Regional Analysis and Outlook
8.4.7. Rest of Asia Pacific Compound Protein Beverages Regional Analysis and Outlook
8.5. South America Compound Protein Beverages Revenue (USD Million), by Country (2021-2032)
8.5.1. Brazil Compound Protein Beverages Regional Analysis and Outlook
8.5.2. Argentina Compound Protein Beverages Regional Analysis and Outlook
8.5.3. Rest of South America Compound Protein Beverages Regional Analysis and Outlook
8.6. Middle East and Africa Compound Protein Beverages Revenue (USD Million) by Country (2021-2032)
8.6.1. Middle East Compound Protein Beverages Regional Analysis and Outlook
8.6.2. Africa Compound Protein Beverages Regional Analysis and Outlook
Chapter 9. North America Compound Protein Beverages Analysis and Outlook
9.1. North America Compound Protein Beverages Revenue (USD Million) by Segments (2021-2032)
9.1.1. North America Compound Protein Beverages Revenue (USD Million) by Type (2021-2032)
9.1.2. North America Compound Protein Beverages Revenue (USD Million) by Application (2021-2032)
9.1.3. North America Compound Protein Beverages Revenue (USD Million) by Product (2021-2032)
By Type
Nuts
Beans
Tubers
Others
By Application
Supermarkets/Hypermarkets
Convenience Stores
Online Retail
Others
Chapter 10. Europe Compound Protein Beverages Analysis and Outlook
10.1. Europe Compound Protein Beverages Revenue (USD Million), by Segments (USD Million) (2021-2032)
10.1.1. Europe Compound Protein Beverages Revenue (USD Million) by Type (2021-2032)
10.1.2. Europe Compound Protein Beverages Revenue (USD Million) by Application (2021-2032)
10.1.3. Europe Compound Protein Beverages Revenue (USD Million) by Product (2021-2032)
By Type
Nuts
Beans
Tubers
Others
By Application
Supermarkets/Hypermarkets
Convenience Stores
Online Retail
Others
Chapter 11. Asia Pacific Compound Protein Beverages Analysis and Outlook
11.1. Asia Pacific Compound Protein Beverages Revenue (USD Million), and Revenue (USD Million) by Segments (2021-2032)
11.1.1. Asia Pacific Compound Protein Beverages Revenue (USD Million) by Type (2021-2032)
11.1.2. Asia Pacific Compound Protein Beverages Revenue (USD Million) by Application (2021-2032)
11.1.3. Asia Pacific Compound Protein Beverages Revenue (USD Million) by Product (2021-2032)
By Type
Nuts
Beans
Tubers
Others
By Application
Supermarkets/Hypermarkets
Convenience Stores
Online Retail
Others
Chapter 12. South America Compound Protein Beverages Analysis and Outlook
12.1. South America Compound Protein Beverages Revenue (USD Million), by Segments (2021-2032)
12.1.1. South America Compound Protein Beverages Revenue (USD Million) by Type (2021-2032)
12.1.2. South America Compound Protein Beverages Revenue (USD Million) by Application (2021-2032)
12.1.3. South America Compound Protein Beverages Revenue (USD Million) by Product (2021-2032)
By Type
Nuts
Beans
Tubers
Others
By Application
Supermarkets/Hypermarkets
Convenience Stores
Online Retail
Others
Chapter 13. Middle East and Africa Compound Protein Beverages Analysis and Outlook
13.1. Middle East and Africa Compound Protein Beverages Revenue (USD Million), by Segments (2021-2032)
13.1.1. Middle East and Africa Compound Protein Beverages Revenue (USD Million) by Type (2021-2032)
13.1.2. Middle East and Africa Compound Protein Beverages Revenue (USD Million) by Application (2021-2032)
13.1.3. Middle East and Africa Compound Protein Beverages Revenue (USD Million) by Product (2021-2032)
By Type
Nuts
Beans
Tubers
Others
By Application
Supermarkets/Hypermarkets
Convenience Stores
Online Retail
Others
Chapter 14. Compound Protein Beverages Company Profiles
14.1 Business Overview
14.2 Product Profiles
14.3 SWOT Profiles
14.5 Recent Developments
14.6 Financial Profile
List of Companies
Blue Diamond Growers
Coconut Palm Group
Dali
Danone S.A.
Liziyuan
Lulu
Pureharvest
Sunopta
Vitasoy
Want Want China
Yangyuan
Yinlu
15. Methodology and Data Sources
15.1 Customization Offerings
15.2 Subscription Services
15.3 Related Reports
15.4 Publisher Expertise
LIST OF TABLES
Table 1 Market Segmentation Analysis
Table 2 Global Compound Protein Beverages Market Share of Leading Companies, 2023
Table 3 Product Offerings of Leading Companies
Table 4 Low Growth Scenario Forecasts
Table 5 Reference Case Growth Scenario
Table 6 High Growth Case Scenario
Table 7 Global Compound Protein Beverages Revenue (USD Million) And CAGR (%) By Type (2021-2032)
Table 8 Global Compound Protein Beverages Revenue (USD Million) And CAGR (%) By Application (2021-2032)
Table 9 Global Compound Protein Beverages Revenue (USD Million) And CAGR (%) By Product (2021-2032)
Table 10 Global Compound Protein Beverages Market Revenue (USD Million) By Regions (2021-2032)
Table 11 Global Compound Protein Beverages Market Share (%) By Regions (2021-2032)
Table 12 North America Compound Protein Beverages Revenue (USD Million) By Country (2021-2032)
Table 13 Europe Compound Protein Beverages Revenue (USD Million) By Country (2021-2032)
Table 14 Asia Pacific Compound Protein Beverages Revenue (USD Million) By Country (2021-2032)
Table 15 South America Compound Protein Beverages Revenue (USD Million) By Country (2021-2032)
Table 16 Middle East and Africa Compound Protein Beverages Revenue (USD Million) By Region (2021-2032)
Table 17 North America Compound Protein Beverages Revenue (USD Million) By Type (2021-2032)
Table 18 North America Compound Protein Beverages Revenue (USD Million) By Application (2021-2032)
Table 19 North America Compound Protein Beverages Revenue (USD Million) By Product (2021-2032)
Table 20 Europe Compound Protein Beverages Revenue (USD Million) By Type (2021-2032)
Table 21 Europe Compound Protein Beverages Revenue (USD Million) By Application (2021-2032)
Table 22 Europe Compound Protein Beverages Revenue (USD Million) By Product (2021-2032)
Table 23 Asia Pacific Compound Protein Beverages Revenue (USD Million) By Type (2021-2032)
Table 24 Asia Pacific Compound Protein Beverages Revenue (USD Million) By Application (2021-2032)
Table 25 Asia Pacific Compound Protein Beverages Revenue (USD Million) By Product (2021-2032)
Table 26 South America Compound Protein Beverages Revenue (USD Million) By Type (2021-2032)
Table 27 South America Compound Protein Beverages Revenue (USD Million) By Application (2021-2032)
Table 28 South America Compound Protein Beverages Revenue (USD Million) By Product (2021-2032)
Table 29 Middle East and Africa Compound Protein Beverages Revenue (USD Million) By Type (2021-2032)
Table 30 Middle East and Africa Compound Protein Beverages Revenue (USD Million) By Application (2021-2032)
Table 31 Middle East and Africa Compound Protein Beverages Revenue (USD Million) By Product (2021-2032)
LIST OF FIGURES
Figure 1. Market Scope
Figure 2. Pricing Forecasts Per Unit, 2023- 2032
Figure 3. Porter’s Five Forces
Figure 4. Global Compound Protein Beverages Market Revenue (USD Million) By Regions (2021-2032)
Figure 5. Global Compound Protein Beverages Market Share (%) By Regions (2023)
Figure 6. North America Compound Protein Beverages Revenue (USD Million) By Country (2021-2032)
Figure 7. United States Compound Protein Beverages Revenue (USD Million) By Country (2021-2032)
Figure 8. Canada Compound Protein Beverages Revenue (USD Million) By Country (2021-2032)
Figure 9. Mexico Compound Protein Beverages Revenue (USD Million) By Country (2021-2032)
Figure 10. Europe Compound Protein Beverages Revenue (USD Million) By Country (2021-2032)
Figure 11. Germany Compound Protein Beverages Revenue (USD Million) By Country (2021-2032)
Figure 12. France Compound Protein Beverages Revenue (USD Million) By Country (2021-2032)
Figure 13. United Kingdom Compound Protein Beverages Revenue (USD Million) By Country (2021-2032)
Figure 14. Spain Compound Protein Beverages Revenue (USD Million) By Country (2021-2032)
Figure 15. Italy Compound Protein Beverages Revenue (USD Million) By Country (2021-2032)
Figure 16. Russia Compound Protein Beverages Revenue (USD Million) By Country (2021-2032)
Figure 17. Rest of Europe Compound Protein Beverages Revenue (USD Million) By Country (2021-2032)
Figure 11. Asia Pacific Compound Protein Beverages Revenue (USD Million) By Country (2021-2032)
Figure 12. China Compound Protein Beverages Revenue (USD Million) By Country (2021-2032)
Figure 13. Japan Compound Protein Beverages Revenue (USD Million) By Country (2021-2032)
Figure 14. India Compound Protein Beverages Revenue (USD Million) By Country (2021-2032)
Figure 15. South Korea Compound Protein Beverages Revenue (USD Million) By Country (2021-2032)
Figure 16. Australia Compound Protein Beverages Revenue (USD Million) By Country (2021-2032)
Figure 17. South East Asia Compound Protein Beverages Revenue (USD Million) By Country (2021-2032)
Figure 18. South America Compound Protein Beverages Revenue (USD Million) By Country (2021-2032)
Figure 19. Brazil Compound Protein Beverages Revenue (USD Million) By Country (2021-2032)
Figure 20. Argentina Compound Protein Beverages Revenue (USD Million) By Country (2021-2032)
Figure 21. Rest of Asia Pacific Compound Protein Beverages Revenue (USD Million) By Country (2021-2032)
Figure 22. Middle East and Africa Compound Protein Beverages Revenue (USD Million) By Region (2021-2032)
Figure 23. Saudi Arabia Compound Protein Beverages Revenue (USD Million) By Region (2021-2032)
Figure 24. The UAE Compound Protein Beverages Revenue (USD Million) By Region (2021-2032)
Figure 25. Rest of Middle East Compound Protein Beverages Revenue (USD Million) By Region (2021-2032)
Figure 26. South Africa Compound Protein Beverages Revenue (USD Million) By Region (2021-2032)
Figure 27. Africa Compound Protein Beverages Revenue (USD Million) By Region (2021-2032)
Figure 28. North America Compound Protein Beverages Revenue (USD Million) By Type (2021-2032)
Figure 29. North America Compound Protein Beverages Revenue (USD Million) By Application (2021-2032)
Figure 30. North America Compound Protein Beverages Revenue (USD Million) By Product (2021-2032)
Figure 31. Europe Compound Protein Beverages Revenue (USD Million) By Type (2021-2032)
Figure 32. Europe Compound Protein Beverages Revenue (USD Million) By Application (2021-2032)
Figure 33. Europe Compound Protein Beverages Revenue (USD Million) By Product (2021-2032)
Figure 34. Asia Pacific Compound Protein Beverages Revenue (USD Million) By Type (2021-2032)
Figure 35. Asia Pacific Compound Protein Beverages Revenue (USD Million) By Application (2021-2032)
Figure 36. Asia Pacific Compound Protein Beverages Revenue (USD Million) By Product (2021-2032)
Figure 37. South America Compound Protein Beverages Revenue (USD Million) By Type (2021-2032)
Figure 38. South America Compound Protein Beverages Revenue (USD Million) By Application (2021-2032)
Figure 39. South America Compound Protein Beverages Revenue (USD Million) By Product (2021-2032)
Figure 40. Middle East and Africa Compound Protein Beverages Revenue (USD Million) By Type (2021-2032)
Figure 41. Middle East and Africa Compound Protein Beverages Revenue (USD Million) By Application (2021-2032)
Figure 42. Middle East and Africa Compound Protein Beverages Revenue (USD Million) By Product (2021-2032)
By Type
Nuts
Beans
Tubers
Others
By Application
Supermarkets/Hypermarkets
Convenience Stores
Online Retail
Others
Countries Analyzed
North America (US, Canada, Mexico)
Europe (Germany, UK, France, Spain, Italy, Russia, Rest of Europe)
Asia Pacific (China, India, Japan, South Korea, Australia, South East Asia, Rest of Asia)
South America (Brazil, Argentina, Rest of South America)
Middle East and Africa (Saudi Arabia, UAE, Rest of Middle East, South Africa, Egypt, Rest of Africa)
