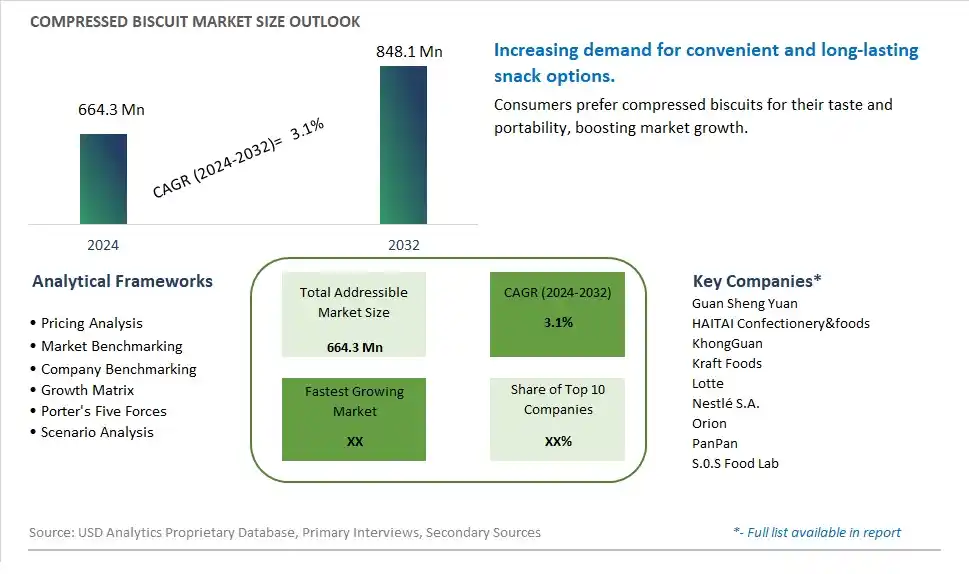
Global Compressed Biscuit Market Size is valued at $664.3 Million in 2024 and is forecast to register a growth rate (CAGR) of 3.1% to reach $848.1 Million by 2032.
The global Compressed Biscuit Market Comprehensive Study analyzes and forecasts the market size across 6 regions and 24 countries for diverse segments -By Type (High-calorie, Low-calorie), By Application (Civil, Military), By Form (Plain, Flavored)
An Introduction to Compressed Biscuit Market
The Compressed Biscuit market in 2024 is expanding steadily, driven by the increasing demand for compact, long-lasting, and nutritious snack options. Compressed biscuits, known for their high energy content and portability, are popular among outdoor enthusiasts, military personnel, and emergency food supply markets. The market is supported by the growing trend towards convenient and durable food products that can be stored for extended periods. Advances in formulation and compression technologies are enhancing the taste, nutritional value, and shelf life of compressed biscuits. The market is also benefiting from the trend towards fortified and high-protein snacks, appealing to consumers seeking reliable and nutritious food options for on-the-go consumption.
Compressed Biscuit Competitive Landscape
The market report analyses the leading companies in the industry including Guan Sheng Yuan, HAITAI Confectionery&foods, KhongGuan, Kraft Foods, Lotte, Nestlé S.A., Orion, PanPan, S.0.S Food Lab, and Others.
Compressed Biscuit Market Dynamics
Compressed Biscuit Market Trend: Shift Towards Healthy and Functional Ingredients in Compressed Biscuits
A prominent market trend in the Compressed Biscuit sector is the shift towards incorporating healthy and functional ingredients. Consumers are increasingly conscious of their dietary choices and are seeking biscuits that offer nutritional benefits such as whole grains, fiber, vitamins, and minerals. This trend is driven by a growing awareness of health and wellness, leading biscuit manufacturers to innovate and reformulate their products to meet the demands of health-conscious consumers.
Compressed Biscuit Market Driver: Convenience and Snacking On-the-Go
The market for Compressed Biscuits is primarily driven by the convenience factor and the popularity of snacking on-the-go. Compressed biscuits are portable, easy to consume, and come in convenient packaging, making them a favored snack choice for busy lifestyles. The driver is reinforced by the versatility of compressed biscuits, which can be consumed as a quick breakfast option, a midday snack, or a light meal replacement, catering to the needs of consumers looking for convenient and satisfying snack solutions.
Compressed Biscuit Market Opportunity: Expansion into Functional and Specialty Varieties
An opportunity within the Compressed Biscuit market lies in the expansion into functional and specialty varieties. Companies can capitalize on the trend towards health and wellness by introducing compressed biscuits fortified with additional nutrients such as protein, omega-3 fatty acids, antioxidants, or probiotics. Moreover, there's potential for developing specialty compressed biscuits targeting specific dietary preferences such as gluten-free, sugar-free, or vegan options, catering to a broader range of consumers. By offering innovative and functional varieties of compressed biscuits, companies can enhance their market presence and appeal to health-conscious and discerning consumers.
Compressed Biscuit Market Share Analysis: High-Calorie Compressed Biscuits segment generated the highest revenue share in the industry
The High-Calorie segment in the Compressed Biscuit Market emerges as the largest segment, showcasing notable growth and consumer preference. High-calorie biscuits are often favored for their indulgent flavors, higher energy content, and satiety value, making them a popular choice among consumers looking for a satisfying snack or quick energy boost. These biscuits contain ingredients like butter, sugar, nuts, and chocolate, offering a rich and flavorful experience. The demand for high-calorie biscuits is driven by various factors, including changing consumer lifestyles, increasing snacking trends, and the convenience of packaged snacks. Additionally, high-calorie biscuits are often marketed as a source of instant energy, making them appealing to individuals with active lifestyles or those seeking quick nutrition on-the-go. As a result, manufacturers and retailers are focusing on product innovation, flavor diversification, and effective marketing strategies to cater to the growing demand within the High-Calorie Compressed Biscuit segment.
Compressed Biscuit Market Share Analysis: Civil Application is the fastest growing segment over the forecast period to 2032
The Civil Application segment in the Compressed Biscuit Market is experiencing rapid growth and significant traction leading up to 2032. This surge in demand is primarily attributed to the expanding consumer base and evolving preferences for convenient, ready-to-eat snacks in various civil settings. Civil applications encompass a wide range of sectors such as retail, hospitality, healthcare, and transportation, where compressed biscuits are favored for their portability, long shelf life, and ease of consumption. In retail and supermarkets, these biscuits are positioned as quick snack options for shoppers on the go, while in hospitality and healthcare, they serve as convenient meal accompaniments or emergency food supplies. Further, the rising trend of outdoor activities, travel, and leisure pursuits further fuels the demand for compressed biscuits in civil applications, as they are convenient to carry and consume during outdoor adventures, picnics, and recreational outings. As a result, manufacturers are focusing on expanding their product offerings, enhancing packaging solutions for portability, and leveraging marketing strategies to capitalize on the growing consumer interest in civil applications of compressed biscuits.
Compressed Biscuit Market Share Analysis: Plain Form segment generated the highest revenue share in the industry
The Plain Form segment dominates the Compressed Biscuit Market as the largest segment, showcasing robust growth and widespread consumer preference. Plain compressed biscuits have garnered significant popularity due to their versatility, simplicity, and broad appeal across diverse consumer demographics. These biscuits are characterized by their neutral taste profile, making them suitable for a wide range of consumption occasions and culinary preferences. They serve as a versatile snack option that can be paired with various beverages such as tea, coffee, or milk, making them ideal for breakfast, snack time, or as a light accompaniment to meals. Additionally, plain compressed biscuits are often preferred by health-conscious consumers who seek snacks with minimal added flavors, sugars, or artificial additives. Their natural and straightforward composition aligns with the growing demand for wholesome and minimally processed food choices. Manufacturers are recognizing this trend and are innovating within the plain segment by introducing variants with enhanced nutritional profiles, such as whole grain options or fortified versions with added vitamins and minerals, further driving the growth and appeal of plain compressed biscuits in the market.
Compressed Biscuit Market Segmentation
By Type
High-calorie
Low-calorie
By Application
Civil
Military
By Form
Plain
Flavored
Countries Analyzed
North America (US, Canada, Mexico)
Europe (Germany, UK, France, Spain, Italy, Russia, Rest of Europe)
Asia Pacific (China, India, Japan, South Korea, Australia, South East Asia, Rest of Asia)
South America (Brazil, Argentina, Rest of South America)
Middle East and Africa (Saudi Arabia, UAE, Rest of Middle East, South Africa, Egypt, Rest of Africa)
Compressed Biscuit Companies Profiled in the Study
Guan Sheng Yuan
HAITAI Confectionery&foods
KhongGuan
Kraft Foods
Lotte
Nestlé S.A.
Orion
PanPan
S.0.S Food Lab
*- List Not Exhaustive
Chapter 1. TABLE OF CONTENTS
Chapter 2. Introduction to Compressed Biscuit Market
2.1. Market Overview
2.2. Key Statistics and Report Highlights
2.3. Scope of the Comprehensive Study
2.3.1. Market Definition
2.3.2 Countries and Regions Covered
2.3.3 Research Objective
2.3.4 Units, Currency, and Conversions
2.3.5 Industry Value Chain
2.4. Key Market Segments
2.5. Key Companies
2.6. Study Period
Chapter 3. Strategic Analysis Review
3.1. Compressed Biscuit Pricing Analysis and Forecast
3.2. Porter’s Five Forces
3.3. Market Ecosystem
3.4. SWOT Analysis
3.5. Regulatory Scenario
3.3. Effects of Inflation, Russia-Ukraine War, moderating economic growth, and other macroeconomic factors
Chapter 4. Competitive Landscape
4.1. Market Share Analysis
4.1.1. Global Compressed Biscuit Market Share by Company, 2023
4.1.2. Product Offerings of Leading Compressed Biscuit Companies
4.2. Market Entropy
4.2.1. New Product Launches in the Industry
4.2.2. Mergers, Acquisitions, Joint ventures, and Partnerships
4.3. Key Strategies and Best Practices
Chapter 5. Global Market Projections: Best, Reference, and Low Case Scenarios
5.1. Growth Analysis- Case Scenario Definitions
5.2. Low Growth Case Scenario Forecasts
5.3. Reference Growth Case Scenario Forecasts
5.4. High Growth Case Scenario Forecasts
Chapter 6. Market Dynamics
6.1. Compressed Biscuit Market Drivers
6.2. Compressed Biscuit Market Challenges
6.6. Compressed Biscuit Market Opportunities
6.4. Compressed Biscuit Market Trends
Chapter 7. Global Compressed Biscuit Market Outlook Trends
7.1. Global Compressed Biscuit Revenue (USD Million) and CAGR (%) by Type (2021-2032)
7.2. Global Compressed Biscuit Revenue (USD Million) and CAGR (%) by Application (2021-2032)
7.3. Global Compressed Biscuit Revenue (USD Million) and CAGR (%) by Product (2021-2032)
By Type
High-calorie
Low-calorie
By Application
Civil
Military
By Form
Plain
Flavored
Chapter 8. Global Compressed Biscuit Regional Analysis and Outlook
8.1. Global Compressed Biscuit Revenue (USD Million) By Regions (2021- 2032)
8.2. North America Compressed Biscuit Revenue (USD Million) by Country (2021-2032)
8.2.1. United States Compressed Biscuit Regional Analysis and Outlook
8.2.2. Canada Compressed Biscuit Regional Analysis and Outlook
8.2.3. Mexico Compressed Biscuit Regional Analysis and Outlook
8.3. Europe Compressed Biscuit Revenue (USD Million), by Country (2021-2032)
8.3.1. Germany Compressed Biscuit Regional Analysis and Outlook
8.3.2. France Compressed Biscuit Regional Analysis and Outlook
8.3.3. United Kingdom Compressed Biscuit Regional Analysis and Outlook
8.3.4. Spain Compressed Biscuit Regional Analysis and Outlook
8.3.5. Italy Compressed Biscuit Regional Analysis and Outlook
8.3.6. Russia Compressed Biscuit Regional Analysis and Outlook
8.3.7. Rest of Europe Compressed Biscuit Regional Analysis and Outlook
8.4. Asia Pacific Compressed Biscuit Revenue (USD Million) by Country (2021-2032)
8.4.1. China Compressed Biscuit Regional Analysis and Outlook
8.4.2. Japan Compressed Biscuit Regional Analysis and Outlook
8.4.3. India Compressed Biscuit Regional Analysis and Outlook
8.4.4. South Korea Compressed Biscuit Regional Analysis and Outlook
8.4.5. Australia Compressed Biscuit Regional Analysis and Outlook
8.4.6. South East Asia Compressed Biscuit Regional Analysis and Outlook
8.4.7. Rest of Asia Pacific Compressed Biscuit Regional Analysis and Outlook
8.5. South America Compressed Biscuit Revenue (USD Million), by Country (2021-2032)
8.5.1. Brazil Compressed Biscuit Regional Analysis and Outlook
8.5.2. Argentina Compressed Biscuit Regional Analysis and Outlook
8.5.3. Rest of South America Compressed Biscuit Regional Analysis and Outlook
8.6. Middle East and Africa Compressed Biscuit Revenue (USD Million) by Country (2021-2032)
8.6.1. Middle East Compressed Biscuit Regional Analysis and Outlook
8.6.2. Africa Compressed Biscuit Regional Analysis and Outlook
Chapter 9. North America Compressed Biscuit Analysis and Outlook
9.1. North America Compressed Biscuit Revenue (USD Million) by Segments (2021-2032)
9.1.1. North America Compressed Biscuit Revenue (USD Million) by Type (2021-2032)
9.1.2. North America Compressed Biscuit Revenue (USD Million) by Application (2021-2032)
9.1.3. North America Compressed Biscuit Revenue (USD Million) by Product (2021-2032)
By Type
High-calorie
Low-calorie
By Application
Civil
Military
By Form
Plain
Flavored
Chapter 10. Europe Compressed Biscuit Analysis and Outlook
10.1. Europe Compressed Biscuit Revenue (USD Million), by Segments (USD Million) (2021-2032)
10.1.1. Europe Compressed Biscuit Revenue (USD Million) by Type (2021-2032)
10.1.2. Europe Compressed Biscuit Revenue (USD Million) by Application (2021-2032)
10.1.3. Europe Compressed Biscuit Revenue (USD Million) by Product (2021-2032)
By Type
High-calorie
Low-calorie
By Application
Civil
Military
By Form
Plain
Flavored
Chapter 11. Asia Pacific Compressed Biscuit Analysis and Outlook
11.1. Asia Pacific Compressed Biscuit Revenue (USD Million), and Revenue (USD Million) by Segments (2021-2032)
11.1.1. Asia Pacific Compressed Biscuit Revenue (USD Million) by Type (2021-2032)
11.1.2. Asia Pacific Compressed Biscuit Revenue (USD Million) by Application (2021-2032)
11.1.3. Asia Pacific Compressed Biscuit Revenue (USD Million) by Product (2021-2032)
By Type
High-calorie
Low-calorie
By Application
Civil
Military
By Form
Plain
Flavored
Chapter 12. South America Compressed Biscuit Analysis and Outlook
12.1. South America Compressed Biscuit Revenue (USD Million), by Segments (2021-2032)
12.1.1. South America Compressed Biscuit Revenue (USD Million) by Type (2021-2032)
12.1.2. South America Compressed Biscuit Revenue (USD Million) by Application (2021-2032)
12.1.3. South America Compressed Biscuit Revenue (USD Million) by Product (2021-2032)
By Type
High-calorie
Low-calorie
By Application
Civil
Military
By Form
Plain
Flavored
Chapter 13. Middle East and Africa Compressed Biscuit Analysis and Outlook
13.1. Middle East and Africa Compressed Biscuit Revenue (USD Million), by Segments (2021-2032)
13.1.1. Middle East and Africa Compressed Biscuit Revenue (USD Million) by Type (2021-2032)
13.1.2. Middle East and Africa Compressed Biscuit Revenue (USD Million) by Application (2021-2032)
13.1.3. Middle East and Africa Compressed Biscuit Revenue (USD Million) by Product (2021-2032)
By Type
High-calorie
Low-calorie
By Application
Civil
Military
By Form
Plain
Flavored
Chapter 14. Compressed Biscuit Company Profiles
14.1 Business Overview
14.2 Product Profiles
14.3 SWOT Profiles
14.5 Recent Developments
14.6 Financial Profile
List of Companies
Guan Sheng Yuan
HAITAI Confectionery&foods
KhongGuan
Kraft Foods
Lotte
Nestlé S.A.
Orion
PanPan
S.0.S Food Lab
15. Methodology and Data Sources
15.1 Customization Offerings
15.2 Subscription Services
15.3 Related Reports
15.4 Publisher Expertise
LIST OF TABLES
Table 1 Market Segmentation Analysis
Table 2 Global Compressed Biscuit Market Share of Leading Companies, 2023
Table 3 Product Offerings of Leading Companies
Table 4 Low Growth Scenario Forecasts
Table 5 Reference Case Growth Scenario
Table 6 High Growth Case Scenario
Table 7 Global Compressed Biscuit Revenue (USD Million) And CAGR (%) By Type (2021-2032)
Table 8 Global Compressed Biscuit Revenue (USD Million) And CAGR (%) By Application (2021-2032)
Table 9 Global Compressed Biscuit Revenue (USD Million) And CAGR (%) By Product (2021-2032)
Table 10 Global Compressed Biscuit Market Revenue (USD Million) By Regions (2021-2032)
Table 11 Global Compressed Biscuit Market Share (%) By Regions (2021-2032)
Table 12 North America Compressed Biscuit Revenue (USD Million) By Country (2021-2032)
Table 13 Europe Compressed Biscuit Revenue (USD Million) By Country (2021-2032)
Table 14 Asia Pacific Compressed Biscuit Revenue (USD Million) By Country (2021-2032)
Table 15 South America Compressed Biscuit Revenue (USD Million) By Country (2021-2032)
Table 16 Middle East and Africa Compressed Biscuit Revenue (USD Million) By Region (2021-2032)
Table 17 North America Compressed Biscuit Revenue (USD Million) By Type (2021-2032)
Table 18 North America Compressed Biscuit Revenue (USD Million) By Application (2021-2032)
Table 19 North America Compressed Biscuit Revenue (USD Million) By Product (2021-2032)
Table 20 Europe Compressed Biscuit Revenue (USD Million) By Type (2021-2032)
Table 21 Europe Compressed Biscuit Revenue (USD Million) By Application (2021-2032)
Table 22 Europe Compressed Biscuit Revenue (USD Million) By Product (2021-2032)
Table 23 Asia Pacific Compressed Biscuit Revenue (USD Million) By Type (2021-2032)
Table 24 Asia Pacific Compressed Biscuit Revenue (USD Million) By Application (2021-2032)
Table 25 Asia Pacific Compressed Biscuit Revenue (USD Million) By Product (2021-2032)
Table 26 South America Compressed Biscuit Revenue (USD Million) By Type (2021-2032)
Table 27 South America Compressed Biscuit Revenue (USD Million) By Application (2021-2032)
Table 28 South America Compressed Biscuit Revenue (USD Million) By Product (2021-2032)
Table 29 Middle East and Africa Compressed Biscuit Revenue (USD Million) By Type (2021-2032)
Table 30 Middle East and Africa Compressed Biscuit Revenue (USD Million) By Application (2021-2032)
Table 31 Middle East and Africa Compressed Biscuit Revenue (USD Million) By Product (2021-2032)
LIST OF FIGURES
Figure 1. Market Scope
Figure 2. Pricing Forecasts Per Unit, 2023- 2032
Figure 3. Porter’s Five Forces
Figure 4. Global Compressed Biscuit Market Revenue (USD Million) By Regions (2021-2032)
Figure 5. Global Compressed Biscuit Market Share (%) By Regions (2023)
Figure 6. North America Compressed Biscuit Revenue (USD Million) By Country (2021-2032)
Figure 7. United States Compressed Biscuit Revenue (USD Million) By Country (2021-2032)
Figure 8. Canada Compressed Biscuit Revenue (USD Million) By Country (2021-2032)
Figure 9. Mexico Compressed Biscuit Revenue (USD Million) By Country (2021-2032)
Figure 10. Europe Compressed Biscuit Revenue (USD Million) By Country (2021-2032)
Figure 11. Germany Compressed Biscuit Revenue (USD Million) By Country (2021-2032)
Figure 12. France Compressed Biscuit Revenue (USD Million) By Country (2021-2032)
Figure 13. United Kingdom Compressed Biscuit Revenue (USD Million) By Country (2021-2032)
Figure 14. Spain Compressed Biscuit Revenue (USD Million) By Country (2021-2032)
Figure 15. Italy Compressed Biscuit Revenue (USD Million) By Country (2021-2032)
Figure 16. Russia Compressed Biscuit Revenue (USD Million) By Country (2021-2032)
Figure 17. Rest of Europe Compressed Biscuit Revenue (USD Million) By Country (2021-2032)
Figure 11. Asia Pacific Compressed Biscuit Revenue (USD Million) By Country (2021-2032)
Figure 12. China Compressed Biscuit Revenue (USD Million) By Country (2021-2032)
Figure 13. Japan Compressed Biscuit Revenue (USD Million) By Country (2021-2032)
Figure 14. India Compressed Biscuit Revenue (USD Million) By Country (2021-2032)
Figure 15. South Korea Compressed Biscuit Revenue (USD Million) By Country (2021-2032)
Figure 16. Australia Compressed Biscuit Revenue (USD Million) By Country (2021-2032)
Figure 17. South East Asia Compressed Biscuit Revenue (USD Million) By Country (2021-2032)
Figure 18. South America Compressed Biscuit Revenue (USD Million) By Country (2021-2032)
Figure 19. Brazil Compressed Biscuit Revenue (USD Million) By Country (2021-2032)
Figure 20. Argentina Compressed Biscuit Revenue (USD Million) By Country (2021-2032)
Figure 21. Rest of Asia Pacific Compressed Biscuit Revenue (USD Million) By Country (2021-2032)
Figure 22. Middle East and Africa Compressed Biscuit Revenue (USD Million) By Region (2021-2032)
Figure 23. Saudi Arabia Compressed Biscuit Revenue (USD Million) By Region (2021-2032)
Figure 24. The UAE Compressed Biscuit Revenue (USD Million) By Region (2021-2032)
Figure 25. Rest of Middle East Compressed Biscuit Revenue (USD Million) By Region (2021-2032)
Figure 26. South Africa Compressed Biscuit Revenue (USD Million) By Region (2021-2032)
Figure 27. Africa Compressed Biscuit Revenue (USD Million) By Region (2021-2032)
Figure 28. North America Compressed Biscuit Revenue (USD Million) By Type (2021-2032)
Figure 29. North America Compressed Biscuit Revenue (USD Million) By Application (2021-2032)
Figure 30. North America Compressed Biscuit Revenue (USD Million) By Product (2021-2032)
Figure 31. Europe Compressed Biscuit Revenue (USD Million) By Type (2021-2032)
Figure 32. Europe Compressed Biscuit Revenue (USD Million) By Application (2021-2032)
Figure 33. Europe Compressed Biscuit Revenue (USD Million) By Product (2021-2032)
Figure 34. Asia Pacific Compressed Biscuit Revenue (USD Million) By Type (2021-2032)
Figure 35. Asia Pacific Compressed Biscuit Revenue (USD Million) By Application (2021-2032)
Figure 36. Asia Pacific Compressed Biscuit Revenue (USD Million) By Product (2021-2032)
Figure 37. South America Compressed Biscuit Revenue (USD Million) By Type (2021-2032)
Figure 38. South America Compressed Biscuit Revenue (USD Million) By Application (2021-2032)
Figure 39. South America Compressed Biscuit Revenue (USD Million) By Product (2021-2032)
Figure 40. Middle East and Africa Compressed Biscuit Revenue (USD Million) By Type (2021-2032)
Figure 41. Middle East and Africa Compressed Biscuit Revenue (USD Million) By Application (2021-2032)
Figure 42. Middle East and Africa Compressed Biscuit Revenue (USD Million) By Product (2021-2032)
By Type
High-calorie
Low-calorie
By Application
Civil
Military
By Form
Plain
Flavored
Countries Analyzed
North America (US, Canada, Mexico)
Europe (Germany, UK, France, Spain, Italy, Russia, Rest of Europe)
Asia Pacific (China, India, Japan, South Korea, Australia, South East Asia, Rest of Asia)
South America (Brazil, Argentina, Rest of South America)
Middle East and Africa (Saudi Arabia, UAE, Rest of Middle East, South Africa, Egypt, Rest of Africa)
