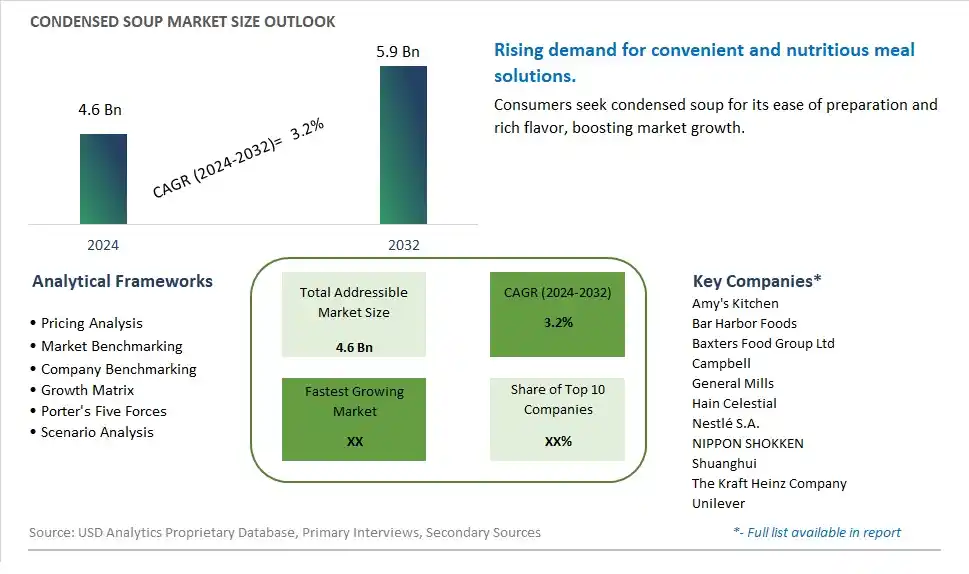
Global Condensed Soup Market Size is valued at $4.6 Billion in 2024 and is forecast to register a growth rate (CAGR) of 3.2% to reach $5.9 Billion by 2032.
The global Condensed Soup Market Comprehensive Study analyzes and forecasts the market size across 6 regions and 24 countries for diverse segments -By Type (Regular, Organic), By Application (Personal, Group)
An Introduction to Condensed Soup Market
In 2024, the Condensed Soup market is witnessing significant growth, driven by the increasing demand for convenient and flavorful meal options. Condensed soups, which are concentrated soups that require dilution before consumption, are popular for their rich taste and ease of preparation. The market is supported by the growing trend towards ready-to-eat and easy-to-prepare foods. Advances in soup formulation and packaging technologies are enhancing the quality, flavor, and nutritional content of condensed soups. The market is also benefiting from the trend towards clean-label and natural ingredients, appealing to consumers seeking high-quality and wholesome meal solutions.
Condensed Soup Competitive Landscape
The market report analyses the leading companies in the industry including Amy's Kitchen, Bar Harbor Foods, Baxters Food Group Ltd, Campbell, General Mills, Hain Celestial, Nestlé S.A., NIPPON SHOKKEN, Shuanghui, The Kraft Heinz Company, Unilever, and Others.
Condensed Soup Market Dynamics
Condensed Soup Market Trend: Growing Demand for Convenient and Ready-to-Eat Meals
The most prominent trend in the Condensed Soup market is the growing demand for convenient and ready-to-eat meals. Consumers, especially those with busy lifestyles, are seeking quick and easy meal solutions without compromising on taste or nutrition. Condensed soups offer a convenient option that can be easily prepared by adding water or milk, making them a popular choice for consumers looking for hassle-free meal options.
Condensed Soup Market Driver: Shift Towards Healthier and Nutritious Food Choices
The primary driver for the Condensed Soup market is the shift towards healthier and nutritious food choices among consumers. Manufacturers are responding to this trend by offering a variety of options, including low-sodium, organic, and gluten-free condensed soups. These healthier alternatives appeal to health-conscious consumers who are mindful of their dietary preferences and nutritional intake.
Condensed Soup Market Opportunity: Innovation in Flavor Profiles and Packaging
An opportunity within the Condensed Soup market lies in innovation in flavor profiles and packaging. Manufacturers can explore creating new and unique flavor combinations to cater to diverse consumer tastes and preferences. Additionally, investing in convenient and eco-friendly packaging solutions, such as single-serve pouches or recyclable containers, can enhance the appeal of condensed soups and attract environmentally-conscious consumers.
Condensed Soup Market Share Analysis: Regular segment generated the highest revenue share in the industry
The Regular segment is the largest in the Condensed Soup Market by type. This segment's prominence is primarily due to its widespread consumer acceptance and affordability. Regular condensed soups have been a staple in many households for decades, known for their convenience and ease of preparation. They offer a quick, nutritious meal option, making them popular among busy individuals and families. The extensive variety of flavors and recipes available in the regular segment caters to diverse taste preferences, further driving its market dominance. Additionally, regular condensed soups benefit from robust distribution networks, being readily available in supermarkets, grocery stores, and online platforms. The long shelf life and economical pricing of regular condensed soups also contribute to their broad appeal, particularly in cost-sensitive markets. Furthermore, marketing efforts and brand loyalty play significant roles in maintaining the segment's leading position. Despite the growing interest in organic and health-conscious options, the regular segment continues to capture the largest market share due to its established presence, accessibility, and value proposition for consumers.
Condensed Soup Market Share Analysis: Personal is the fastest growing segment over the forecast period to 2032
The Personal segment is projected to be the fastest-growing application in the Condensed Soup Market by 2032. This growth is driven by several factors, reflecting changing consumer behaviors and preferences. With the rise in single-person households, particularly in urban areas, there is an increasing demand for convenient, single-serving food options. Personal condensed soups cater to this demographic by offering quick, easy-to-prepare meals that fit into the busy lifestyles of individuals. The trend towards health and wellness also plays a role, as more consumers seek portion-controlled meals that help them manage their dietary intake effectively. Additionally, the expansion of on-the-go eating habits, fueled by hectic work schedules and the need for mobility, boosts the demand for individually packaged food items. Innovations in packaging, such as microwaveable and resealable options, further enhance the convenience and appeal of personal condensed soups. The growing awareness of food waste reduction also supports this segment, as single-serving portions help minimize leftovers. As a result, the personal segment is expected to experience significant growth, driven by convenience, lifestyle trends, and the increasing number of single-person households.
Condensed Soup Market Segmentation
By Type
Regular
Organic
By Application
Personal
Group
Countries Analyzed
North America (US, Canada, Mexico)
Europe (Germany, UK, France, Spain, Italy, Russia, Rest of Europe)
Asia Pacific (China, India, Japan, South Korea, Australia, South East Asia, Rest of Asia)
South America (Brazil, Argentina, Rest of South America)
Middle East and Africa (Saudi Arabia, UAE, Rest of Middle East, South Africa, Egypt, Rest of Africa)
Condensed Soup Companies Profiled in the Study
Amy's Kitchen
Bar Harbor Foods
Baxters Food Group Ltd
Campbell
General Mills
Hain Celestial
Nestlé S.A.
NIPPON SHOKKEN
Shuanghui
The Kraft Heinz Company
Unilever
*- List Not Exhaustive
Chapter 1. TABLE OF CONTENTS
Chapter 2. Introduction to Condensed Soup Market
2.1. Market Overview
2.2. Key Statistics and Report Highlights
2.3. Scope of the Comprehensive Study
2.3.1. Market Definition
2.3.2 Countries and Regions Covered
2.3.3 Research Objective
2.3.4 Units, Currency, and Conversions
2.3.5 Industry Value Chain
2.4. Key Market Segments
2.5. Key Companies
2.6. Study Period
Chapter 3. Strategic Analysis Review
3.1. Condensed Soup Pricing Analysis and Forecast
3.2. Porter’s Five Forces
3.3. Market Ecosystem
3.4. SWOT Analysis
3.5. Regulatory Scenario
3.3. Effects of Inflation, Russia-Ukraine War, moderating economic growth, and other macroeconomic factors
Chapter 4. Competitive Landscape
4.1. Market Share Analysis
4.1.1. Global Condensed Soup Market Share by Company, 2023
4.1.2. Product Offerings of Leading Condensed Soup Companies
4.2. Market Entropy
4.2.1. New Product Launches in the Industry
4.2.2. Mergers, Acquisitions, Joint ventures, and Partnerships
4.3. Key Strategies and Best Practices
Chapter 5. Global Market Projections: Best, Reference, and Low Case Scenarios
5.1. Growth Analysis- Case Scenario Definitions
5.2. Low Growth Case Scenario Forecasts
5.3. Reference Growth Case Scenario Forecasts
5.4. High Growth Case Scenario Forecasts
Chapter 6. Market Dynamics
6.1. Condensed Soup Market Drivers
6.2. Condensed Soup Market Challenges
6.6. Condensed Soup Market Opportunities
6.4. Condensed Soup Market Trends
Chapter 7. Global Condensed Soup Market Outlook Trends
7.1. Global Condensed Soup Revenue (USD Million) and CAGR (%) by Type (2021-2032)
7.2. Global Condensed Soup Revenue (USD Million) and CAGR (%) by Application (2021-2032)
7.3. Global Condensed Soup Revenue (USD Million) and CAGR (%) by Product (2021-2032)
By Type
Regular
Organic
By Application
Personal
Group
Chapter 8. Global Condensed Soup Regional Analysis and Outlook
8.1. Global Condensed Soup Revenue (USD Million) By Regions (2021- 2032)
8.2. North America Condensed Soup Revenue (USD Million) by Country (2021-2032)
8.2.1. United States Condensed Soup Regional Analysis and Outlook
8.2.2. Canada Condensed Soup Regional Analysis and Outlook
8.2.3. Mexico Condensed Soup Regional Analysis and Outlook
8.3. Europe Condensed Soup Revenue (USD Million), by Country (2021-2032)
8.3.1. Germany Condensed Soup Regional Analysis and Outlook
8.3.2. France Condensed Soup Regional Analysis and Outlook
8.3.3. United Kingdom Condensed Soup Regional Analysis and Outlook
8.3.4. Spain Condensed Soup Regional Analysis and Outlook
8.3.5. Italy Condensed Soup Regional Analysis and Outlook
8.3.6. Russia Condensed Soup Regional Analysis and Outlook
8.3.7. Rest of Europe Condensed Soup Regional Analysis and Outlook
8.4. Asia Pacific Condensed Soup Revenue (USD Million) by Country (2021-2032)
8.4.1. China Condensed Soup Regional Analysis and Outlook
8.4.2. Japan Condensed Soup Regional Analysis and Outlook
8.4.3. India Condensed Soup Regional Analysis and Outlook
8.4.4. South Korea Condensed Soup Regional Analysis and Outlook
8.4.5. Australia Condensed Soup Regional Analysis and Outlook
8.4.6. South East Asia Condensed Soup Regional Analysis and Outlook
8.4.7. Rest of Asia Pacific Condensed Soup Regional Analysis and Outlook
8.5. South America Condensed Soup Revenue (USD Million), by Country (2021-2032)
8.5.1. Brazil Condensed Soup Regional Analysis and Outlook
8.5.2. Argentina Condensed Soup Regional Analysis and Outlook
8.5.3. Rest of South America Condensed Soup Regional Analysis and Outlook
8.6. Middle East and Africa Condensed Soup Revenue (USD Million) by Country (2021-2032)
8.6.1. Middle East Condensed Soup Regional Analysis and Outlook
8.6.2. Africa Condensed Soup Regional Analysis and Outlook
Chapter 9. North America Condensed Soup Analysis and Outlook
9.1. North America Condensed Soup Revenue (USD Million) by Segments (2021-2032)
9.1.1. North America Condensed Soup Revenue (USD Million) by Type (2021-2032)
9.1.2. North America Condensed Soup Revenue (USD Million) by Application (2021-2032)
9.1.3. North America Condensed Soup Revenue (USD Million) by Product (2021-2032)
By Type
Regular
Organic
By Application
Personal
Group
Chapter 10. Europe Condensed Soup Analysis and Outlook
10.1. Europe Condensed Soup Revenue (USD Million), by Segments (USD Million) (2021-2032)
10.1.1. Europe Condensed Soup Revenue (USD Million) by Type (2021-2032)
10.1.2. Europe Condensed Soup Revenue (USD Million) by Application (2021-2032)
10.1.3. Europe Condensed Soup Revenue (USD Million) by Product (2021-2032)
By Type
Regular
Organic
By Application
Personal
Group
Chapter 11. Asia Pacific Condensed Soup Analysis and Outlook
11.1. Asia Pacific Condensed Soup Revenue (USD Million), and Revenue (USD Million) by Segments (2021-2032)
11.1.1. Asia Pacific Condensed Soup Revenue (USD Million) by Type (2021-2032)
11.1.2. Asia Pacific Condensed Soup Revenue (USD Million) by Application (2021-2032)
11.1.3. Asia Pacific Condensed Soup Revenue (USD Million) by Product (2021-2032)
By Type
Regular
Organic
By Application
Personal
Group
Chapter 12. South America Condensed Soup Analysis and Outlook
12.1. South America Condensed Soup Revenue (USD Million), by Segments (2021-2032)
12.1.1. South America Condensed Soup Revenue (USD Million) by Type (2021-2032)
12.1.2. South America Condensed Soup Revenue (USD Million) by Application (2021-2032)
12.1.3. South America Condensed Soup Revenue (USD Million) by Product (2021-2032)
By Type
Regular
Organic
By Application
Personal
Group
Chapter 13. Middle East and Africa Condensed Soup Analysis and Outlook
13.1. Middle East and Africa Condensed Soup Revenue (USD Million), by Segments (2021-2032)
13.1.1. Middle East and Africa Condensed Soup Revenue (USD Million) by Type (2021-2032)
13.1.2. Middle East and Africa Condensed Soup Revenue (USD Million) by Application (2021-2032)
13.1.3. Middle East and Africa Condensed Soup Revenue (USD Million) by Product (2021-2032)
By Type
Regular
Organic
By Application
Personal
Group
Chapter 14. Condensed Soup Company Profiles
14.1 Business Overview
14.2 Product Profiles
14.3 SWOT Profiles
14.5 Recent Developments
14.6 Financial Profile
List of Companies
Amy's Kitchen
Bar Harbor Foods
Baxters Food Group Ltd
Campbell
General Mills
Hain Celestial
Nestlé S.A.
NIPPON SHOKKEN
Shuanghui
The Kraft Heinz Company
Unilever
15. Methodology and Data Sources
15.1 Customization Offerings
15.2 Subscription Services
15.3 Related Reports
15.4 Publisher Expertise
LIST OF TABLES
Table 1 Market Segmentation Analysis
Table 2 Global Condensed Soup Market Share of Leading Companies, 2023
Table 3 Product Offerings of Leading Companies
Table 4 Low Growth Scenario Forecasts
Table 5 Reference Case Growth Scenario
Table 6 High Growth Case Scenario
Table 7 Global Condensed Soup Revenue (USD Million) And CAGR (%) By Type (2021-2032)
Table 8 Global Condensed Soup Revenue (USD Million) And CAGR (%) By Application (2021-2032)
Table 9 Global Condensed Soup Revenue (USD Million) And CAGR (%) By Product (2021-2032)
Table 10 Global Condensed Soup Market Revenue (USD Million) By Regions (2021-2032)
Table 11 Global Condensed Soup Market Share (%) By Regions (2021-2032)
Table 12 North America Condensed Soup Revenue (USD Million) By Country (2021-2032)
Table 13 Europe Condensed Soup Revenue (USD Million) By Country (2021-2032)
Table 14 Asia Pacific Condensed Soup Revenue (USD Million) By Country (2021-2032)
Table 15 South America Condensed Soup Revenue (USD Million) By Country (2021-2032)
Table 16 Middle East and Africa Condensed Soup Revenue (USD Million) By Region (2021-2032)
Table 17 North America Condensed Soup Revenue (USD Million) By Type (2021-2032)
Table 18 North America Condensed Soup Revenue (USD Million) By Application (2021-2032)
Table 19 North America Condensed Soup Revenue (USD Million) By Product (2021-2032)
Table 20 Europe Condensed Soup Revenue (USD Million) By Type (2021-2032)
Table 21 Europe Condensed Soup Revenue (USD Million) By Application (2021-2032)
Table 22 Europe Condensed Soup Revenue (USD Million) By Product (2021-2032)
Table 23 Asia Pacific Condensed Soup Revenue (USD Million) By Type (2021-2032)
Table 24 Asia Pacific Condensed Soup Revenue (USD Million) By Application (2021-2032)
Table 25 Asia Pacific Condensed Soup Revenue (USD Million) By Product (2021-2032)
Table 26 South America Condensed Soup Revenue (USD Million) By Type (2021-2032)
Table 27 South America Condensed Soup Revenue (USD Million) By Application (2021-2032)
Table 28 South America Condensed Soup Revenue (USD Million) By Product (2021-2032)
Table 29 Middle East and Africa Condensed Soup Revenue (USD Million) By Type (2021-2032)
Table 30 Middle East and Africa Condensed Soup Revenue (USD Million) By Application (2021-2032)
Table 31 Middle East and Africa Condensed Soup Revenue (USD Million) By Product (2021-2032)
LIST OF FIGURES
Figure 1. Market Scope
Figure 2. Pricing Forecasts Per Unit, 2023- 2032
Figure 3. Porter’s Five Forces
Figure 4. Global Condensed Soup Market Revenue (USD Million) By Regions (2021-2032)
Figure 5. Global Condensed Soup Market Share (%) By Regions (2023)
Figure 6. North America Condensed Soup Revenue (USD Million) By Country (2021-2032)
Figure 7. United States Condensed Soup Revenue (USD Million) By Country (2021-2032)
Figure 8. Canada Condensed Soup Revenue (USD Million) By Country (2021-2032)
Figure 9. Mexico Condensed Soup Revenue (USD Million) By Country (2021-2032)
Figure 10. Europe Condensed Soup Revenue (USD Million) By Country (2021-2032)
Figure 11. Germany Condensed Soup Revenue (USD Million) By Country (2021-2032)
Figure 12. France Condensed Soup Revenue (USD Million) By Country (2021-2032)
Figure 13. United Kingdom Condensed Soup Revenue (USD Million) By Country (2021-2032)
Figure 14. Spain Condensed Soup Revenue (USD Million) By Country (2021-2032)
Figure 15. Italy Condensed Soup Revenue (USD Million) By Country (2021-2032)
Figure 16. Russia Condensed Soup Revenue (USD Million) By Country (2021-2032)
Figure 17. Rest of Europe Condensed Soup Revenue (USD Million) By Country (2021-2032)
Figure 11. Asia Pacific Condensed Soup Revenue (USD Million) By Country (2021-2032)
Figure 12. China Condensed Soup Revenue (USD Million) By Country (2021-2032)
Figure 13. Japan Condensed Soup Revenue (USD Million) By Country (2021-2032)
Figure 14. India Condensed Soup Revenue (USD Million) By Country (2021-2032)
Figure 15. South Korea Condensed Soup Revenue (USD Million) By Country (2021-2032)
Figure 16. Australia Condensed Soup Revenue (USD Million) By Country (2021-2032)
Figure 17. South East Asia Condensed Soup Revenue (USD Million) By Country (2021-2032)
Figure 18. South America Condensed Soup Revenue (USD Million) By Country (2021-2032)
Figure 19. Brazil Condensed Soup Revenue (USD Million) By Country (2021-2032)
Figure 20. Argentina Condensed Soup Revenue (USD Million) By Country (2021-2032)
Figure 21. Rest of Asia Pacific Condensed Soup Revenue (USD Million) By Country (2021-2032)
Figure 22. Middle East and Africa Condensed Soup Revenue (USD Million) By Region (2021-2032)
Figure 23. Saudi Arabia Condensed Soup Revenue (USD Million) By Region (2021-2032)
Figure 24. The UAE Condensed Soup Revenue (USD Million) By Region (2021-2032)
Figure 25. Rest of Middle East Condensed Soup Revenue (USD Million) By Region (2021-2032)
Figure 26. South Africa Condensed Soup Revenue (USD Million) By Region (2021-2032)
Figure 27. Africa Condensed Soup Revenue (USD Million) By Region (2021-2032)
Figure 28. North America Condensed Soup Revenue (USD Million) By Type (2021-2032)
Figure 29. North America Condensed Soup Revenue (USD Million) By Application (2021-2032)
Figure 30. North America Condensed Soup Revenue (USD Million) By Product (2021-2032)
Figure 31. Europe Condensed Soup Revenue (USD Million) By Type (2021-2032)
Figure 32. Europe Condensed Soup Revenue (USD Million) By Application (2021-2032)
Figure 33. Europe Condensed Soup Revenue (USD Million) By Product (2021-2032)
Figure 34. Asia Pacific Condensed Soup Revenue (USD Million) By Type (2021-2032)
Figure 35. Asia Pacific Condensed Soup Revenue (USD Million) By Application (2021-2032)
Figure 36. Asia Pacific Condensed Soup Revenue (USD Million) By Product (2021-2032)
Figure 37. South America Condensed Soup Revenue (USD Million) By Type (2021-2032)
Figure 38. South America Condensed Soup Revenue (USD Million) By Application (2021-2032)
Figure 39. South America Condensed Soup Revenue (USD Million) By Product (2021-2032)
Figure 40. Middle East and Africa Condensed Soup Revenue (USD Million) By Type (2021-2032)
Figure 41. Middle East and Africa Condensed Soup Revenue (USD Million) By Application (2021-2032)
Figure 42. Middle East and Africa Condensed Soup Revenue (USD Million) By Product (2021-2032)
By Type
Regular
Organic
By Application
Personal
Group
Countries Analyzed
North America (US, Canada, Mexico)
Europe (Germany, UK, France, Spain, Italy, Russia, Rest of Europe)
Asia Pacific (China, India, Japan, South Korea, Australia, South East Asia, Rest of Asia)
South America (Brazil, Argentina, Rest of South America)
Middle East and Africa (Saudi Arabia, UAE, Rest of Middle East, South Africa, Egypt, Rest of Africa)
