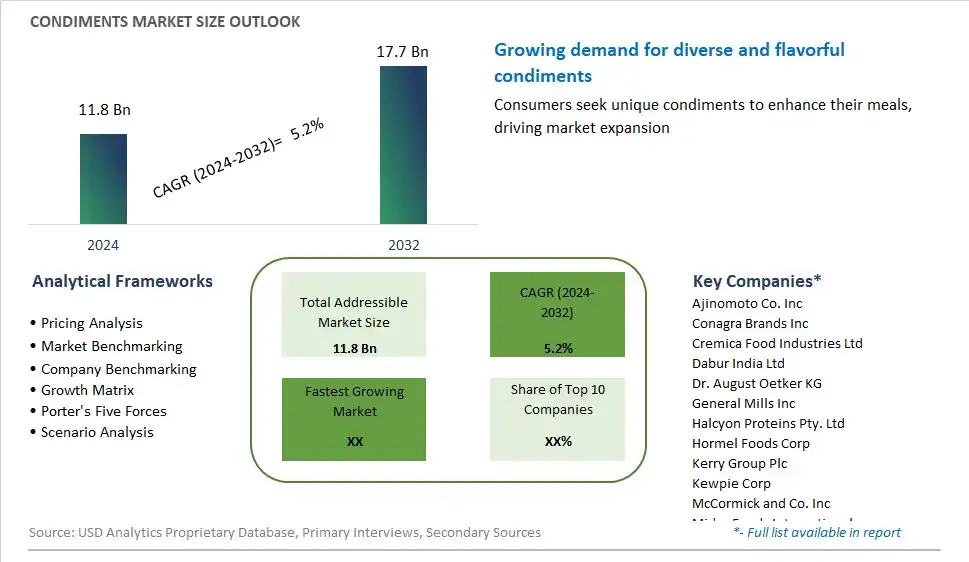
Global Condiments Market Size is valued at $11.8 Billion in 2024 and is forecast to register a growth rate (CAGR) of 5.2% to reach $17.7 Billion by 2032.
The global Condiments Market Comprehensive Study analyzes and forecasts the market size across 6 regions and 24 countries for diverse segments -By Product (Table Sauces, Cooking Ingredients, Mustard, Others), By Distribution Channel (Offline, Online)
An Introduction to Condiments Market
In 2024, the condiments market remains vibrant and dynamic, driven by shifting consumer preferences, culinary diversity, and innovations in flavor profiles and packaging formats. Condiments, which include a wide range of sauces, spreads, dips, and seasonings, play a crucial role in enhancing the taste, texture, and overall dining experience of various dishes across different cuisines and cultures. The market caters to diverse consumer preferences for flavor intensity, heat levels, dietary requirements, and cultural influences, offering an extensive array of condiment options ranging from traditional favorites to globally inspired creations. With the growing interest in ethnic cuisines, fusion flavors, and gourmet dining experiences, condiment manufacturers are innovating to develop new product formulations that cater to evolving taste preferences and culinary trends. Moreover, the market benefits from the rising demand for natural, organic, and clean label condiments, as well as the adoption of sustainable packaging materials and eco-friendly production practices, aligning with consumer expectations for transparency, authenticity, and environmental responsibility. As condiments continue to play a central role in shaping flavor profiles and enhancing meal experiences across foodservice, retail, and culinary sectors, the market presents opportunities for manufacturers to innovate, differentiate, and capture market share in an increasingly competitive and dynamic landscape.
Condiments Competitive Landscape
The market report analyses the leading companies in the industry including Ajinomoto Co. Inc, Conagra Brands Inc, Cremica Food Industries Ltd, Dabur India Ltd, Dr. August Oetker KG, General Mills Inc, Halcyon Proteins Pty. Ltd, Hormel Foods Corp, Kerry Group Plc, Kewpie Corp, McCormick and Co. Inc, Midas Foods International, Nestle SA, NutriAsia Inc, Patanjali Ayurved Ltd, Three Threes Condiments Pty Ltd, and Others.
Condiments Market Dynamics
Condiments Market Trend: Demand for Ethnic and Artisanal Condiments
The most prominent market trend for Condiments is the increasing demand for ethnic and artisanal varieties, driven by consumers' desire for diverse flavor experiences and culinary exploration. As globalization continues to influence food trends, consumers are seeking condiments that offer unique flavors, ingredients, and cultural authenticity. This trend encompasses a wide range of ethnic condiments such as sriracha, harissa, gochujang, and chimichurri, as well as artisanal creations made by small-batch producers using high-quality, locally sourced ingredients. With the rise of food tourism and social media-driven food culture, there's a growing appreciation for condiments that add complexity and depth to dishes, inspiring home cooks and chefs to experiment with global flavors in their culinary creations.
Market Driver: Health and Wellness Consciousness
A significant market driver for Condiments is the increasing focus on health and wellness among consumers, leading to a shift towards cleaner and more transparent ingredient labels in condiment products. With rising concerns about additives, preservatives, and artificial ingredients in processed foods, consumers are seeking condiments that are made with natural, organic, and clean-label ingredients. This driver is fueled by a growing awareness of the link between diet and health, as well as dietary preferences such as vegan, gluten-free, and paleo lifestyles. As a result, there's a demand for condiments that offer nutritional benefits, such as low sodium, sugar-free, or probiotic-rich options, catering to a diverse range of dietary needs and preferences.
Market Opportunity: Innovation in Packaging and Sustainability
An opportunity in the Condiments market lies in innovation in packaging and sustainability initiatives to meet the growing consumer demand for eco-friendly and convenient options. Companies can explore opportunities to develop packaging solutions that enhance product freshness, shelf life, and ease of use, such as resealable pouches, single-serve packets, or portion-controlled dispensers. Additionally, there's a growing emphasis on sustainable packaging materials, such as recyclable, compostable, or biodegradable options, to reduce environmental impact and waste. By investing in sustainable packaging practices and communicating transparently with consumers about their commitment to environmental stewardship, condiment manufacturers can differentiate their products in the market and appeal to environmentally conscious consumers seeking eco-friendly alternatives.
Condiments Market Share Analysis: Table Sauces held the dominant market share in 2024
In the Condiments market segmentation, the Table Sauces category is the largest and most significant segment. This dominance is primarily driven by the widespread usage and versatile applications of table sauces in enhancing flavor profiles and complementing a variety of dishes. Table sauces, including ketchup, mayonnaise, mustard, and salsa, are staples in households and foodservice establishments worldwide, offering consumers a convenient way to add flavor and richness to their meals. Further, the growing popularity of diverse cuisines and dining experiences has led to increased demand for a wide range of table sauces to cater to varying taste preferences and culinary traditions. Additionally, the ubiquity of table sauces in fast-food chains, restaurants, and casual dining outlets further contributes to their market dominance. As a result, the Table Sauces segment continues to shape the landscape of the Condiments market, offering essential flavor enhancers and culinary essentials for consumers globally.
Condiments Market Share Analysis: Online market is poised to register the fastest growth rae over the forecast period to 2032
In the Condiments market segmentation, the Online distribution channel is the fastest-growing segment, driven by the increasing adoption of e-commerce platforms and shifting consumer preferences towards online shopping. With the convenience of browsing and purchasing condiments from the comfort of their homes, consumers are increasingly turning to online channels to meet their culinary needs. The online platform offers a wide selection of condiments from various brands, allowing consumers to explore new flavors and specialty products that may not be readily available in brick-and-mortar stores. Further, the COVID-19 pandemic has accelerated the shift towards online shopping as consumers prioritize safety and contactless transactions. Additionally, the availability of user reviews, product recommendations, and personalized shopping experiences online further enhances the appeal of this distribution channel. As a result, online platforms continue to gain momentum in the Condiments market, reshaping the landscape of consumer purchasing habits and driving market growth.
Condiments Market Segmentation
By Product
Table Sauces
Cooking Ingredients
Mustard
Others
By Distribution Channel
Offline
Online
Countries Analyzed
North America (US, Canada, Mexico)
Europe (Germany, UK, France, Spain, Italy, Russia, Rest of Europe)
Asia Pacific (China, India, Japan, South Korea, Australia, South East Asia, Rest of Asia)
South America (Brazil, Argentina, Rest of South America)
Middle East and Africa (Saudi Arabia, UAE, Rest of Middle East, South Africa, Egypt, Rest of Africa)
Condiments Companies Profiled in the Study
Ajinomoto Co. Inc
Conagra Brands Inc
Cremica Food Industries Ltd
Dabur India Ltd
Dr. August Oetker KG
General Mills Inc
Halcyon Proteins Pty. Ltd
Hormel Foods Corp
Kerry Group Plc
Kewpie Corp
McCormick and Co. Inc
Midas Foods International
Nestle SA
NutriAsia Inc
Patanjali Ayurved Ltd
Three Threes Condiments Pty Ltd
*- List Not Exhaustive
Chapter 1. TABLE OF CONTENTS
Chapter 2. Introduction to Condiments Market
2.1. Market Overview
2.2. Key Statistics and Report Highlights
2.3. Scope of the Comprehensive Study
2.3.1. Market Definition
2.3.2 Countries and Regions Covered
2.3.3 Research Objective
2.3.4 Units, Currency, and Conversions
2.3.5 Industry Value Chain
2.4. Key Market Segments
2.5. Key Companies
2.6. Study Period
Chapter 3. Strategic Analysis Review
3.1. Condiments Pricing Analysis and Forecast
3.2. Porter’s Five Forces
3.3. Market Ecosystem
3.4. SWOT Analysis
3.5. Regulatory Scenario
3.3. Effects of Inflation, Russia-Ukraine War, moderating economic growth, and other macroeconomic factors
Chapter 4. Competitive Landscape
4.1. Market Share Analysis
4.1.1. Global Condiments Market Share by Company, 2023
4.1.2. Product Offerings of Leading Condiments Companies
4.2. Market Entropy
4.2.1. New Product Launches in the Industry
4.2.2. Mergers, Acquisitions, Joint ventures, and Partnerships
4.3. Key Strategies and Best Practices
Chapter 5. Global Market Projections: Best, Reference, and Low Case Scenarios
5.1. Growth Analysis- Case Scenario Definitions
5.2. Low Growth Case Scenario Forecasts
5.3. Reference Growth Case Scenario Forecasts
5.4. High Growth Case Scenario Forecasts
Chapter 6. Market Dynamics
6.1. Condiments Market Drivers
6.2. Condiments Market Challenges
6.6. Condiments Market Opportunities
6.4. Condiments Market Trends
Chapter 7. Global Condiments Market Outlook Trends
7.1. Global Condiments Revenue (USD Million) and CAGR (%) by Type (2021-2032)
7.2. Global Condiments Revenue (USD Million) and CAGR (%) by Application (2021-2032)
7.3. Global Condiments Revenue (USD Million) and CAGR (%) by Product (2021-2032)
By Product
Table Sauces
Cooking Ingredients
Mustard
Others
By Distribution Channel
Offline
Online
Chapter 8. Global Condiments Regional Analysis and Outlook
8.1. Global Condiments Revenue (USD Million) By Regions (2021- 2032)
8.2. North America Condiments Revenue (USD Million) by Country (2021-2032)
8.2.1. United States Condiments Regional Analysis and Outlook
8.2.2. Canada Condiments Regional Analysis and Outlook
8.2.3. Mexico Condiments Regional Analysis and Outlook
8.3. Europe Condiments Revenue (USD Million), by Country (2021-2032)
8.3.1. Germany Condiments Regional Analysis and Outlook
8.3.2. France Condiments Regional Analysis and Outlook
8.3.3. United Kingdom Condiments Regional Analysis and Outlook
8.3.4. Spain Condiments Regional Analysis and Outlook
8.3.5. Italy Condiments Regional Analysis and Outlook
8.3.6. Russia Condiments Regional Analysis and Outlook
8.3.7. Rest of Europe Condiments Regional Analysis and Outlook
8.4. Asia Pacific Condiments Revenue (USD Million) by Country (2021-2032)
8.4.1. China Condiments Regional Analysis and Outlook
8.4.2. Japan Condiments Regional Analysis and Outlook
8.4.3. India Condiments Regional Analysis and Outlook
8.4.4. South Korea Condiments Regional Analysis and Outlook
8.4.5. Australia Condiments Regional Analysis and Outlook
8.4.6. South East Asia Condiments Regional Analysis and Outlook
8.4.7. Rest of Asia Pacific Condiments Regional Analysis and Outlook
8.5. South America Condiments Revenue (USD Million), by Country (2021-2032)
8.5.1. Brazil Condiments Regional Analysis and Outlook
8.5.2. Argentina Condiments Regional Analysis and Outlook
8.5.3. Rest of South America Condiments Regional Analysis and Outlook
8.6. Middle East and Africa Condiments Revenue (USD Million) by Country (2021-2032)
8.6.1. Middle East Condiments Regional Analysis and Outlook
8.6.2. Africa Condiments Regional Analysis and Outlook
Chapter 9. North America Condiments Analysis and Outlook
9.1. North America Condiments Revenue (USD Million) by Segments (2021-2032)
9.1.1. North America Condiments Revenue (USD Million) by Type (2021-2032)
9.1.2. North America Condiments Revenue (USD Million) by Application (2021-2032)
9.1.3. North America Condiments Revenue (USD Million) by Product (2021-2032)
By Product
Table Sauces
Cooking Ingredients
Mustard
Others
By Distribution Channel
Offline
Online
Chapter 10. Europe Condiments Analysis and Outlook
10.1. Europe Condiments Revenue (USD Million), by Segments (USD Million) (2021-2032)
10.1.1. Europe Condiments Revenue (USD Million) by Type (2021-2032)
10.1.2. Europe Condiments Revenue (USD Million) by Application (2021-2032)
10.1.3. Europe Condiments Revenue (USD Million) by Product (2021-2032)
By Product
Table Sauces
Cooking Ingredients
Mustard
Others
By Distribution Channel
Offline
Online
Chapter 11. Asia Pacific Condiments Analysis and Outlook
11.1. Asia Pacific Condiments Revenue (USD Million), and Revenue (USD Million) by Segments (2021-2032)
11.1.1. Asia Pacific Condiments Revenue (USD Million) by Type (2021-2032)
11.1.2. Asia Pacific Condiments Revenue (USD Million) by Application (2021-2032)
11.1.3. Asia Pacific Condiments Revenue (USD Million) by Product (2021-2032)
By Product
Table Sauces
Cooking Ingredients
Mustard
Others
By Distribution Channel
Offline
Online
Chapter 12. South America Condiments Analysis and Outlook
12.1. South America Condiments Revenue (USD Million), by Segments (2021-2032)
12.1.1. South America Condiments Revenue (USD Million) by Type (2021-2032)
12.1.2. South America Condiments Revenue (USD Million) by Application (2021-2032)
12.1.3. South America Condiments Revenue (USD Million) by Product (2021-2032)
By Product
Table Sauces
Cooking Ingredients
Mustard
Others
By Distribution Channel
Offline
Online
Chapter 13. Middle East and Africa Condiments Analysis and Outlook
13.1. Middle East and Africa Condiments Revenue (USD Million), by Segments (2021-2032)
13.1.1. Middle East and Africa Condiments Revenue (USD Million) by Type (2021-2032)
13.1.2. Middle East and Africa Condiments Revenue (USD Million) by Application (2021-2032)
13.1.3. Middle East and Africa Condiments Revenue (USD Million) by Product (2021-2032)
By Product
Table Sauces
Cooking Ingredients
Mustard
Others
By Distribution Channel
Offline
Online
Chapter 14. Condiments Company Profiles
14.1 Business Overview
14.2 Product Profiles
14.3 SWOT Profiles
14.5 Recent Developments
14.6 Financial Profile
List of Companies
Ajinomoto Co. Inc
Conagra Brands Inc
Cremica Food Industries Ltd
Dabur India Ltd
Dr. August Oetker KG
General Mills Inc
Halcyon Proteins Pty. Ltd
Hormel Foods Corp
Kerry Group Plc
Kewpie Corp
McCormick and Co. Inc
Midas Foods International
Nestle SA
NutriAsia Inc
Patanjali Ayurved Ltd
Three Threes Condiments Pty Ltd
15. Methodology and Data Sources
15.1 Customization Offerings
15.2 Subscription Services
15.3 Related Reports
15.4 Publisher Expertise
LIST OF TABLES
Table 1 Market Segmentation Analysis
Table 2 Global Condiments Market Share of Leading Companies, 2023
Table 3 Product Offerings of Leading Companies
Table 4 Low Growth Scenario Forecasts
Table 5 Reference Case Growth Scenario
Table 6 High Growth Case Scenario
Table 7 Global Condiments Revenue (USD Million) And CAGR (%) By Type (2021-2032)
Table 8 Global Condiments Revenue (USD Million) And CAGR (%) By Application (2021-2032)
Table 9 Global Condiments Revenue (USD Million) And CAGR (%) By Product (2021-2032)
Table 10 Global Condiments Market Revenue (USD Million) By Regions (2021-2032)
Table 11 Global Condiments Market Share (%) By Regions (2021-2032)
Table 12 North America Condiments Revenue (USD Million) By Country (2021-2032)
Table 13 Europe Condiments Revenue (USD Million) By Country (2021-2032)
Table 14 Asia Pacific Condiments Revenue (USD Million) By Country (2021-2032)
Table 15 South America Condiments Revenue (USD Million) By Country (2021-2032)
Table 16 Middle East and Africa Condiments Revenue (USD Million) By Region (2021-2032)
Table 17 North America Condiments Revenue (USD Million) By Type (2021-2032)
Table 18 North America Condiments Revenue (USD Million) By Application (2021-2032)
Table 19 North America Condiments Revenue (USD Million) By Product (2021-2032)
Table 20 Europe Condiments Revenue (USD Million) By Type (2021-2032)
Table 21 Europe Condiments Revenue (USD Million) By Application (2021-2032)
Table 22 Europe Condiments Revenue (USD Million) By Product (2021-2032)
Table 23 Asia Pacific Condiments Revenue (USD Million) By Type (2021-2032)
Table 24 Asia Pacific Condiments Revenue (USD Million) By Application (2021-2032)
Table 25 Asia Pacific Condiments Revenue (USD Million) By Product (2021-2032)
Table 26 South America Condiments Revenue (USD Million) By Type (2021-2032)
Table 27 South America Condiments Revenue (USD Million) By Application (2021-2032)
Table 28 South America Condiments Revenue (USD Million) By Product (2021-2032)
Table 29 Middle East and Africa Condiments Revenue (USD Million) By Type (2021-2032)
Table 30 Middle East and Africa Condiments Revenue (USD Million) By Application (2021-2032)
Table 31 Middle East and Africa Condiments Revenue (USD Million) By Product (2021-2032)
LIST OF FIGURES
Figure 1. Market Scope
Figure 2. Pricing Forecasts Per Unit, 2023- 2032
Figure 3. Porter’s Five Forces
Figure 4. Global Condiments Market Revenue (USD Million) By Regions (2021-2032)
Figure 5. Global Condiments Market Share (%) By Regions (2023)
Figure 6. North America Condiments Revenue (USD Million) By Country (2021-2032)
Figure 7. United States Condiments Revenue (USD Million) By Country (2021-2032)
Figure 8. Canada Condiments Revenue (USD Million) By Country (2021-2032)
Figure 9. Mexico Condiments Revenue (USD Million) By Country (2021-2032)
Figure 10. Europe Condiments Revenue (USD Million) By Country (2021-2032)
Figure 11. Germany Condiments Revenue (USD Million) By Country (2021-2032)
Figure 12. France Condiments Revenue (USD Million) By Country (2021-2032)
Figure 13. United Kingdom Condiments Revenue (USD Million) By Country (2021-2032)
Figure 14. Spain Condiments Revenue (USD Million) By Country (2021-2032)
Figure 15. Italy Condiments Revenue (USD Million) By Country (2021-2032)
Figure 16. Russia Condiments Revenue (USD Million) By Country (2021-2032)
Figure 17. Rest of Europe Condiments Revenue (USD Million) By Country (2021-2032)
Figure 11. Asia Pacific Condiments Revenue (USD Million) By Country (2021-2032)
Figure 12. China Condiments Revenue (USD Million) By Country (2021-2032)
Figure 13. Japan Condiments Revenue (USD Million) By Country (2021-2032)
Figure 14. India Condiments Revenue (USD Million) By Country (2021-2032)
Figure 15. South Korea Condiments Revenue (USD Million) By Country (2021-2032)
Figure 16. Australia Condiments Revenue (USD Million) By Country (2021-2032)
Figure 17. South East Asia Condiments Revenue (USD Million) By Country (2021-2032)
Figure 18. South America Condiments Revenue (USD Million) By Country (2021-2032)
Figure 19. Brazil Condiments Revenue (USD Million) By Country (2021-2032)
Figure 20. Argentina Condiments Revenue (USD Million) By Country (2021-2032)
Figure 21. Rest of Asia Pacific Condiments Revenue (USD Million) By Country (2021-2032)
Figure 22. Middle East and Africa Condiments Revenue (USD Million) By Region (2021-2032)
Figure 23. Saudi Arabia Condiments Revenue (USD Million) By Region (2021-2032)
Figure 24. The UAE Condiments Revenue (USD Million) By Region (2021-2032)
Figure 25. Rest of Middle East Condiments Revenue (USD Million) By Region (2021-2032)
Figure 26. South Africa Condiments Revenue (USD Million) By Region (2021-2032)
Figure 27. Africa Condiments Revenue (USD Million) By Region (2021-2032)
Figure 28. North America Condiments Revenue (USD Million) By Type (2021-2032)
Figure 29. North America Condiments Revenue (USD Million) By Application (2021-2032)
Figure 30. North America Condiments Revenue (USD Million) By Product (2021-2032)
Figure 31. Europe Condiments Revenue (USD Million) By Type (2021-2032)
Figure 32. Europe Condiments Revenue (USD Million) By Application (2021-2032)
Figure 33. Europe Condiments Revenue (USD Million) By Product (2021-2032)
Figure 34. Asia Pacific Condiments Revenue (USD Million) By Type (2021-2032)
Figure 35. Asia Pacific Condiments Revenue (USD Million) By Application (2021-2032)
Figure 36. Asia Pacific Condiments Revenue (USD Million) By Product (2021-2032)
Figure 37. South America Condiments Revenue (USD Million) By Type (2021-2032)
Figure 38. South America Condiments Revenue (USD Million) By Application (2021-2032)
Figure 39. South America Condiments Revenue (USD Million) By Product (2021-2032)
Figure 40. Middle East and Africa Condiments Revenue (USD Million) By Type (2021-2032)
Figure 41. Middle East and Africa Condiments Revenue (USD Million) By Application (2021-2032)
Figure 42. Middle East and Africa Condiments Revenue (USD Million) By Product (2021-2032)
By Product
Table Sauces
Cooking Ingredients
Mustard
Others
By Distribution Channel
Offline
Online
Countries Analyzed
North America (US, Canada, Mexico)
Europe (Germany, UK, France, Spain, Italy, Russia, Rest of Europe)
Asia Pacific (China, India, Japan, South Korea, Australia, South East Asia, Rest of Asia)
South America (Brazil, Argentina, Rest of South America)
Middle East and Africa (Saudi Arabia, UAE, Rest of Middle East, South Africa, Egypt, Rest of Africa)
