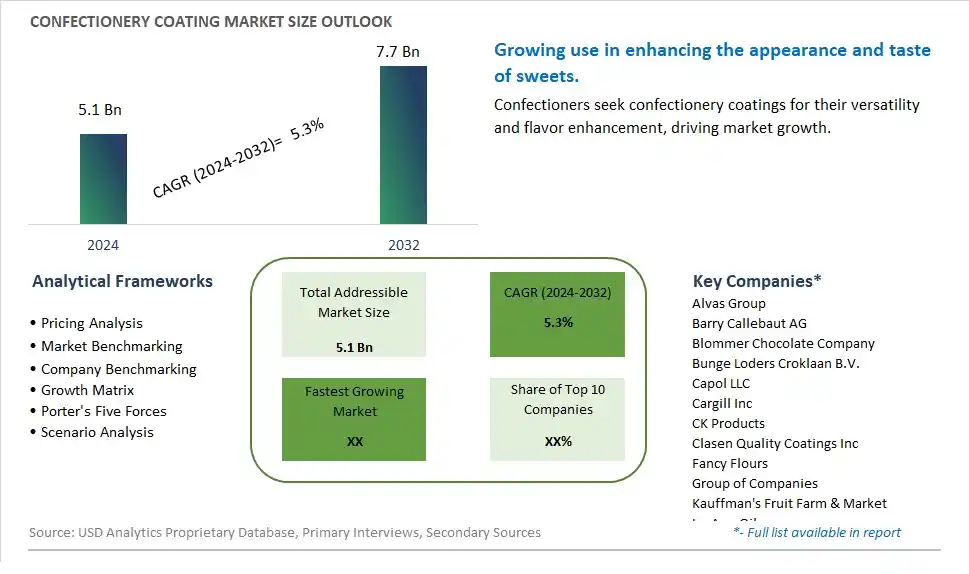
Global Confectionery Coating Market Size is valued at $5.1 Billion in 2024 and is forecast to register a growth rate (CAGR) of 5.3% to reach $7.7 Billion by 2032.
The global Confectionery Coating Market Comprehensive Study analyzes and forecasts the market size across 6 regions and 24 countries for diverse segments -By Type (Organic, Conventional), By Form (Wafers, Blocks, Others), By Flavor (Chocolate, Yoghurt, Caramel, Fudge, Citrus, Berries, Others), By Product (Candies, Biscuits & Cookies, Dried Fruits & Nuts, Soft Candies, Bars, Lollipops, Canes, Toffies, Others)
An Introduction to Confectionery Coating Market
In 2024, the Confectionery Coating market is witnessing robust growth, driven by the increasing demand for high-quality and versatile coating solutions in the confectionery industry. Confectionery coatings, including chocolate coatings, compound coatings, and yogurt coatings, are used to enhance the appearance, texture, and taste of various sweets and snacks. The market is supported by the growing trend towards premium and artisanal confections. Advances in coating formulation and application technologies are enhancing the quality, stability, and functionality of confectionery coatings. The market is also benefiting from the trend towards clean-label and natural ingredients, appealing to manufacturers and consumers seeking high-quality and innovative confectionery products.
Confectionery Coating Competitive Landscape
The market report analyses the leading companies in the industry including Alvas Group, Barry Callebaut AG, Blommer Chocolate Company, Bunge Loders Croklaan B.V., Capol LLC, Cargill Inc, CK Products, Clasen Quality Coatings Inc, Fancy Flours, Group of Companies, Kauffman's Fruit Farm & Market, LorAnn Oils, Mantrose-Haeuser Co. Inc, Norevo GmbH, Rascal Confectionery Ltd, Soyuzsnab, The Warrell Corp, Thew Arnott & Co Ltd, and Others.
Confectionery Coating Market Dynamics
Confectionery Coating Market Trend: Growing Demand for Premium and Specialty Confectionery Coatings
One of the most prominent market trends in the Confectionery Coating segment is the growing demand for premium and specialty coatings. Consumers are increasingly seeking unique and indulgent experiences, driving the demand for high-quality coatings made with premium ingredients such as gourmet chocolate, natural flavors, and exotic spices. This trend is fueled by the desire for luxury and sensory experiences in confectionery products.
Confectionery Coating Market Driver: Innovation in Product Formulations and Customization
An important driver for the Confectionery Coating market is the continuous innovation in product formulations and customization options. Manufacturers are focusing on developing coatings that meet diverse consumer preferences, including sugar-free, vegan, and allergen-free options. The ability to customize coatings according to dietary needs and flavor preferences is driving customer satisfaction and loyalty in the confectionery industry.
Confectionery Coating Market Opportunity: Expansion into Health-Conscious and Functional Coatings
An opportunity within the Confectionery Coating market lies in the expansion into health-conscious and functional coatings. With the rising awareness of health and wellness, there is a growing demand for coatings that offer added benefits such as fortified with vitamins, minerals, and antioxidants. Manufacturers can capitalize on this trend by introducing functional coatings that appeal to health-conscious consumers, providing both indulgence and nutritional value in confectionery products.
Confectionery Coating Market Share Analysis: Conventional segment generated the highest revenue share in the industry
The Conventional segment is the largest in the Confectionery Coating Market by type. This segment's dominance can be attributed to its widespread availability and cost-effectiveness, making it the preferred choice for both manufacturers and consumers. Conventional confectionery coatings often use traditional ingredients and production methods that have been established and optimized over many years, ensuring consistent quality and flavor. These coatings are widely used in various applications, including chocolates, candies, bakery products, and snacks, due to their versatile properties such as ease of melting, molding, and setting. The extensive use of conventional coatings in mass-produced confectionery items contributes significantly to their market share. Additionally, the lower production costs associated with conventional coatings make them more accessible and affordable, catering to a broad consumer base. The well-established supply chains and distribution networks for conventional coatings further enhance their market penetration. While there is a growing interest in organic products, the conventional segment continues to lead due to its cost advantages, widespread usage, and consumer familiarity, ensuring its position as the largest segment in the confectionery coating market.
Confectionery Coating Market Share Analysis: Wafers is the fastest growing segment over the forecast period to 2032
The Wafers segment is projected to be the fastest-growing form in the Confectionery Coating Market by 2032. This rapid growth can be attributed to several compelling factors. Wafers offer significant convenience and versatility for both manufacturers and consumers, making them increasingly popular in various confectionery applications. Their thin and lightweight structure allows for easy handling, melting, and application, which streamlines the production process and reduces waste. Additionally, wafers are ideal for portion control and precise usage, ensuring consistency in the final product. The rise in consumer demand for premium and artisanal chocolates and confections has further driven the adoption of wafer-based coatings, as they enable detailed and intricate designs that appeal to sophisticated palates. Further, the growing trend of at-home baking and DIY confectionery projects has boosted the demand for user-friendly products like wafers, which are easy to melt and use in small batches. The versatility of wafers in creating a smooth, even coating on a variety of confectionery items, from truffles to coated nuts, also contributes to their rising popularity. As a result, the wafers segment is expected to experience robust growth, driven by convenience, versatility, and the evolving consumer preferences towards premium and DIY confectionery solutions.
Confectionery Coating Market Share Analysis: Chocolate segment generated the highest revenue share in the industry
The Chocolate segment is the largest in the Confectionery Coating Market by flavor. This segment's dominance is driven by the universal popularity and versatile application of chocolate across various confectionery products. Chocolate coatings are widely used in an array of items such as candies, biscuits, ice creams, and bakery products, making them an integral part of the confectionery industry. The rich, indulgent flavor of chocolate appeals to a broad demographic, from children to adults, ensuring its continued demand and market leadership. Additionally, the chocolate segment benefits from continuous innovations and variations, including milk, dark, and white chocolate, as well as flavored and infused options, catering to diverse consumer preferences. The growing trend of premium and artisanal chocolates has also bolstered the segment, with consumers willing to pay a premium for high-quality, unique chocolate-coated products. Seasonal and festive demand further boosts sales, as chocolate-coated treats are often popular gifts and celebratory items. The extensive distribution networks and marketing efforts by major chocolate manufacturers ensure widespread availability and consumer reach. Consequently, the chocolate segment remains the largest due to its widespread appeal, versatility, and continuous innovation within the confectionery coating market.
Confectionery Coating Market Share Analysis: Bars is the fastest growing segment over the forecast period to 2032
The Bars segment is projected to be the fastest-growing product in the Confectionery Coating Market by 2032. This rapid growth is driven by several key factors, reflecting evolving consumer preferences and market trends. The increasing demand for convenient, on-the-go snack options has significantly boosted the popularity of confectionery bars, which combine taste, nutrition, and portability. Bars often serve as quick energy sources, making them a favored choice among busy professionals, students, and athletes. Innovations in product formulations, such as the inclusion of high-protein, low-sugar, and fortified ingredients, cater to health-conscious consumers seeking indulgent yet nutritious snacks. Additionally, the rise in premium and artisanal bars, featuring exotic flavors and high-quality ingredients, appeals to gourmet consumers looking for unique and sophisticated treats. The versatility of bars allows for endless variations, including chocolate-coated, yogurt-coated, and fruit-infused options, meeting diverse consumer tastes. Further, effective marketing strategies and attractive packaging enhance the appeal and visibility of bars in retail environments. As a result, the bars segment is expected to experience robust growth, driven by convenience, health trends, and continuous innovation in product offerings.
Confectionery Coating Market Segmentation
By Type
Organic
Conventional
By Form
Wafers
Blocks
Others
By Flavor
Chocolate
Yoghurt
Caramel
Fudge
Citrus
Berries
Others
By Product
Candies
Biscuits & Cookies
Dried Fruits & Nuts
Soft Candies
Bars
Lollipops
Canes
Toffies
Others
Countries Analyzed
North America (US, Canada, Mexico)
Europe (Germany, UK, France, Spain, Italy, Russia, Rest of Europe)
Asia Pacific (China, India, Japan, South Korea, Australia, South East Asia, Rest of Asia)
South America (Brazil, Argentina, Rest of South America)
Middle East and Africa (Saudi Arabia, UAE, Rest of Middle East, South Africa, Egypt, Rest of Africa)
Confectionery Coating Companies Profiled in the Study
Alvas Group
Barry Callebaut AG
Blommer Chocolate Company
Bunge Loders Croklaan B.V.
Capol LLC
Cargill Inc
CK Products
Clasen Quality Coatings Inc
Fancy Flours
Group of Companies
Kauffman's Fruit Farm & Market
LorAnn Oils
Mantrose-Haeuser Co. Inc
Norevo GmbH
Rascal Confectionery Ltd
Soyuzsnab
The Warrell Corp
Thew Arnott & Co Ltd
*- List Not Exhaustive
Chapter 1. TABLE OF CONTENTS
Chapter 2. Introduction to Confectionery Coating Market
2.1. Market Overview
2.2. Key Statistics and Report Highlights
2.3. Scope of the Comprehensive Study
2.3.1. Market Definition
2.3.2 Countries and Regions Covered
2.3.3 Research Objective
2.3.4 Units, Currency, and Conversions
2.3.5 Industry Value Chain
2.4. Key Market Segments
2.5. Key Companies
2.6. Study Period
Chapter 3. Strategic Analysis Review
3.1. Confectionery Coating Pricing Analysis and Forecast
3.2. Porter’s Five Forces
3.3. Market Ecosystem
3.4. SWOT Analysis
3.5. Regulatory Scenario
3.3. Effects of Inflation, Russia-Ukraine War, moderating economic growth, and other macroeconomic factors
Chapter 4. Competitive Landscape
4.1. Market Share Analysis
4.1.1. Global Confectionery Coating Market Share by Company, 2023
4.1.2. Product Offerings of Leading Confectionery Coating Companies
4.2. Market Entropy
4.2.1. New Product Launches in the Industry
4.2.2. Mergers, Acquisitions, Joint ventures, and Partnerships
4.3. Key Strategies and Best Practices
Chapter 5. Global Market Projections: Best, Reference, and Low Case Scenarios
5.1. Growth Analysis- Case Scenario Definitions
5.2. Low Growth Case Scenario Forecasts
5.3. Reference Growth Case Scenario Forecasts
5.4. High Growth Case Scenario Forecasts
Chapter 6. Market Dynamics
6.1. Confectionery Coating Market Drivers
6.2. Confectionery Coating Market Challenges
6.6. Confectionery Coating Market Opportunities
6.4. Confectionery Coating Market Trends
Chapter 7. Global Confectionery Coating Market Outlook Trends
7.1. Global Confectionery Coating Revenue (USD Million) and CAGR (%) by Type (2021-2032)
7.2. Global Confectionery Coating Revenue (USD Million) and CAGR (%) by Application (2021-2032)
7.3. Global Confectionery Coating Revenue (USD Million) and CAGR (%) by Product (2021-2032)
By Type
Organic
Conventional
By Form
Wafers
Blocks
Others
By Flavor
Chocolate
Yoghurt
Caramel
Fudge
Citrus
Berries
Others
By Product
Candies
Biscuits & Cookies
Dried Fruits & Nuts
Soft Candies
Bars
Lollipops
Canes
Toffies
Others
Chapter 8. Global Confectionery Coating Regional Analysis and Outlook
8.1. Global Confectionery Coating Revenue (USD Million) By Regions (2021- 2032)
8.2. North America Confectionery Coating Revenue (USD Million) by Country (2021-2032)
8.2.1. United States Confectionery Coating Regional Analysis and Outlook
8.2.2. Canada Confectionery Coating Regional Analysis and Outlook
8.2.3. Mexico Confectionery Coating Regional Analysis and Outlook
8.3. Europe Confectionery Coating Revenue (USD Million), by Country (2021-2032)
8.3.1. Germany Confectionery Coating Regional Analysis and Outlook
8.3.2. France Confectionery Coating Regional Analysis and Outlook
8.3.3. United Kingdom Confectionery Coating Regional Analysis and Outlook
8.3.4. Spain Confectionery Coating Regional Analysis and Outlook
8.3.5. Italy Confectionery Coating Regional Analysis and Outlook
8.3.6. Russia Confectionery Coating Regional Analysis and Outlook
8.3.7. Rest of Europe Confectionery Coating Regional Analysis and Outlook
8.4. Asia Pacific Confectionery Coating Revenue (USD Million) by Country (2021-2032)
8.4.1. China Confectionery Coating Regional Analysis and Outlook
8.4.2. Japan Confectionery Coating Regional Analysis and Outlook
8.4.3. India Confectionery Coating Regional Analysis and Outlook
8.4.4. South Korea Confectionery Coating Regional Analysis and Outlook
8.4.5. Australia Confectionery Coating Regional Analysis and Outlook
8.4.6. South East Asia Confectionery Coating Regional Analysis and Outlook
8.4.7. Rest of Asia Pacific Confectionery Coating Regional Analysis and Outlook
8.5. South America Confectionery Coating Revenue (USD Million), by Country (2021-2032)
8.5.1. Brazil Confectionery Coating Regional Analysis and Outlook
8.5.2. Argentina Confectionery Coating Regional Analysis and Outlook
8.5.3. Rest of South America Confectionery Coating Regional Analysis and Outlook
8.6. Middle East and Africa Confectionery Coating Revenue (USD Million) by Country (2021-2032)
8.6.1. Middle East Confectionery Coating Regional Analysis and Outlook
8.6.2. Africa Confectionery Coating Regional Analysis and Outlook
Chapter 9. North America Confectionery Coating Analysis and Outlook
9.1. North America Confectionery Coating Revenue (USD Million) by Segments (2021-2032)
9.1.1. North America Confectionery Coating Revenue (USD Million) by Type (2021-2032)
9.1.2. North America Confectionery Coating Revenue (USD Million) by Application (2021-2032)
9.1.3. North America Confectionery Coating Revenue (USD Million) by Product (2021-2032)
By Type
Organic
Conventional
By Form
Wafers
Blocks
Others
By Flavor
Chocolate
Yoghurt
Caramel
Fudge
Citrus
Berries
Others
By Product
Candies
Biscuits & Cookies
Dried Fruits & Nuts
Soft Candies
Bars
Lollipops
Canes
Toffies
Others
Chapter 10. Europe Confectionery Coating Analysis and Outlook
10.1. Europe Confectionery Coating Revenue (USD Million), by Segments (USD Million) (2021-2032)
10.1.1. Europe Confectionery Coating Revenue (USD Million) by Type (2021-2032)
10.1.2. Europe Confectionery Coating Revenue (USD Million) by Application (2021-2032)
10.1.3. Europe Confectionery Coating Revenue (USD Million) by Product (2021-2032)
By Type
Organic
Conventional
By Form
Wafers
Blocks
Others
By Flavor
Chocolate
Yoghurt
Caramel
Fudge
Citrus
Berries
Others
By Product
Candies
Biscuits & Cookies
Dried Fruits & Nuts
Soft Candies
Bars
Lollipops
Canes
Toffies
Others
Chapter 11. Asia Pacific Confectionery Coating Analysis and Outlook
11.1. Asia Pacific Confectionery Coating Revenue (USD Million), and Revenue (USD Million) by Segments (2021-2032)
11.1.1. Asia Pacific Confectionery Coating Revenue (USD Million) by Type (2021-2032)
11.1.2. Asia Pacific Confectionery Coating Revenue (USD Million) by Application (2021-2032)
11.1.3. Asia Pacific Confectionery Coating Revenue (USD Million) by Product (2021-2032)
By Type
Organic
Conventional
By Form
Wafers
Blocks
Others
By Flavor
Chocolate
Yoghurt
Caramel
Fudge
Citrus
Berries
Others
By Product
Candies
Biscuits & Cookies
Dried Fruits & Nuts
Soft Candies
Bars
Lollipops
Canes
Toffies
Others
Chapter 12. South America Confectionery Coating Analysis and Outlook
12.1. South America Confectionery Coating Revenue (USD Million), by Segments (2021-2032)
12.1.1. South America Confectionery Coating Revenue (USD Million) by Type (2021-2032)
12.1.2. South America Confectionery Coating Revenue (USD Million) by Application (2021-2032)
12.1.3. South America Confectionery Coating Revenue (USD Million) by Product (2021-2032)
By Type
Organic
Conventional
By Form
Wafers
Blocks
Others
By Flavor
Chocolate
Yoghurt
Caramel
Fudge
Citrus
Berries
Others
By Product
Candies
Biscuits & Cookies
Dried Fruits & Nuts
Soft Candies
Bars
Lollipops
Canes
Toffies
Others
Chapter 13. Middle East and Africa Confectionery Coating Analysis and Outlook
13.1. Middle East and Africa Confectionery Coating Revenue (USD Million), by Segments (2021-2032)
13.1.1. Middle East and Africa Confectionery Coating Revenue (USD Million) by Type (2021-2032)
13.1.2. Middle East and Africa Confectionery Coating Revenue (USD Million) by Application (2021-2032)
13.1.3. Middle East and Africa Confectionery Coating Revenue (USD Million) by Product (2021-2032)
By Type
Organic
Conventional
By Form
Wafers
Blocks
Others
By Flavor
Chocolate
Yoghurt
Caramel
Fudge
Citrus
Berries
Others
By Product
Candies
Biscuits & Cookies
Dried Fruits & Nuts
Soft Candies
Bars
Lollipops
Canes
Toffies
Others
Chapter 14. Confectionery Coating Company Profiles
14.1 Business Overview
14.2 Product Profiles
14.3 SWOT Profiles
14.5 Recent Developments
14.6 Financial Profile
List of Companies
Alvas Group
Barry Callebaut AG
Blommer Chocolate Company
Bunge Loders Croklaan B.V.
Capol LLC
Cargill Inc
CK Products
Clasen Quality Coatings Inc
Fancy Flours
Group of Companies
Kauffman's Fruit Farm & Market
LorAnn Oils
Mantrose-Haeuser Co. Inc
Norevo GmbH
Rascal Confectionery Ltd
Soyuzsnab
The Warrell Corp
Thew Arnott & Co Ltd
15. Methodology and Data Sources
15.1 Customization Offerings
15.2 Subscription Services
15.3 Related Reports
15.4 Publisher Expertise
LIST OF TABLES
Table 1 Market Segmentation Analysis
Table 2 Global Confectionery Coating Market Share of Leading Companies, 2023
Table 3 Product Offerings of Leading Companies
Table 4 Low Growth Scenario Forecasts
Table 5 Reference Case Growth Scenario
Table 6 High Growth Case Scenario
Table 7 Global Confectionery Coating Revenue (USD Million) And CAGR (%) By Type (2021-2032)
Table 8 Global Confectionery Coating Revenue (USD Million) And CAGR (%) By Application (2021-2032)
Table 9 Global Confectionery Coating Revenue (USD Million) And CAGR (%) By Product (2021-2032)
Table 10 Global Confectionery Coating Market Revenue (USD Million) By Regions (2021-2032)
Table 11 Global Confectionery Coating Market Share (%) By Regions (2021-2032)
Table 12 North America Confectionery Coating Revenue (USD Million) By Country (2021-2032)
Table 13 Europe Confectionery Coating Revenue (USD Million) By Country (2021-2032)
Table 14 Asia Pacific Confectionery Coating Revenue (USD Million) By Country (2021-2032)
Table 15 South America Confectionery Coating Revenue (USD Million) By Country (2021-2032)
Table 16 Middle East and Africa Confectionery Coating Revenue (USD Million) By Region (2021-2032)
Table 17 North America Confectionery Coating Revenue (USD Million) By Type (2021-2032)
Table 18 North America Confectionery Coating Revenue (USD Million) By Application (2021-2032)
Table 19 North America Confectionery Coating Revenue (USD Million) By Product (2021-2032)
Table 20 Europe Confectionery Coating Revenue (USD Million) By Type (2021-2032)
Table 21 Europe Confectionery Coating Revenue (USD Million) By Application (2021-2032)
Table 22 Europe Confectionery Coating Revenue (USD Million) By Product (2021-2032)
Table 23 Asia Pacific Confectionery Coating Revenue (USD Million) By Type (2021-2032)
Table 24 Asia Pacific Confectionery Coating Revenue (USD Million) By Application (2021-2032)
Table 25 Asia Pacific Confectionery Coating Revenue (USD Million) By Product (2021-2032)
Table 26 South America Confectionery Coating Revenue (USD Million) By Type (2021-2032)
Table 27 South America Confectionery Coating Revenue (USD Million) By Application (2021-2032)
Table 28 South America Confectionery Coating Revenue (USD Million) By Product (2021-2032)
Table 29 Middle East and Africa Confectionery Coating Revenue (USD Million) By Type (2021-2032)
Table 30 Middle East and Africa Confectionery Coating Revenue (USD Million) By Application (2021-2032)
Table 31 Middle East and Africa Confectionery Coating Revenue (USD Million) By Product (2021-2032)
LIST OF FIGURES
Figure 1. Market Scope
Figure 2. Pricing Forecasts Per Unit, 2023- 2032
Figure 3. Porter’s Five Forces
Figure 4. Global Confectionery Coating Market Revenue (USD Million) By Regions (2021-2032)
Figure 5. Global Confectionery Coating Market Share (%) By Regions (2023)
Figure 6. North America Confectionery Coating Revenue (USD Million) By Country (2021-2032)
Figure 7. United States Confectionery Coating Revenue (USD Million) By Country (2021-2032)
Figure 8. Canada Confectionery Coating Revenue (USD Million) By Country (2021-2032)
Figure 9. Mexico Confectionery Coating Revenue (USD Million) By Country (2021-2032)
Figure 10. Europe Confectionery Coating Revenue (USD Million) By Country (2021-2032)
Figure 11. Germany Confectionery Coating Revenue (USD Million) By Country (2021-2032)
Figure 12. France Confectionery Coating Revenue (USD Million) By Country (2021-2032)
Figure 13. United Kingdom Confectionery Coating Revenue (USD Million) By Country (2021-2032)
Figure 14. Spain Confectionery Coating Revenue (USD Million) By Country (2021-2032)
Figure 15. Italy Confectionery Coating Revenue (USD Million) By Country (2021-2032)
Figure 16. Russia Confectionery Coating Revenue (USD Million) By Country (2021-2032)
Figure 17. Rest of Europe Confectionery Coating Revenue (USD Million) By Country (2021-2032)
Figure 11. Asia Pacific Confectionery Coating Revenue (USD Million) By Country (2021-2032)
Figure 12. China Confectionery Coating Revenue (USD Million) By Country (2021-2032)
Figure 13. Japan Confectionery Coating Revenue (USD Million) By Country (2021-2032)
Figure 14. India Confectionery Coating Revenue (USD Million) By Country (2021-2032)
Figure 15. South Korea Confectionery Coating Revenue (USD Million) By Country (2021-2032)
Figure 16. Australia Confectionery Coating Revenue (USD Million) By Country (2021-2032)
Figure 17. South East Asia Confectionery Coating Revenue (USD Million) By Country (2021-2032)
Figure 18. South America Confectionery Coating Revenue (USD Million) By Country (2021-2032)
Figure 19. Brazil Confectionery Coating Revenue (USD Million) By Country (2021-2032)
Figure 20. Argentina Confectionery Coating Revenue (USD Million) By Country (2021-2032)
Figure 21. Rest of Asia Pacific Confectionery Coating Revenue (USD Million) By Country (2021-2032)
Figure 22. Middle East and Africa Confectionery Coating Revenue (USD Million) By Region (2021-2032)
Figure 23. Saudi Arabia Confectionery Coating Revenue (USD Million) By Region (2021-2032)
Figure 24. The UAE Confectionery Coating Revenue (USD Million) By Region (2021-2032)
Figure 25. Rest of Middle East Confectionery Coating Revenue (USD Million) By Region (2021-2032)
Figure 26. South Africa Confectionery Coating Revenue (USD Million) By Region (2021-2032)
Figure 27. Africa Confectionery Coating Revenue (USD Million) By Region (2021-2032)
Figure 28. North America Confectionery Coating Revenue (USD Million) By Type (2021-2032)
Figure 29. North America Confectionery Coating Revenue (USD Million) By Application (2021-2032)
Figure 30. North America Confectionery Coating Revenue (USD Million) By Product (2021-2032)
Figure 31. Europe Confectionery Coating Revenue (USD Million) By Type (2021-2032)
Figure 32. Europe Confectionery Coating Revenue (USD Million) By Application (2021-2032)
Figure 33. Europe Confectionery Coating Revenue (USD Million) By Product (2021-2032)
Figure 34. Asia Pacific Confectionery Coating Revenue (USD Million) By Type (2021-2032)
Figure 35. Asia Pacific Confectionery Coating Revenue (USD Million) By Application (2021-2032)
Figure 36. Asia Pacific Confectionery Coating Revenue (USD Million) By Product (2021-2032)
Figure 37. South America Confectionery Coating Revenue (USD Million) By Type (2021-2032)
Figure 38. South America Confectionery Coating Revenue (USD Million) By Application (2021-2032)
Figure 39. South America Confectionery Coating Revenue (USD Million) By Product (2021-2032)
Figure 40. Middle East and Africa Confectionery Coating Revenue (USD Million) By Type (2021-2032)
Figure 41. Middle East and Africa Confectionery Coating Revenue (USD Million) By Application (2021-2032)
Figure 42. Middle East and Africa Confectionery Coating Revenue (USD Million) By Product (2021-2032)
By Type
Organic
Conventional
By Form
Wafers
Blocks
Others
By Flavor
Chocolate
Yoghurt
Caramel
Fudge
Citrus
Berries
Others
By Product
Candies
Biscuits & Cookies
Dried Fruits & Nuts
Soft Candies
Bars
Lollipops
Canes
Toffies
Others
Countries Analyzed
North America (US, Canada, Mexico)
Europe (Germany, UK, France, Spain, Italy, Russia, Rest of Europe)
Asia Pacific (China, India, Japan, South Korea, Australia, South East Asia, Rest of Asia)
South America (Brazil, Argentina, Rest of South America)
Middle East and Africa (Saudi Arabia, UAE, Rest of Middle East, South Africa, Egypt, Rest of Africa)
