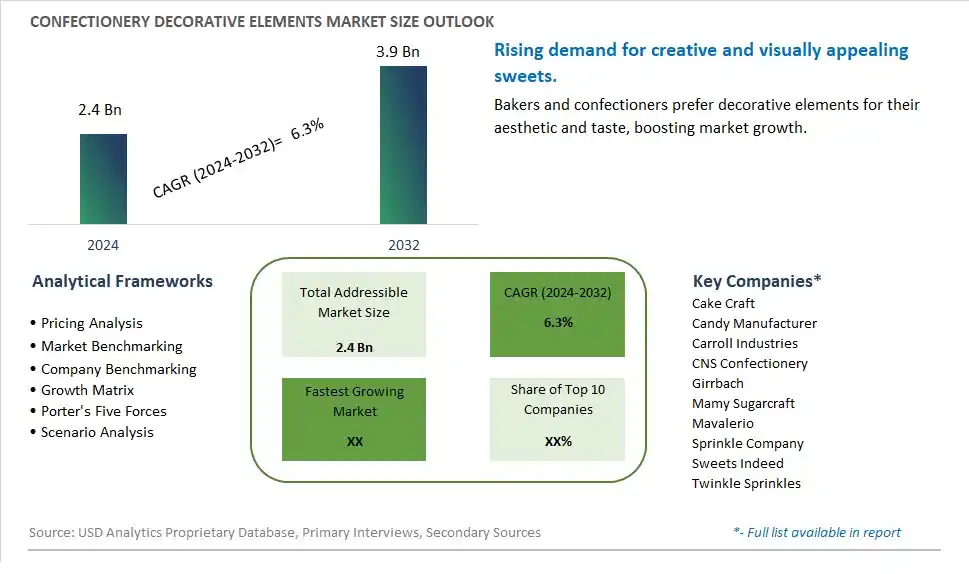
Global Confectionery Decorative Elements Market Size is valued at $2.4 Billion in 2024 and is forecast to register a growth rate (CAGR) of 6.3% to reach $3.9 Billion by 2032.
The global Confectionery Decorative Elements Market Comprehensive Study analyzes and forecasts the market size across 6 regions and 24 countries for diverse segments -By Type (Sprinkles, Mini Marshmallows, Others), By Application (Cakes, Ice Creams, Others)
An Introduction to Confectionery Decorative Elements Market
The Confectionery Decorative Elements market in 2024 is expanding rapidly, driven by the increasing demand for visually appealing and intricate decorations in the confectionery industry. Decorative elements, including sprinkles, edible glitter, sugar decorations, and decorative shapes, are used to enhance the appearance and appeal of cakes, cookies, chocolates, and other sweets. The market is supported by the growing trend towards personalized and aesthetically pleasing confections. Advances in decorative element production and formulation technologies are enhancing the quality, safety, and versatility of these products. The market is also benefiting from the trend towards clean-label and natural decorations, appealing to bakers and consumers seeking high-quality and visually stunning confectionery items.
Confectionery Decorative Elements Competitive Landscape
The market report analyses the leading companies in the industry including Cake Craft, Candy Manufacturer, Carroll Industries, CNS Confectionery, Girrbach, Mamy Sugarcraft, Mavalerio, Sprinkle Company, Sweets Indeed, Twinkle Sprinkles, and Others.
Confectionery Decorative Elements Market Dynamics
Confectionery Decorative Elements Market Trend: Growing Demand for Artisanal and Customized Decorative Elements
One of the most prominent market trends in the Confectionery Decorative Elements segment is the growing demand for artisanal and customized decorative elements. Consumers are seeking unique and visually appealing confectionery products, driving the demand for decorative elements such as edible flowers, hand-painted designs, and personalized messages. This trend is fueled by the desire for creativity and customization in confectionery presentation.
Confectionery Decorative Elements Market Driver: Rising Importance of Visual Appeal and Instagrammable Products
An important driver for the Confectionery Decorative Elements market is the rising importance of visual appeal and Instagrammable products. With the influence of social media, consumers are increasingly looking for confectionery products that are visually striking and share-worthy. Decorative elements play a crucial role in enhancing the aesthetics of confectionery items, attracting attention on social platforms and driving consumer engagement.
Confectionery Decorative Elements Market Opportunity: Expansion into Sustainable and Eco-Friendly Decorative Elements
An opportunity within the Confectionery Decorative Elements market lies in the expansion into sustainable and eco-friendly decorative elements. As environmental concerns continue to rise, there is a growing demand for decorations made from sustainable materials such as edible flowers, natural food colors, and biodegradable packaging. Manufacturers can capitalize on this trend by offering eco-friendly decorative options, catering to environmentally conscious consumers and enhancing brand reputation for sustainability.
Confectionery Decorative Elements Market Share Analysis: Sprinkles segment generated the highest revenue share in the industry
The Sprinkles segment is the largest in the Confectionery Decorative Elements Market by type. This segment's dominance is attributed to the widespread popularity and versatility of sprinkles in enhancing the visual appeal and texture of a variety of confectionery products. Sprinkles are used extensively in decorating cakes, cupcakes, cookies, donuts, ice creams, and other desserts, making them a staple in both household baking and commercial food production. Their vibrant colors, diverse shapes, and ability to add a festive touch to any treat contribute to their broad appeal across age groups and occasions. The ease of application and the ability to instantly transform the appearance of a confectionery item make sprinkles a preferred choice among home bakers, professional pastry chefs, and large-scale food manufacturers alike. Additionally, the trend towards customized and themed desserts for celebrations and special events has further fueled the demand for sprinkles. The continuous innovation in sprinkle designs, including holiday-themed, glitter, and edible pearl variants, keeps the segment dynamic and engaging for consumers. As a result, the sprinkles segment maintains its leading position due to its versatility, ease of use, and the ongoing consumer demand for aesthetically pleasing and festive confectionery decorations.
Confectionery Decorative Elements Market Share Analysis: Cakes is the fastest growing segment over the forecast period to 2032
The Cakes segment is projected to be the fastest-growing application in the Confectionery Decorative Elements Market by 2032. This growth is driven by several compelling factors that reflect changing consumer trends and preferences. The increasing popularity of home baking, fueled by social media platforms and baking shows, has led to a surge in demand for decorative elements to create visually stunning cakes. Consumers are more inclined to experiment with elaborate cake designs and decorations for birthdays, weddings, holidays, and other celebrations, driving the need for diverse and innovative decorative elements. Additionally, the rise of customized and themed cakes, tailored to individual preferences and event themes, further boosts the demand for decorative elements such as sprinkles, edible glitter, fondant shapes, and edible pearls. The professional baking industry also contributes to this growth, with bakeries and pastry shops continually seeking new and creative ways to enhance their cake offerings and attract customers. The trend towards premium and artisanal cakes, which emphasize both taste and visual appeal, underscores the importance of high-quality decorative elements. As a result, the cakes segment is expected to experience robust growth, driven by the desire for personalized, aesthetically pleasing, and celebration-worthy confections.
Confectionery Decorative Elements Market Segmentation
By Type
Sprinkles
Mini Marshmallows
Others
By Application
Cakes
Ice Creams
Others
Countries Analyzed
North America (US, Canada, Mexico)
Europe (Germany, UK, France, Spain, Italy, Russia, Rest of Europe)
Asia Pacific (China, India, Japan, South Korea, Australia, South East Asia, Rest of Asia)
South America (Brazil, Argentina, Rest of South America)
Middle East and Africa (Saudi Arabia, UAE, Rest of Middle East, South Africa, Egypt, Rest of Africa)
Confectionery Decorative Elements Companies Profiled in the Study
Cake Craft
Candy Manufacturer
Carroll Industries
CNS Confectionery
Girrbach
Mamy Sugarcraft
Mavalerio
Sprinkle Company
Sweets Indeed
Twinkle Sprinkles
*- List Not Exhaustive
Chapter 1. TABLE OF CONTENTS
Chapter 2. Introduction to Confectionery Decorative Elements Market
2.1. Market Overview
2.2. Key Statistics and Report Highlights
2.3. Scope of the Comprehensive Study
2.3.1. Market Definition
2.3.2 Countries and Regions Covered
2.3.3 Research Objective
2.3.4 Units, Currency, and Conversions
2.3.5 Industry Value Chain
2.4. Key Market Segments
2.5. Key Companies
2.6. Study Period
Chapter 3. Strategic Analysis Review
3.1. Confectionery Decorative Elements Pricing Analysis and Forecast
3.2. Porter’s Five Forces
3.3. Market Ecosystem
3.4. SWOT Analysis
3.5. Regulatory Scenario
3.3. Effects of Inflation, Russia-Ukraine War, moderating economic growth, and other macroeconomic factors
Chapter 4. Competitive Landscape
4.1. Market Share Analysis
4.1.1. Global Confectionery Decorative Elements Market Share by Company, 2023
4.1.2. Product Offerings of Leading Confectionery Decorative Elements Companies
4.2. Market Entropy
4.2.1. New Product Launches in the Industry
4.2.2. Mergers, Acquisitions, Joint ventures, and Partnerships
4.3. Key Strategies and Best Practices
Chapter 5. Global Market Projections: Best, Reference, and Low Case Scenarios
5.1. Growth Analysis- Case Scenario Definitions
5.2. Low Growth Case Scenario Forecasts
5.3. Reference Growth Case Scenario Forecasts
5.4. High Growth Case Scenario Forecasts
Chapter 6. Market Dynamics
6.1. Confectionery Decorative Elements Market Drivers
6.2. Confectionery Decorative Elements Market Challenges
6.6. Confectionery Decorative Elements Market Opportunities
6.4. Confectionery Decorative Elements Market Trends
Chapter 7. Global Confectionery Decorative Elements Market Outlook Trends
7.1. Global Confectionery Decorative Elements Revenue (USD Million) and CAGR (%) by Type (2021-2032)
7.2. Global Confectionery Decorative Elements Revenue (USD Million) and CAGR (%) by Application (2021-2032)
7.3. Global Confectionery Decorative Elements Revenue (USD Million) and CAGR (%) by Product (2021-2032)
By Type
Sprinkles
Mini Marshmallows
Others
By Application
Cakes
Ice Creams
Others
Chapter 8. Global Confectionery Decorative Elements Regional Analysis and Outlook
8.1. Global Confectionery Decorative Elements Revenue (USD Million) By Regions (2021- 2032)
8.2. North America Confectionery Decorative Elements Revenue (USD Million) by Country (2021-2032)
8.2.1. United States Confectionery Decorative Elements Regional Analysis and Outlook
8.2.2. Canada Confectionery Decorative Elements Regional Analysis and Outlook
8.2.3. Mexico Confectionery Decorative Elements Regional Analysis and Outlook
8.3. Europe Confectionery Decorative Elements Revenue (USD Million), by Country (2021-2032)
8.3.1. Germany Confectionery Decorative Elements Regional Analysis and Outlook
8.3.2. France Confectionery Decorative Elements Regional Analysis and Outlook
8.3.3. United Kingdom Confectionery Decorative Elements Regional Analysis and Outlook
8.3.4. Spain Confectionery Decorative Elements Regional Analysis and Outlook
8.3.5. Italy Confectionery Decorative Elements Regional Analysis and Outlook
8.3.6. Russia Confectionery Decorative Elements Regional Analysis and Outlook
8.3.7. Rest of Europe Confectionery Decorative Elements Regional Analysis and Outlook
8.4. Asia Pacific Confectionery Decorative Elements Revenue (USD Million) by Country (2021-2032)
8.4.1. China Confectionery Decorative Elements Regional Analysis and Outlook
8.4.2. Japan Confectionery Decorative Elements Regional Analysis and Outlook
8.4.3. India Confectionery Decorative Elements Regional Analysis and Outlook
8.4.4. South Korea Confectionery Decorative Elements Regional Analysis and Outlook
8.4.5. Australia Confectionery Decorative Elements Regional Analysis and Outlook
8.4.6. South East Asia Confectionery Decorative Elements Regional Analysis and Outlook
8.4.7. Rest of Asia Pacific Confectionery Decorative Elements Regional Analysis and Outlook
8.5. South America Confectionery Decorative Elements Revenue (USD Million), by Country (2021-2032)
8.5.1. Brazil Confectionery Decorative Elements Regional Analysis and Outlook
8.5.2. Argentina Confectionery Decorative Elements Regional Analysis and Outlook
8.5.3. Rest of South America Confectionery Decorative Elements Regional Analysis and Outlook
8.6. Middle East and Africa Confectionery Decorative Elements Revenue (USD Million) by Country (2021-2032)
8.6.1. Middle East Confectionery Decorative Elements Regional Analysis and Outlook
8.6.2. Africa Confectionery Decorative Elements Regional Analysis and Outlook
Chapter 9. North America Confectionery Decorative Elements Analysis and Outlook
9.1. North America Confectionery Decorative Elements Revenue (USD Million) by Segments (2021-2032)
9.1.1. North America Confectionery Decorative Elements Revenue (USD Million) by Type (2021-2032)
9.1.2. North America Confectionery Decorative Elements Revenue (USD Million) by Application (2021-2032)
9.1.3. North America Confectionery Decorative Elements Revenue (USD Million) by Product (2021-2032)
By Type
Sprinkles
Mini Marshmallows
Others
By Application
Cakes
Ice Creams
Others
Chapter 10. Europe Confectionery Decorative Elements Analysis and Outlook
10.1. Europe Confectionery Decorative Elements Revenue (USD Million), by Segments (USD Million) (2021-2032)
10.1.1. Europe Confectionery Decorative Elements Revenue (USD Million) by Type (2021-2032)
10.1.2. Europe Confectionery Decorative Elements Revenue (USD Million) by Application (2021-2032)
10.1.3. Europe Confectionery Decorative Elements Revenue (USD Million) by Product (2021-2032)
By Type
Sprinkles
Mini Marshmallows
Others
By Application
Cakes
Ice Creams
Others
Chapter 11. Asia Pacific Confectionery Decorative Elements Analysis and Outlook
11.1. Asia Pacific Confectionery Decorative Elements Revenue (USD Million), and Revenue (USD Million) by Segments (2021-2032)
11.1.1. Asia Pacific Confectionery Decorative Elements Revenue (USD Million) by Type (2021-2032)
11.1.2. Asia Pacific Confectionery Decorative Elements Revenue (USD Million) by Application (2021-2032)
11.1.3. Asia Pacific Confectionery Decorative Elements Revenue (USD Million) by Product (2021-2032)
By Type
Sprinkles
Mini Marshmallows
Others
By Application
Cakes
Ice Creams
Others
Chapter 12. South America Confectionery Decorative Elements Analysis and Outlook
12.1. South America Confectionery Decorative Elements Revenue (USD Million), by Segments (2021-2032)
12.1.1. South America Confectionery Decorative Elements Revenue (USD Million) by Type (2021-2032)
12.1.2. South America Confectionery Decorative Elements Revenue (USD Million) by Application (2021-2032)
12.1.3. South America Confectionery Decorative Elements Revenue (USD Million) by Product (2021-2032)
By Type
Sprinkles
Mini Marshmallows
Others
By Application
Cakes
Ice Creams
Others
Chapter 13. Middle East and Africa Confectionery Decorative Elements Analysis and Outlook
13.1. Middle East and Africa Confectionery Decorative Elements Revenue (USD Million), by Segments (2021-2032)
13.1.1. Middle East and Africa Confectionery Decorative Elements Revenue (USD Million) by Type (2021-2032)
13.1.2. Middle East and Africa Confectionery Decorative Elements Revenue (USD Million) by Application (2021-2032)
13.1.3. Middle East and Africa Confectionery Decorative Elements Revenue (USD Million) by Product (2021-2032)
By Type
Sprinkles
Mini Marshmallows
Others
By Application
Cakes
Ice Creams
Others
Chapter 14. Confectionery Decorative Elements Company Profiles
14.1 Business Overview
14.2 Product Profiles
14.3 SWOT Profiles
14.5 Recent Developments
14.6 Financial Profile
List of Companies
Cake Craft
Candy Manufacturer
Carroll Industries
CNS Confectionery
Girrbach
Mamy Sugarcraft
Mavalerio
Sprinkle Company
Sweets Indeed
Twinkle Sprinkles
15. Methodology and Data Sources
15.1 Customization Offerings
15.2 Subscription Services
15.3 Related Reports
15.4 Publisher Expertise
LIST OF TABLES
Table 1 Market Segmentation Analysis
Table 2 Global Confectionery Decorative Elements Market Share of Leading Companies, 2023
Table 3 Product Offerings of Leading Companies
Table 4 Low Growth Scenario Forecasts
Table 5 Reference Case Growth Scenario
Table 6 High Growth Case Scenario
Table 7 Global Confectionery Decorative Elements Revenue (USD Million) And CAGR (%) By Type (2021-2032)
Table 8 Global Confectionery Decorative Elements Revenue (USD Million) And CAGR (%) By Application (2021-2032)
Table 9 Global Confectionery Decorative Elements Revenue (USD Million) And CAGR (%) By Product (2021-2032)
Table 10 Global Confectionery Decorative Elements Market Revenue (USD Million) By Regions (2021-2032)
Table 11 Global Confectionery Decorative Elements Market Share (%) By Regions (2021-2032)
Table 12 North America Confectionery Decorative Elements Revenue (USD Million) By Country (2021-2032)
Table 13 Europe Confectionery Decorative Elements Revenue (USD Million) By Country (2021-2032)
Table 14 Asia Pacific Confectionery Decorative Elements Revenue (USD Million) By Country (2021-2032)
Table 15 South America Confectionery Decorative Elements Revenue (USD Million) By Country (2021-2032)
Table 16 Middle East and Africa Confectionery Decorative Elements Revenue (USD Million) By Region (2021-2032)
Table 17 North America Confectionery Decorative Elements Revenue (USD Million) By Type (2021-2032)
Table 18 North America Confectionery Decorative Elements Revenue (USD Million) By Application (2021-2032)
Table 19 North America Confectionery Decorative Elements Revenue (USD Million) By Product (2021-2032)
Table 20 Europe Confectionery Decorative Elements Revenue (USD Million) By Type (2021-2032)
Table 21 Europe Confectionery Decorative Elements Revenue (USD Million) By Application (2021-2032)
Table 22 Europe Confectionery Decorative Elements Revenue (USD Million) By Product (2021-2032)
Table 23 Asia Pacific Confectionery Decorative Elements Revenue (USD Million) By Type (2021-2032)
Table 24 Asia Pacific Confectionery Decorative Elements Revenue (USD Million) By Application (2021-2032)
Table 25 Asia Pacific Confectionery Decorative Elements Revenue (USD Million) By Product (2021-2032)
Table 26 South America Confectionery Decorative Elements Revenue (USD Million) By Type (2021-2032)
Table 27 South America Confectionery Decorative Elements Revenue (USD Million) By Application (2021-2032)
Table 28 South America Confectionery Decorative Elements Revenue (USD Million) By Product (2021-2032)
Table 29 Middle East and Africa Confectionery Decorative Elements Revenue (USD Million) By Type (2021-2032)
Table 30 Middle East and Africa Confectionery Decorative Elements Revenue (USD Million) By Application (2021-2032)
Table 31 Middle East and Africa Confectionery Decorative Elements Revenue (USD Million) By Product (2021-2032)
LIST OF FIGURES
Figure 1. Market Scope
Figure 2. Pricing Forecasts Per Unit, 2023- 2032
Figure 3. Porter’s Five Forces
Figure 4. Global Confectionery Decorative Elements Market Revenue (USD Million) By Regions (2021-2032)
Figure 5. Global Confectionery Decorative Elements Market Share (%) By Regions (2023)
Figure 6. North America Confectionery Decorative Elements Revenue (USD Million) By Country (2021-2032)
Figure 7. United States Confectionery Decorative Elements Revenue (USD Million) By Country (2021-2032)
Figure 8. Canada Confectionery Decorative Elements Revenue (USD Million) By Country (2021-2032)
Figure 9. Mexico Confectionery Decorative Elements Revenue (USD Million) By Country (2021-2032)
Figure 10. Europe Confectionery Decorative Elements Revenue (USD Million) By Country (2021-2032)
Figure 11. Germany Confectionery Decorative Elements Revenue (USD Million) By Country (2021-2032)
Figure 12. France Confectionery Decorative Elements Revenue (USD Million) By Country (2021-2032)
Figure 13. United Kingdom Confectionery Decorative Elements Revenue (USD Million) By Country (2021-2032)
Figure 14. Spain Confectionery Decorative Elements Revenue (USD Million) By Country (2021-2032)
Figure 15. Italy Confectionery Decorative Elements Revenue (USD Million) By Country (2021-2032)
Figure 16. Russia Confectionery Decorative Elements Revenue (USD Million) By Country (2021-2032)
Figure 17. Rest of Europe Confectionery Decorative Elements Revenue (USD Million) By Country (2021-2032)
Figure 11. Asia Pacific Confectionery Decorative Elements Revenue (USD Million) By Country (2021-2032)
Figure 12. China Confectionery Decorative Elements Revenue (USD Million) By Country (2021-2032)
Figure 13. Japan Confectionery Decorative Elements Revenue (USD Million) By Country (2021-2032)
Figure 14. India Confectionery Decorative Elements Revenue (USD Million) By Country (2021-2032)
Figure 15. South Korea Confectionery Decorative Elements Revenue (USD Million) By Country (2021-2032)
Figure 16. Australia Confectionery Decorative Elements Revenue (USD Million) By Country (2021-2032)
Figure 17. South East Asia Confectionery Decorative Elements Revenue (USD Million) By Country (2021-2032)
Figure 18. South America Confectionery Decorative Elements Revenue (USD Million) By Country (2021-2032)
Figure 19. Brazil Confectionery Decorative Elements Revenue (USD Million) By Country (2021-2032)
Figure 20. Argentina Confectionery Decorative Elements Revenue (USD Million) By Country (2021-2032)
Figure 21. Rest of Asia Pacific Confectionery Decorative Elements Revenue (USD Million) By Country (2021-2032)
Figure 22. Middle East and Africa Confectionery Decorative Elements Revenue (USD Million) By Region (2021-2032)
Figure 23. Saudi Arabia Confectionery Decorative Elements Revenue (USD Million) By Region (2021-2032)
Figure 24. The UAE Confectionery Decorative Elements Revenue (USD Million) By Region (2021-2032)
Figure 25. Rest of Middle East Confectionery Decorative Elements Revenue (USD Million) By Region (2021-2032)
Figure 26. South Africa Confectionery Decorative Elements Revenue (USD Million) By Region (2021-2032)
Figure 27. Africa Confectionery Decorative Elements Revenue (USD Million) By Region (2021-2032)
Figure 28. North America Confectionery Decorative Elements Revenue (USD Million) By Type (2021-2032)
Figure 29. North America Confectionery Decorative Elements Revenue (USD Million) By Application (2021-2032)
Figure 30. North America Confectionery Decorative Elements Revenue (USD Million) By Product (2021-2032)
Figure 31. Europe Confectionery Decorative Elements Revenue (USD Million) By Type (2021-2032)
Figure 32. Europe Confectionery Decorative Elements Revenue (USD Million) By Application (2021-2032)
Figure 33. Europe Confectionery Decorative Elements Revenue (USD Million) By Product (2021-2032)
Figure 34. Asia Pacific Confectionery Decorative Elements Revenue (USD Million) By Type (2021-2032)
Figure 35. Asia Pacific Confectionery Decorative Elements Revenue (USD Million) By Application (2021-2032)
Figure 36. Asia Pacific Confectionery Decorative Elements Revenue (USD Million) By Product (2021-2032)
Figure 37. South America Confectionery Decorative Elements Revenue (USD Million) By Type (2021-2032)
Figure 38. South America Confectionery Decorative Elements Revenue (USD Million) By Application (2021-2032)
Figure 39. South America Confectionery Decorative Elements Revenue (USD Million) By Product (2021-2032)
Figure 40. Middle East and Africa Confectionery Decorative Elements Revenue (USD Million) By Type (2021-2032)
Figure 41. Middle East and Africa Confectionery Decorative Elements Revenue (USD Million) By Application (2021-2032)
Figure 42. Middle East and Africa Confectionery Decorative Elements Revenue (USD Million) By Product (2021-2032)
By Type
Sprinkles
Mini Marshmallows
Others
By Application
Cakes
Ice Creams
Others
Countries Analyzed
North America (US, Canada, Mexico)
Europe (Germany, UK, France, Spain, Italy, Russia, Rest of Europe)
Asia Pacific (China, India, Japan, South Korea, Australia, South East Asia, Rest of Asia)
South America (Brazil, Argentina, Rest of South America)
Middle East and Africa (Saudi Arabia, UAE, Rest of Middle East, South Africa, Egypt, Rest of Africa)
