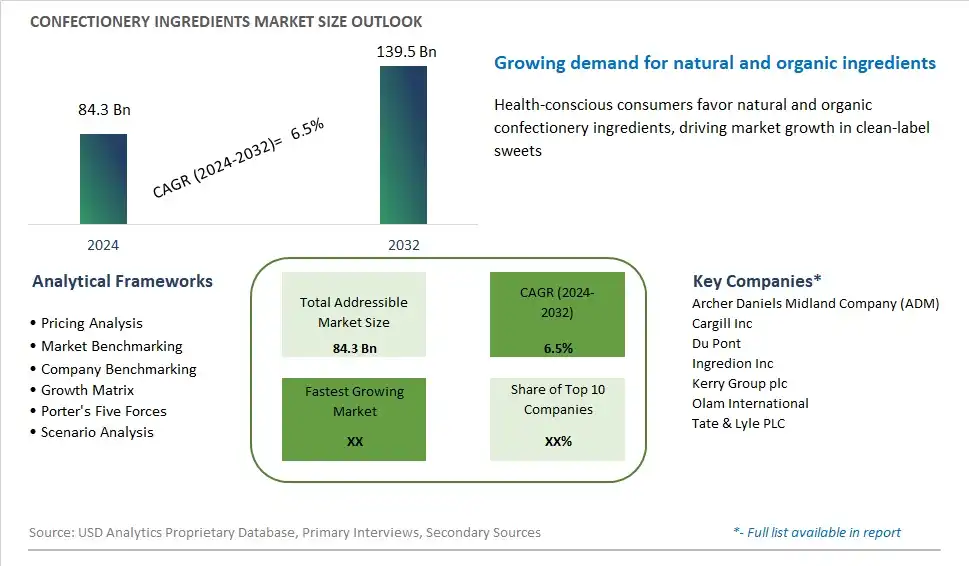
Global Confectionery Ingredients Market Size is valued at $84.3 Billion in 2024 and is forecast to register a growth rate (CAGR) of 6.5% to reach $139.5 Billion by 2032.
The global Confectionery Ingredients Market Comprehensive Study analyzes and forecasts the market size across 6 regions and 24 countries for diverse segments -By Type (Cocoa & Chocolate, Dairy Ingredients, Hydrocolloids, Emulsifiers, Malts, Oils & Shortenings, Starches & Derivatives, Sweeteners, Flavors, Others), By Source (Chocolate, Sugar Confectionery, Gum, Others), By Application (Synthetic, Natural), By Form (Dry, Liquid)
An Introduction to Confectionery Ingredients Market
Confectionery ingredients are fundamental components used in the production of candies, chocolates, gums, and other sweet treats, providing flavor, texture, and visual appeal in 2024. From sugars and sweeteners to fats, emulsifiers, and flavorings, confectionery ingredients come in a wide variety of forms and formulations to meet the diverse needs and preferences of manufacturers and consumers. With a focus on indulgence, innovation, and sensory experiences, confectionery manufacturers are constantly exploring new ingredients, flavors, and formulations to create unique and memorable products that delight consumers of all ages. Whether crafting traditional favorites or experimenting with novel combinations and textures, confectionery makers rely on high-quality ingredients to achieve the desired taste, texture, and appearance in their creations. As consumer demand for premium, natural, and ethically sourced confectionery products grows, the market for confectionery ingredients is expected to expand, driven by investments in research, development, and sustainability initiatives that enhance product quality, safety, and appeal.
Confectionery Ingredients Competitive Landscape
The market report analyses the leading companies in the industry including Archer Daniels Midland Company (ADM), Cargill Inc, Du Pont, Ingredion Inc, Kerry Group plc, Olam International, Tate & Lyle PLC, and Others.
Confectionery Ingredients Market Dynamics
Confectionery Ingredients Market Trend: Clean Label and Natural Ingredients in Confectionery
One prominent trend in the confectionery ingredients market is the increasing demand for clean label and natural ingredients in confectionery products. Consumers are becoming more conscious of the ingredients they consume and are seeking products with simpler, more recognizable ingredient lists. This trend is driven by growing concerns about health, wellness, and transparency in food production. As a result, manufacturers are reformulating their confectionery products to replace artificial colors, flavors, and preservatives with natural alternatives such as fruit extracts, plant-based colorants, and natural sweeteners like stevia and monk fruit. Additionally, there's a growing preference for non-GMO, organic, and sustainably sourced ingredients in confectionery formulations. This trend presents opportunities for ingredient suppliers to innovate and develop clean label solutions that meet the evolving needs and preferences of consumers while maintaining taste, texture, and shelf stability in confectionery products.
Market Driver: Innovation and Customization in Confectionery Formulations
A key driver propelling the growth of the confectionery ingredients market is innovation and customization in confectionery formulations. With increasing competition and changing consumer preferences, manufacturers are seeking to differentiate their products through unique flavor profiles, textures, and sensory experiences. This driver is fueled by factors such as advancements in food science and technology, consumer demand for novelty and variety, and the influence of culinary trends on confectionery innovation. Manufacturers are leveraging innovative ingredients, processing techniques, and formulation methods to create confectionery products that offer distinctive taste sensations, such as gourmet chocolates with exotic flavor infusions, artisanal gummies with natural fruit juices, and functional candies with added vitamins or botanical extracts. Additionally, there's a growing demand for personalized and customizable confectionery options, allowing consumers to create their own flavor combinations, shapes, and packaging designs. Ingredient suppliers can capitalize on this driver by offering a diverse range of innovative and customizable ingredients that enable manufacturers to create unique and differentiated confectionery products that resonate with consumers.
Market Opportunity: Expansion into Healthier and Functional Confectionery Ingredients
An opportunity within the confectionery ingredients market lies in the expansion into healthier and functional ingredients to meet the growing demand for better-for-you confectionery options. With rising concerns about obesity, diabetes, and other health issues associated with excessive sugar consumption, there's increasing interest in confectionery products that offer nutritional benefits and functional properties. This presents an opportunity for ingredient suppliers to develop innovative solutions such as low-calorie sweeteners, sugar alternatives, dietary fibers, and protein fortifiers that enhance the nutritional profile of confectionery products while maintaining taste and texture. Additionally, there's a growing demand for functional ingredients such as antioxidants, vitamins, minerals, and botanical extracts that offer health benefits beyond basic nutrition, such as immune support, stress relief, and energy enhancement. By offering healthier and functional confectionery ingredients, suppliers can tap into new market segments, address consumer demand for healthier indulgences, and contribute to the development of a more balanced and nutritious confectionery market.
Confectionery Ingredients Market Share Analysis: Cocoa & Chocolate held the dominant market share in 2024
In the Confectionery Ingredients Market segmented by type, the cocoa & chocolate segment is the largest, driven by several pivotal factors. Cocoa and chocolate are fundamental ingredients in a wide range of confectionery products, including chocolates, candies, truffles, and chocolate-coated snacks. Their rich flavor, creamy texture, and versatility make them indispensable components in confectionery formulations, appealing to consumers of all ages. Further, cocoa and chocolate are prized for their sensory attributes, including aroma, mouthfeel, and melt-in-your-mouth indulgence, enhancing the overall taste experience of confectionery products. Additionally, the growing demand for premium and artisanal chocolates has fueled the adoption of high-quality cocoa and chocolate ingredients by confectionery manufacturers, driving further growth in this segment. Furthermore, cocoa and chocolate's association with indulgence, celebration, and comfort contributes to their enduring popularity among consumers, sustaining the dominance of this segment in the Confectionery Ingredients Market. As a result, the cocoa & chocolate segment stands as the largest, poised for sustained expansion as consumer demand for delicious and decadent confectionery products continues to rise globally.
Confectionery Ingredients Market Share Analysis: Chocolate market is poised to register the fastest growth rae over the forecast period to 2032
In the Confectionery Ingredients Market segmented by source, the chocolate segment is the fastest-growing, driven by several transformative factors. Chocolate remains a beloved confectionery ingredient globally, prized for its rich flavor, creamy texture, and versatility in various applications. The growing consumer demand for premium and indulgent chocolate products, coupled with the rising popularity of artisanal and gourmet chocolates, has fueled the expansion of this segment. Further, the increasing trend of chocolate consumption as a treat or gift, particularly during festive seasons and special occasions, has contributed to its sustained growth. Additionally, advancements in chocolate processing technologies, such as bean-to-bar production methods and innovative flavor profiles, have further propelled the growth of this segment by offering consumers a diverse range of chocolate experiences. Furthermore, the versatility of chocolate allows for its incorporation into a wide variety of confectionery products, including candies, truffles, bars, and baked goods, driving its demand among confectionery manufacturers. As a result, the chocolate segment stands as the fastest-growing in the Confectionery Ingredients Market, poised for continued expansion as consumers seek high-quality and indulgent chocolate treats.
Confectionery Ingredients Market Share Analysis: Natural held the dominant market share in 2024
In the Confectionery Ingredients Market segmented by application, the natural segment is the largest, driven by several pivotal factors. With the growing consumer preference for clean-label and natural products, there has been a significant shift towards using natural ingredients in confectionery formulations. Natural confectionery ingredients, sourced from plants, fruits, and other natural sources, offer consumers reassurance regarding product safety, healthfulness, and sustainability. Further, natural ingredients contribute to the unique flavor profiles and vibrant colors of confectionery products, enhancing their appeal among health-conscious consumers. Additionally, the increasing awareness of the environmental impact of synthetic ingredients and the desire for transparency in food labeling have further boosted the demand for natural confectionery ingredients. Furthermore, regulatory bodies and industry organizations have implemented stricter regulations and guidelines surrounding the use of artificial additives and preservatives in food products, prompting manufacturers to reformulate their products with natural alternatives. As a result, the natural segment stands as the largest in the Confectionery Ingredients Market, poised for continued growth as consumer preferences continue to prioritize clean-label and natural confectionery options.
Confectionery Ingredients Market Segmentation
By Type
Cocoa & Chocolate
Dairy Ingredients
Hydrocolloids
Emulsifiers
Malts
Oils & Shortenings
Starches & Derivatives
Sweeteners
Flavors
Others
By Source
Chocolate
Sugar Confectionery
Gum
Others
By Application
Synthetic
Natural
By Form
Dry
Liquid
Countries Analyzed
North America (US, Canada, Mexico)
Europe (Germany, UK, France, Spain, Italy, Russia, Rest of Europe)
Asia Pacific (China, India, Japan, South Korea, Australia, South East Asia, Rest of Asia)
South America (Brazil, Argentina, Rest of South America)
Middle East and Africa (Saudi Arabia, UAE, Rest of Middle East, South Africa, Egypt, Rest of Africa)
Confectionery Ingredients Companies Profiled in the Study
Archer Daniels Midland Company (ADM)
Cargill Inc
Du Pont
Ingredion Inc
Kerry Group plc
Olam International
Tate & Lyle PLC
*- List Not Exhaustive
Chapter 1. TABLE OF CONTENTS
Chapter 2. Introduction to Confectionery Ingredients Market
2.1. Market Overview
2.2. Key Statistics and Report Highlights
2.3. Scope of the Comprehensive Study
2.3.1. Market Definition
2.3.2 Countries and Regions Covered
2.3.3 Research Objective
2.3.4 Units, Currency, and Conversions
2.3.5 Industry Value Chain
2.4. Key Market Segments
2.5. Key Companies
2.6. Study Period
Chapter 3. Strategic Analysis Review
3.1. Confectionery Ingredients Pricing Analysis and Forecast
3.2. Porter’s Five Forces
3.3. Market Ecosystem
3.4. SWOT Analysis
3.5. Regulatory Scenario
3.3. Effects of Inflation, Russia-Ukraine War, moderating economic growth, and other macroeconomic factors
Chapter 4. Competitive Landscape
4.1. Market Share Analysis
4.1.1. Global Confectionery Ingredients Market Share by Company, 2023
4.1.2. Product Offerings of Leading Confectionery Ingredients Companies
4.2. Market Entropy
4.2.1. New Product Launches in the Industry
4.2.2. Mergers, Acquisitions, Joint ventures, and Partnerships
4.3. Key Strategies and Best Practices
Chapter 5. Global Market Projections: Best, Reference, and Low Case Scenarios
5.1. Growth Analysis- Case Scenario Definitions
5.2. Low Growth Case Scenario Forecasts
5.3. Reference Growth Case Scenario Forecasts
5.4. High Growth Case Scenario Forecasts
Chapter 6. Market Dynamics
6.1. Confectionery Ingredients Market Drivers
6.2. Confectionery Ingredients Market Challenges
6.6. Confectionery Ingredients Market Opportunities
6.4. Confectionery Ingredients Market Trends
Chapter 7. Global Confectionery Ingredients Market Outlook Trends
7.1. Global Confectionery Ingredients Revenue (USD Million) and CAGR (%) by Type (2021-2032)
7.2. Global Confectionery Ingredients Revenue (USD Million) and CAGR (%) by Application (2021-2032)
7.3. Global Confectionery Ingredients Revenue (USD Million) and CAGR (%) by Product (2021-2032)
By Type
Cocoa & Chocolate
Dairy Ingredients
Hydrocolloids
Emulsifiers
Malts
Oils & Shortenings
Starches & Derivatives
Sweeteners
Flavors
Others
By Source
Chocolate
Sugar Confectionery
Gum
Others
By Application
Synthetic
Natural
By Form
Dry
Liquid
Chapter 8. Global Confectionery Ingredients Regional Analysis and Outlook
8.1. Global Confectionery Ingredients Revenue (USD Million) By Regions (2021- 2032)
8.2. North America Confectionery Ingredients Revenue (USD Million) by Country (2021-2032)
8.2.1. United States Confectionery Ingredients Regional Analysis and Outlook
8.2.2. Canada Confectionery Ingredients Regional Analysis and Outlook
8.2.3. Mexico Confectionery Ingredients Regional Analysis and Outlook
8.3. Europe Confectionery Ingredients Revenue (USD Million), by Country (2021-2032)
8.3.1. Germany Confectionery Ingredients Regional Analysis and Outlook
8.3.2. France Confectionery Ingredients Regional Analysis and Outlook
8.3.3. United Kingdom Confectionery Ingredients Regional Analysis and Outlook
8.3.4. Spain Confectionery Ingredients Regional Analysis and Outlook
8.3.5. Italy Confectionery Ingredients Regional Analysis and Outlook
8.3.6. Russia Confectionery Ingredients Regional Analysis and Outlook
8.3.7. Rest of Europe Confectionery Ingredients Regional Analysis and Outlook
8.4. Asia Pacific Confectionery Ingredients Revenue (USD Million) by Country (2021-2032)
8.4.1. China Confectionery Ingredients Regional Analysis and Outlook
8.4.2. Japan Confectionery Ingredients Regional Analysis and Outlook
8.4.3. India Confectionery Ingredients Regional Analysis and Outlook
8.4.4. South Korea Confectionery Ingredients Regional Analysis and Outlook
8.4.5. Australia Confectionery Ingredients Regional Analysis and Outlook
8.4.6. South East Asia Confectionery Ingredients Regional Analysis and Outlook
8.4.7. Rest of Asia Pacific Confectionery Ingredients Regional Analysis and Outlook
8.5. South America Confectionery Ingredients Revenue (USD Million), by Country (2021-2032)
8.5.1. Brazil Confectionery Ingredients Regional Analysis and Outlook
8.5.2. Argentina Confectionery Ingredients Regional Analysis and Outlook
8.5.3. Rest of South America Confectionery Ingredients Regional Analysis and Outlook
8.6. Middle East and Africa Confectionery Ingredients Revenue (USD Million) by Country (2021-2032)
8.6.1. Middle East Confectionery Ingredients Regional Analysis and Outlook
8.6.2. Africa Confectionery Ingredients Regional Analysis and Outlook
Chapter 9. North America Confectionery Ingredients Analysis and Outlook
9.1. North America Confectionery Ingredients Revenue (USD Million) by Segments (2021-2032)
9.1.1. North America Confectionery Ingredients Revenue (USD Million) by Type (2021-2032)
9.1.2. North America Confectionery Ingredients Revenue (USD Million) by Application (2021-2032)
9.1.3. North America Confectionery Ingredients Revenue (USD Million) by Product (2021-2032)
By Type
Cocoa & Chocolate
Dairy Ingredients
Hydrocolloids
Emulsifiers
Malts
Oils & Shortenings
Starches & Derivatives
Sweeteners
Flavors
Others
By Source
Chocolate
Sugar Confectionery
Gum
Others
By Application
Synthetic
Natural
By Form
Dry
Liquid
Chapter 10. Europe Confectionery Ingredients Analysis and Outlook
10.1. Europe Confectionery Ingredients Revenue (USD Million), by Segments (USD Million) (2021-2032)
10.1.1. Europe Confectionery Ingredients Revenue (USD Million) by Type (2021-2032)
10.1.2. Europe Confectionery Ingredients Revenue (USD Million) by Application (2021-2032)
10.1.3. Europe Confectionery Ingredients Revenue (USD Million) by Product (2021-2032)
By Type
Cocoa & Chocolate
Dairy Ingredients
Hydrocolloids
Emulsifiers
Malts
Oils & Shortenings
Starches & Derivatives
Sweeteners
Flavors
Others
By Source
Chocolate
Sugar Confectionery
Gum
Others
By Application
Synthetic
Natural
By Form
Dry
Liquid
Chapter 11. Asia Pacific Confectionery Ingredients Analysis and Outlook
11.1. Asia Pacific Confectionery Ingredients Revenue (USD Million), and Revenue (USD Million) by Segments (2021-2032)
11.1.1. Asia Pacific Confectionery Ingredients Revenue (USD Million) by Type (2021-2032)
11.1.2. Asia Pacific Confectionery Ingredients Revenue (USD Million) by Application (2021-2032)
11.1.3. Asia Pacific Confectionery Ingredients Revenue (USD Million) by Product (2021-2032)
By Type
Cocoa & Chocolate
Dairy Ingredients
Hydrocolloids
Emulsifiers
Malts
Oils & Shortenings
Starches & Derivatives
Sweeteners
Flavors
Others
By Source
Chocolate
Sugar Confectionery
Gum
Others
By Application
Synthetic
Natural
By Form
Dry
Liquid
Chapter 12. South America Confectionery Ingredients Analysis and Outlook
12.1. South America Confectionery Ingredients Revenue (USD Million), by Segments (2021-2032)
12.1.1. South America Confectionery Ingredients Revenue (USD Million) by Type (2021-2032)
12.1.2. South America Confectionery Ingredients Revenue (USD Million) by Application (2021-2032)
12.1.3. South America Confectionery Ingredients Revenue (USD Million) by Product (2021-2032)
By Type
Cocoa & Chocolate
Dairy Ingredients
Hydrocolloids
Emulsifiers
Malts
Oils & Shortenings
Starches & Derivatives
Sweeteners
Flavors
Others
By Source
Chocolate
Sugar Confectionery
Gum
Others
By Application
Synthetic
Natural
By Form
Dry
Liquid
Chapter 13. Middle East and Africa Confectionery Ingredients Analysis and Outlook
13.1. Middle East and Africa Confectionery Ingredients Revenue (USD Million), by Segments (2021-2032)
13.1.1. Middle East and Africa Confectionery Ingredients Revenue (USD Million) by Type (2021-2032)
13.1.2. Middle East and Africa Confectionery Ingredients Revenue (USD Million) by Application (2021-2032)
13.1.3. Middle East and Africa Confectionery Ingredients Revenue (USD Million) by Product (2021-2032)
By Type
Cocoa & Chocolate
Dairy Ingredients
Hydrocolloids
Emulsifiers
Malts
Oils & Shortenings
Starches & Derivatives
Sweeteners
Flavors
Others
By Source
Chocolate
Sugar Confectionery
Gum
Others
By Application
Synthetic
Natural
By Form
Dry
Liquid
Chapter 14. Confectionery Ingredients Company Profiles
14.1 Business Overview
14.2 Product Profiles
14.3 SWOT Profiles
14.5 Recent Developments
14.6 Financial Profile
List of Companies
Archer Daniels Midland Company (ADM)
Cargill Inc
Du Pont
Ingredion Inc
Kerry Group plc
Olam International
Tate & Lyle PLC
15. Methodology and Data Sources
15.1 Customization Offerings
15.2 Subscription Services
15.3 Related Reports
15.4 Publisher Expertise
LIST OF TABLES
Table 1 Market Segmentation Analysis
Table 2 Global Confectionery Ingredients Market Share of Leading Companies, 2023
Table 3 Product Offerings of Leading Companies
Table 4 Low Growth Scenario Forecasts
Table 5 Reference Case Growth Scenario
Table 6 High Growth Case Scenario
Table 7 Global Confectionery Ingredients Revenue (USD Million) And CAGR (%) By Type (2021-2032)
Table 8 Global Confectionery Ingredients Revenue (USD Million) And CAGR (%) By Application (2021-2032)
Table 9 Global Confectionery Ingredients Revenue (USD Million) And CAGR (%) By Product (2021-2032)
Table 10 Global Confectionery Ingredients Market Revenue (USD Million) By Regions (2021-2032)
Table 11 Global Confectionery Ingredients Market Share (%) By Regions (2021-2032)
Table 12 North America Confectionery Ingredients Revenue (USD Million) By Country (2021-2032)
Table 13 Europe Confectionery Ingredients Revenue (USD Million) By Country (2021-2032)
Table 14 Asia Pacific Confectionery Ingredients Revenue (USD Million) By Country (2021-2032)
Table 15 South America Confectionery Ingredients Revenue (USD Million) By Country (2021-2032)
Table 16 Middle East and Africa Confectionery Ingredients Revenue (USD Million) By Region (2021-2032)
Table 17 North America Confectionery Ingredients Revenue (USD Million) By Type (2021-2032)
Table 18 North America Confectionery Ingredients Revenue (USD Million) By Application (2021-2032)
Table 19 North America Confectionery Ingredients Revenue (USD Million) By Product (2021-2032)
Table 20 Europe Confectionery Ingredients Revenue (USD Million) By Type (2021-2032)
Table 21 Europe Confectionery Ingredients Revenue (USD Million) By Application (2021-2032)
Table 22 Europe Confectionery Ingredients Revenue (USD Million) By Product (2021-2032)
Table 23 Asia Pacific Confectionery Ingredients Revenue (USD Million) By Type (2021-2032)
Table 24 Asia Pacific Confectionery Ingredients Revenue (USD Million) By Application (2021-2032)
Table 25 Asia Pacific Confectionery Ingredients Revenue (USD Million) By Product (2021-2032)
Table 26 South America Confectionery Ingredients Revenue (USD Million) By Type (2021-2032)
Table 27 South America Confectionery Ingredients Revenue (USD Million) By Application (2021-2032)
Table 28 South America Confectionery Ingredients Revenue (USD Million) By Product (2021-2032)
Table 29 Middle East and Africa Confectionery Ingredients Revenue (USD Million) By Type (2021-2032)
Table 30 Middle East and Africa Confectionery Ingredients Revenue (USD Million) By Application (2021-2032)
Table 31 Middle East and Africa Confectionery Ingredients Revenue (USD Million) By Product (2021-2032)
LIST OF FIGURES
Figure 1. Market Scope
Figure 2. Pricing Forecasts Per Unit, 2023- 2032
Figure 3. Porter’s Five Forces
Figure 4. Global Confectionery Ingredients Market Revenue (USD Million) By Regions (2021-2032)
Figure 5. Global Confectionery Ingredients Market Share (%) By Regions (2023)
Figure 6. North America Confectionery Ingredients Revenue (USD Million) By Country (2021-2032)
Figure 7. United States Confectionery Ingredients Revenue (USD Million) By Country (2021-2032)
Figure 8. Canada Confectionery Ingredients Revenue (USD Million) By Country (2021-2032)
Figure 9. Mexico Confectionery Ingredients Revenue (USD Million) By Country (2021-2032)
Figure 10. Europe Confectionery Ingredients Revenue (USD Million) By Country (2021-2032)
Figure 11. Germany Confectionery Ingredients Revenue (USD Million) By Country (2021-2032)
Figure 12. France Confectionery Ingredients Revenue (USD Million) By Country (2021-2032)
Figure 13. United Kingdom Confectionery Ingredients Revenue (USD Million) By Country (2021-2032)
Figure 14. Spain Confectionery Ingredients Revenue (USD Million) By Country (2021-2032)
Figure 15. Italy Confectionery Ingredients Revenue (USD Million) By Country (2021-2032)
Figure 16. Russia Confectionery Ingredients Revenue (USD Million) By Country (2021-2032)
Figure 17. Rest of Europe Confectionery Ingredients Revenue (USD Million) By Country (2021-2032)
Figure 11. Asia Pacific Confectionery Ingredients Revenue (USD Million) By Country (2021-2032)
Figure 12. China Confectionery Ingredients Revenue (USD Million) By Country (2021-2032)
Figure 13. Japan Confectionery Ingredients Revenue (USD Million) By Country (2021-2032)
Figure 14. India Confectionery Ingredients Revenue (USD Million) By Country (2021-2032)
Figure 15. South Korea Confectionery Ingredients Revenue (USD Million) By Country (2021-2032)
Figure 16. Australia Confectionery Ingredients Revenue (USD Million) By Country (2021-2032)
Figure 17. South East Asia Confectionery Ingredients Revenue (USD Million) By Country (2021-2032)
Figure 18. South America Confectionery Ingredients Revenue (USD Million) By Country (2021-2032)
Figure 19. Brazil Confectionery Ingredients Revenue (USD Million) By Country (2021-2032)
Figure 20. Argentina Confectionery Ingredients Revenue (USD Million) By Country (2021-2032)
Figure 21. Rest of Asia Pacific Confectionery Ingredients Revenue (USD Million) By Country (2021-2032)
Figure 22. Middle East and Africa Confectionery Ingredients Revenue (USD Million) By Region (2021-2032)
Figure 23. Saudi Arabia Confectionery Ingredients Revenue (USD Million) By Region (2021-2032)
Figure 24. The UAE Confectionery Ingredients Revenue (USD Million) By Region (2021-2032)
Figure 25. Rest of Middle East Confectionery Ingredients Revenue (USD Million) By Region (2021-2032)
Figure 26. South Africa Confectionery Ingredients Revenue (USD Million) By Region (2021-2032)
Figure 27. Africa Confectionery Ingredients Revenue (USD Million) By Region (2021-2032)
Figure 28. North America Confectionery Ingredients Revenue (USD Million) By Type (2021-2032)
Figure 29. North America Confectionery Ingredients Revenue (USD Million) By Application (2021-2032)
Figure 30. North America Confectionery Ingredients Revenue (USD Million) By Product (2021-2032)
Figure 31. Europe Confectionery Ingredients Revenue (USD Million) By Type (2021-2032)
Figure 32. Europe Confectionery Ingredients Revenue (USD Million) By Application (2021-2032)
Figure 33. Europe Confectionery Ingredients Revenue (USD Million) By Product (2021-2032)
Figure 34. Asia Pacific Confectionery Ingredients Revenue (USD Million) By Type (2021-2032)
Figure 35. Asia Pacific Confectionery Ingredients Revenue (USD Million) By Application (2021-2032)
Figure 36. Asia Pacific Confectionery Ingredients Revenue (USD Million) By Product (2021-2032)
Figure 37. South America Confectionery Ingredients Revenue (USD Million) By Type (2021-2032)
Figure 38. South America Confectionery Ingredients Revenue (USD Million) By Application (2021-2032)
Figure 39. South America Confectionery Ingredients Revenue (USD Million) By Product (2021-2032)
Figure 40. Middle East and Africa Confectionery Ingredients Revenue (USD Million) By Type (2021-2032)
Figure 41. Middle East and Africa Confectionery Ingredients Revenue (USD Million) By Application (2021-2032)
Figure 42. Middle East and Africa Confectionery Ingredients Revenue (USD Million) By Product (2021-2032)
By Type
Cocoa & Chocolate
Dairy Ingredients
Hydrocolloids
Emulsifiers
Malts
Oils & Shortenings
Starches & Derivatives
Sweeteners
Flavors
Others
By Source
Chocolate
Sugar Confectionery
Gum
Others
By Application
Synthetic
Natural
By Form
Dry
Liquid
Countries Analyzed
North America (US, Canada, Mexico)
Europe (Germany, UK, France, Spain, Italy, Russia, Rest of Europe)
Asia Pacific (China, India, Japan, South Korea, Australia, South East Asia, Rest of Asia)
South America (Brazil, Argentina, Rest of South America)
Middle East and Africa (Saudi Arabia, UAE, Rest of Middle East, South Africa, Egypt, Rest of Africa)
