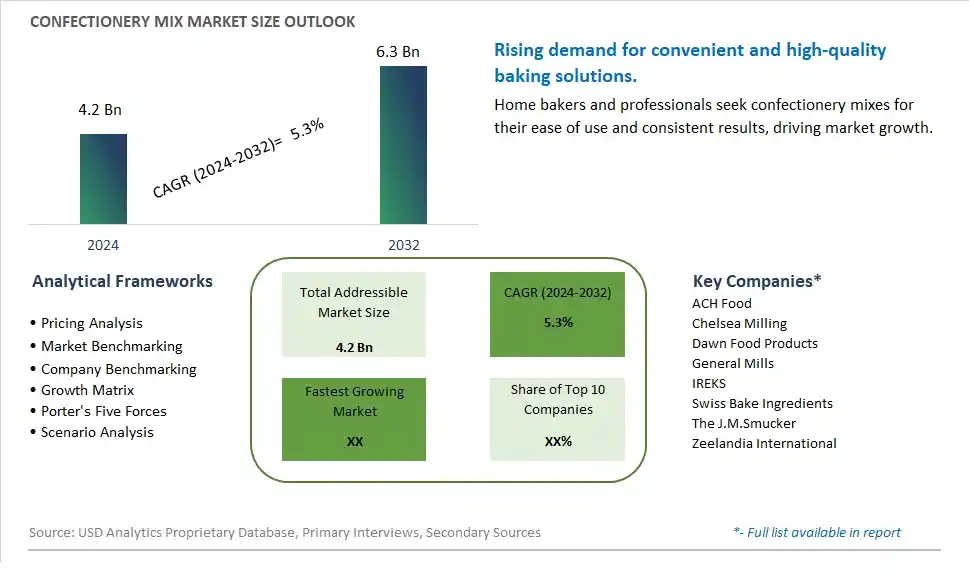
Global Confectionery Mix Market Size is valued at $4.2 Billion in 2024 and is forecast to register a growth rate (CAGR) of 5.3% to reach $6.3 Billion by 2032.
The global Confectionery Mix Market Comprehensive Study analyzes and forecasts the market size across 6 regions and 24 countries for diverse segments -By Type (Muffins, Cookies, Pastries, Pretzels, Gelatins And Jellies, Creams And Filings, Bars, Candies, Others), By Application (Retail, Commercial)
An Introduction to Confectionery Mix Market
In 2024, the Confectionery Mix market is witnessing robust growth, driven by the increasing demand for convenient and high-quality baking and confectionery solutions. Confectionery mixes, which include pre-measured ingredients for making cakes, cookies, brownies, and other sweets, are popular for their ease of use and consistent results. The market is supported by the growing trend towards home baking and the demand for gourmet and artisanal confections. Advances in mix formulation and packaging technologies are enhancing the quality, flavor, and nutritional profile of confectionery mixes. The market is also benefiting from the trend towards clean-label and natural ingredients, appealing to consumers seeking high-quality and convenient baking solutions.
Confectionery Mix Competitive Landscape
The market report analyses the leading companies in the industry including ACH Food, Chelsea Milling, Dawn Food Products, General Mills, IREKS, Swiss Bake Ingredients, The J.M.Smucker, Zeelandia International, and Others.
Confectionery Mix Market Dynamics
Confectionery Mix Market Trend: Premiumization and Innovation
The most prominent market trend in the Confectionery Mix segment is premiumization and innovation. Consumers are seeking unique and indulgent confectionery experiences, leading to a rise in premium and gourmet confectionery mixes that offer exotic flavors, high-quality ingredients, and innovative combinations. This trend is driven by the growing demand for luxury and specialty treats, as well as the desire for novelty and excitement in the confectionery market.
Confectionery Mix Market Driver: Changing Consumer Preferences
The market driver for Confectionery Mixes is the changing consumer preferences towards convenience, variety, and quality. Consumers are looking for hassle-free solutions for baking and creating confectionery items at home, driving the demand for pre-mixed ingredients that offer ease of use and consistent results. Additionally, the demand for diverse flavor profiles and customizable options is fueling the growth of Confectionery Mixes in the market.
Confectionery Mix Market Opportunity: Health-Conscious and Functional Mixes
An opportunity within the Confectionery Mix market lies in the development of health-conscious and functional mixes. With increasing awareness of health and wellness, consumers are seeking confectionery mixes that offer nutritional benefits, such as reduced sugar content, added vitamins and minerals, and natural ingredients. Manufacturers can capitalize on this opportunity by introducing functional mixes that cater to specific dietary needs, such as gluten-free, vegan, or low-calorie options, while maintaining taste and quality. This aligns with the trend towards healthier indulgence and provides a competitive edge in the market.
Confectionery Mix Market Share Analysis: Cookies segment generated the highest revenue share in the industry
The Cookies segment is the largest in the Confectionery Mix Market by type. This segment's dominance can be attributed to the widespread popularity and versatility of cookies as a confectionery item. Cookies are a beloved treat across all age groups and are consumed in various forms and flavors worldwide. The convenience of cookie mixes, which allow consumers to quickly and easily bake fresh cookies at home, significantly contributes to this segment's market share. These mixes cater to the growing demand for homemade baked goods without the complexity and time commitment of baking from scratch. Additionally, the cookies segment benefits from continuous innovation in flavors, ingredients, and packaging, offering options such as gluten-free, organic, and gourmet mixes that cater to health-conscious and niche market segments. Seasonal and themed cookie mixes, particularly during holidays and special occasions, further boost sales. The popularity of cookies in both everyday snacking and celebratory contexts, along with their adaptability to various dietary preferences and trends, ensures that the cookies segment remains the largest in the confectionery mix market.
Confectionery Mix Market Share Analysis: Retail is the fastest growing segment over the forecast period to 2032
The Retail segment is projected to be the fastest-growing application in the Confectionery Mix Market by 2032. This rapid growth is driven by several key factors that reflect changing consumer behaviors and market dynamics. The increasing popularity of home baking, fueled by the rise of baking shows, social media influencers, and the Past few years, has significantly boosted the demand for confectionery mixes in the retail sector. Consumers are more inclined to purchase easy-to-use baking mixes that allow them to create homemade treats with minimal effort and time. The convenience, variety, and quality of retail confectionery mixes have improved significantly, catering to a wide range of tastes and dietary preferences, including gluten-free, organic, and vegan options. Additionally, the expansion of e-commerce platforms has made it easier for consumers to access a diverse selection of confectionery mixes, further driving sales in the retail segment. Seasonal and holiday-themed mixes also contribute to periodic spikes in demand, enhancing the segment's growth prospects. As a result, the retail segment is expected to experience robust growth, driven by convenience, variety, and the ongoing trend of home baking.
Confectionery Mix Market Segmentation
By Type
Muffins
Cookies
Pastries
Pretzels
Gelatins And Jellies
Creams And Filings
Bars
Candies
Others
By Application
Retail
Commercial
Countries Analyzed
North America (US, Canada, Mexico)
Europe (Germany, UK, France, Spain, Italy, Russia, Rest of Europe)
Asia Pacific (China, India, Japan, South Korea, Australia, South East Asia, Rest of Asia)
South America (Brazil, Argentina, Rest of South America)
Middle East and Africa (Saudi Arabia, UAE, Rest of Middle East, South Africa, Egypt, Rest of Africa)
Confectionery Mix Companies Profiled in the Study
ACH Food
Chelsea Milling
Dawn Food Products
General Mills
IREKS
Swiss Bake Ingredients
The J.M.Smucker
Zeelandia International
*- List Not Exhaustive
Chapter 1. TABLE OF CONTENTS
Chapter 2. Introduction to Confectionery Mix Market
2.1. Market Overview
2.2. Key Statistics and Report Highlights
2.3. Scope of the Comprehensive Study
2.3.1. Market Definition
2.3.2 Countries and Regions Covered
2.3.3 Research Objective
2.3.4 Units, Currency, and Conversions
2.3.5 Industry Value Chain
2.4. Key Market Segments
2.5. Key Companies
2.6. Study Period
Chapter 3. Strategic Analysis Review
3.1. Confectionery Mix Pricing Analysis and Forecast
3.2. Porter’s Five Forces
3.3. Market Ecosystem
3.4. SWOT Analysis
3.5. Regulatory Scenario
3.3. Effects of Inflation, Russia-Ukraine War, moderating economic growth, and other macroeconomic factors
Chapter 4. Competitive Landscape
4.1. Market Share Analysis
4.1.1. Global Confectionery Mix Market Share by Company, 2023
4.1.2. Product Offerings of Leading Confectionery Mix Companies
4.2. Market Entropy
4.2.1. New Product Launches in the Industry
4.2.2. Mergers, Acquisitions, Joint ventures, and Partnerships
4.3. Key Strategies and Best Practices
Chapter 5. Global Market Projections: Best, Reference, and Low Case Scenarios
5.1. Growth Analysis- Case Scenario Definitions
5.2. Low Growth Case Scenario Forecasts
5.3. Reference Growth Case Scenario Forecasts
5.4. High Growth Case Scenario Forecasts
Chapter 6. Market Dynamics
6.1. Confectionery Mix Market Drivers
6.2. Confectionery Mix Market Challenges
6.6. Confectionery Mix Market Opportunities
6.4. Confectionery Mix Market Trends
Chapter 7. Global Confectionery Mix Market Outlook Trends
7.1. Global Confectionery Mix Revenue (USD Million) and CAGR (%) by Type (2021-2032)
7.2. Global Confectionery Mix Revenue (USD Million) and CAGR (%) by Application (2021-2032)
7.3. Global Confectionery Mix Revenue (USD Million) and CAGR (%) by Product (2021-2032)
By Type
Muffins
Cookies
Pastries
Pretzels
Gelatins And Jellies
Creams And Filings
Bars
Candies
Others
By Application
Retail
Commercial
Chapter 8. Global Confectionery Mix Regional Analysis and Outlook
8.1. Global Confectionery Mix Revenue (USD Million) By Regions (2021- 2032)
8.2. North America Confectionery Mix Revenue (USD Million) by Country (2021-2032)
8.2.1. United States Confectionery Mix Regional Analysis and Outlook
8.2.2. Canada Confectionery Mix Regional Analysis and Outlook
8.2.3. Mexico Confectionery Mix Regional Analysis and Outlook
8.3. Europe Confectionery Mix Revenue (USD Million), by Country (2021-2032)
8.3.1. Germany Confectionery Mix Regional Analysis and Outlook
8.3.2. France Confectionery Mix Regional Analysis and Outlook
8.3.3. United Kingdom Confectionery Mix Regional Analysis and Outlook
8.3.4. Spain Confectionery Mix Regional Analysis and Outlook
8.3.5. Italy Confectionery Mix Regional Analysis and Outlook
8.3.6. Russia Confectionery Mix Regional Analysis and Outlook
8.3.7. Rest of Europe Confectionery Mix Regional Analysis and Outlook
8.4. Asia Pacific Confectionery Mix Revenue (USD Million) by Country (2021-2032)
8.4.1. China Confectionery Mix Regional Analysis and Outlook
8.4.2. Japan Confectionery Mix Regional Analysis and Outlook
8.4.3. India Confectionery Mix Regional Analysis and Outlook
8.4.4. South Korea Confectionery Mix Regional Analysis and Outlook
8.4.5. Australia Confectionery Mix Regional Analysis and Outlook
8.4.6. South East Asia Confectionery Mix Regional Analysis and Outlook
8.4.7. Rest of Asia Pacific Confectionery Mix Regional Analysis and Outlook
8.5. South America Confectionery Mix Revenue (USD Million), by Country (2021-2032)
8.5.1. Brazil Confectionery Mix Regional Analysis and Outlook
8.5.2. Argentina Confectionery Mix Regional Analysis and Outlook
8.5.3. Rest of South America Confectionery Mix Regional Analysis and Outlook
8.6. Middle East and Africa Confectionery Mix Revenue (USD Million) by Country (2021-2032)
8.6.1. Middle East Confectionery Mix Regional Analysis and Outlook
8.6.2. Africa Confectionery Mix Regional Analysis and Outlook
Chapter 9. North America Confectionery Mix Analysis and Outlook
9.1. North America Confectionery Mix Revenue (USD Million) by Segments (2021-2032)
9.1.1. North America Confectionery Mix Revenue (USD Million) by Type (2021-2032)
9.1.2. North America Confectionery Mix Revenue (USD Million) by Application (2021-2032)
9.1.3. North America Confectionery Mix Revenue (USD Million) by Product (2021-2032)
By Type
Muffins
Cookies
Pastries
Pretzels
Gelatins And Jellies
Creams And Filings
Bars
Candies
Others
By Application
Retail
Commercial
Chapter 10. Europe Confectionery Mix Analysis and Outlook
10.1. Europe Confectionery Mix Revenue (USD Million), by Segments (USD Million) (2021-2032)
10.1.1. Europe Confectionery Mix Revenue (USD Million) by Type (2021-2032)
10.1.2. Europe Confectionery Mix Revenue (USD Million) by Application (2021-2032)
10.1.3. Europe Confectionery Mix Revenue (USD Million) by Product (2021-2032)
By Type
Muffins
Cookies
Pastries
Pretzels
Gelatins And Jellies
Creams And Filings
Bars
Candies
Others
By Application
Retail
Commercial
Chapter 11. Asia Pacific Confectionery Mix Analysis and Outlook
11.1. Asia Pacific Confectionery Mix Revenue (USD Million), and Revenue (USD Million) by Segments (2021-2032)
11.1.1. Asia Pacific Confectionery Mix Revenue (USD Million) by Type (2021-2032)
11.1.2. Asia Pacific Confectionery Mix Revenue (USD Million) by Application (2021-2032)
11.1.3. Asia Pacific Confectionery Mix Revenue (USD Million) by Product (2021-2032)
By Type
Muffins
Cookies
Pastries
Pretzels
Gelatins And Jellies
Creams And Filings
Bars
Candies
Others
By Application
Retail
Commercial
Chapter 12. South America Confectionery Mix Analysis and Outlook
12.1. South America Confectionery Mix Revenue (USD Million), by Segments (2021-2032)
12.1.1. South America Confectionery Mix Revenue (USD Million) by Type (2021-2032)
12.1.2. South America Confectionery Mix Revenue (USD Million) by Application (2021-2032)
12.1.3. South America Confectionery Mix Revenue (USD Million) by Product (2021-2032)
By Type
Muffins
Cookies
Pastries
Pretzels
Gelatins And Jellies
Creams And Filings
Bars
Candies
Others
By Application
Retail
Commercial
Chapter 13. Middle East and Africa Confectionery Mix Analysis and Outlook
13.1. Middle East and Africa Confectionery Mix Revenue (USD Million), by Segments (2021-2032)
13.1.1. Middle East and Africa Confectionery Mix Revenue (USD Million) by Type (2021-2032)
13.1.2. Middle East and Africa Confectionery Mix Revenue (USD Million) by Application (2021-2032)
13.1.3. Middle East and Africa Confectionery Mix Revenue (USD Million) by Product (2021-2032)
By Type
Muffins
Cookies
Pastries
Pretzels
Gelatins And Jellies
Creams And Filings
Bars
Candies
Others
By Application
Retail
Commercial
Chapter 14. Confectionery Mix Company Profiles
14.1 Business Overview
14.2 Product Profiles
14.3 SWOT Profiles
14.5 Recent Developments
14.6 Financial Profile
List of Companies
ACH Food
Chelsea Milling
Dawn Food Products
General Mills
IREKS
Swiss Bake Ingredients
The J.M.Smucker
Zeelandia International
15. Methodology and Data Sources
15.1 Customization Offerings
15.2 Subscription Services
15.3 Related Reports
15.4 Publisher Expertise
LIST OF TABLES
Table 1 Market Segmentation Analysis
Table 2 Global Confectionery Mix Market Share of Leading Companies, 2023
Table 3 Product Offerings of Leading Companies
Table 4 Low Growth Scenario Forecasts
Table 5 Reference Case Growth Scenario
Table 6 High Growth Case Scenario
Table 7 Global Confectionery Mix Revenue (USD Million) And CAGR (%) By Type (2021-2032)
Table 8 Global Confectionery Mix Revenue (USD Million) And CAGR (%) By Application (2021-2032)
Table 9 Global Confectionery Mix Revenue (USD Million) And CAGR (%) By Product (2021-2032)
Table 10 Global Confectionery Mix Market Revenue (USD Million) By Regions (2021-2032)
Table 11 Global Confectionery Mix Market Share (%) By Regions (2021-2032)
Table 12 North America Confectionery Mix Revenue (USD Million) By Country (2021-2032)
Table 13 Europe Confectionery Mix Revenue (USD Million) By Country (2021-2032)
Table 14 Asia Pacific Confectionery Mix Revenue (USD Million) By Country (2021-2032)
Table 15 South America Confectionery Mix Revenue (USD Million) By Country (2021-2032)
Table 16 Middle East and Africa Confectionery Mix Revenue (USD Million) By Region (2021-2032)
Table 17 North America Confectionery Mix Revenue (USD Million) By Type (2021-2032)
Table 18 North America Confectionery Mix Revenue (USD Million) By Application (2021-2032)
Table 19 North America Confectionery Mix Revenue (USD Million) By Product (2021-2032)
Table 20 Europe Confectionery Mix Revenue (USD Million) By Type (2021-2032)
Table 21 Europe Confectionery Mix Revenue (USD Million) By Application (2021-2032)
Table 22 Europe Confectionery Mix Revenue (USD Million) By Product (2021-2032)
Table 23 Asia Pacific Confectionery Mix Revenue (USD Million) By Type (2021-2032)
Table 24 Asia Pacific Confectionery Mix Revenue (USD Million) By Application (2021-2032)
Table 25 Asia Pacific Confectionery Mix Revenue (USD Million) By Product (2021-2032)
Table 26 South America Confectionery Mix Revenue (USD Million) By Type (2021-2032)
Table 27 South America Confectionery Mix Revenue (USD Million) By Application (2021-2032)
Table 28 South America Confectionery Mix Revenue (USD Million) By Product (2021-2032)
Table 29 Middle East and Africa Confectionery Mix Revenue (USD Million) By Type (2021-2032)
Table 30 Middle East and Africa Confectionery Mix Revenue (USD Million) By Application (2021-2032)
Table 31 Middle East and Africa Confectionery Mix Revenue (USD Million) By Product (2021-2032)
LIST OF FIGURES
Figure 1. Market Scope
Figure 2. Pricing Forecasts Per Unit, 2023- 2032
Figure 3. Porter’s Five Forces
Figure 4. Global Confectionery Mix Market Revenue (USD Million) By Regions (2021-2032)
Figure 5. Global Confectionery Mix Market Share (%) By Regions (2023)
Figure 6. North America Confectionery Mix Revenue (USD Million) By Country (2021-2032)
Figure 7. United States Confectionery Mix Revenue (USD Million) By Country (2021-2032)
Figure 8. Canada Confectionery Mix Revenue (USD Million) By Country (2021-2032)
Figure 9. Mexico Confectionery Mix Revenue (USD Million) By Country (2021-2032)
Figure 10. Europe Confectionery Mix Revenue (USD Million) By Country (2021-2032)
Figure 11. Germany Confectionery Mix Revenue (USD Million) By Country (2021-2032)
Figure 12. France Confectionery Mix Revenue (USD Million) By Country (2021-2032)
Figure 13. United Kingdom Confectionery Mix Revenue (USD Million) By Country (2021-2032)
Figure 14. Spain Confectionery Mix Revenue (USD Million) By Country (2021-2032)
Figure 15. Italy Confectionery Mix Revenue (USD Million) By Country (2021-2032)
Figure 16. Russia Confectionery Mix Revenue (USD Million) By Country (2021-2032)
Figure 17. Rest of Europe Confectionery Mix Revenue (USD Million) By Country (2021-2032)
Figure 11. Asia Pacific Confectionery Mix Revenue (USD Million) By Country (2021-2032)
Figure 12. China Confectionery Mix Revenue (USD Million) By Country (2021-2032)
Figure 13. Japan Confectionery Mix Revenue (USD Million) By Country (2021-2032)
Figure 14. India Confectionery Mix Revenue (USD Million) By Country (2021-2032)
Figure 15. South Korea Confectionery Mix Revenue (USD Million) By Country (2021-2032)
Figure 16. Australia Confectionery Mix Revenue (USD Million) By Country (2021-2032)
Figure 17. South East Asia Confectionery Mix Revenue (USD Million) By Country (2021-2032)
Figure 18. South America Confectionery Mix Revenue (USD Million) By Country (2021-2032)
Figure 19. Brazil Confectionery Mix Revenue (USD Million) By Country (2021-2032)
Figure 20. Argentina Confectionery Mix Revenue (USD Million) By Country (2021-2032)
Figure 21. Rest of Asia Pacific Confectionery Mix Revenue (USD Million) By Country (2021-2032)
Figure 22. Middle East and Africa Confectionery Mix Revenue (USD Million) By Region (2021-2032)
Figure 23. Saudi Arabia Confectionery Mix Revenue (USD Million) By Region (2021-2032)
Figure 24. The UAE Confectionery Mix Revenue (USD Million) By Region (2021-2032)
Figure 25. Rest of Middle East Confectionery Mix Revenue (USD Million) By Region (2021-2032)
Figure 26. South Africa Confectionery Mix Revenue (USD Million) By Region (2021-2032)
Figure 27. Africa Confectionery Mix Revenue (USD Million) By Region (2021-2032)
Figure 28. North America Confectionery Mix Revenue (USD Million) By Type (2021-2032)
Figure 29. North America Confectionery Mix Revenue (USD Million) By Application (2021-2032)
Figure 30. North America Confectionery Mix Revenue (USD Million) By Product (2021-2032)
Figure 31. Europe Confectionery Mix Revenue (USD Million) By Type (2021-2032)
Figure 32. Europe Confectionery Mix Revenue (USD Million) By Application (2021-2032)
Figure 33. Europe Confectionery Mix Revenue (USD Million) By Product (2021-2032)
Figure 34. Asia Pacific Confectionery Mix Revenue (USD Million) By Type (2021-2032)
Figure 35. Asia Pacific Confectionery Mix Revenue (USD Million) By Application (2021-2032)
Figure 36. Asia Pacific Confectionery Mix Revenue (USD Million) By Product (2021-2032)
Figure 37. South America Confectionery Mix Revenue (USD Million) By Type (2021-2032)
Figure 38. South America Confectionery Mix Revenue (USD Million) By Application (2021-2032)
Figure 39. South America Confectionery Mix Revenue (USD Million) By Product (2021-2032)
Figure 40. Middle East and Africa Confectionery Mix Revenue (USD Million) By Type (2021-2032)
Figure 41. Middle East and Africa Confectionery Mix Revenue (USD Million) By Application (2021-2032)
Figure 42. Middle East and Africa Confectionery Mix Revenue (USD Million) By Product (2021-2032)
By Type
Muffins
Cookies
Pastries
Pretzels
Gelatins And Jellies
Creams And Filings
Bars
Candies
Others
By Application
Retail
Commercial
Countries Analyzed
North America (US, Canada, Mexico)
Europe (Germany, UK, France, Spain, Italy, Russia, Rest of Europe)
Asia Pacific (China, India, Japan, South Korea, Australia, South East Asia, Rest of Asia)
South America (Brazil, Argentina, Rest of South America)
Middle East and Africa (Saudi Arabia, UAE, Rest of Middle East, South Africa, Egypt, Rest of Africa)
