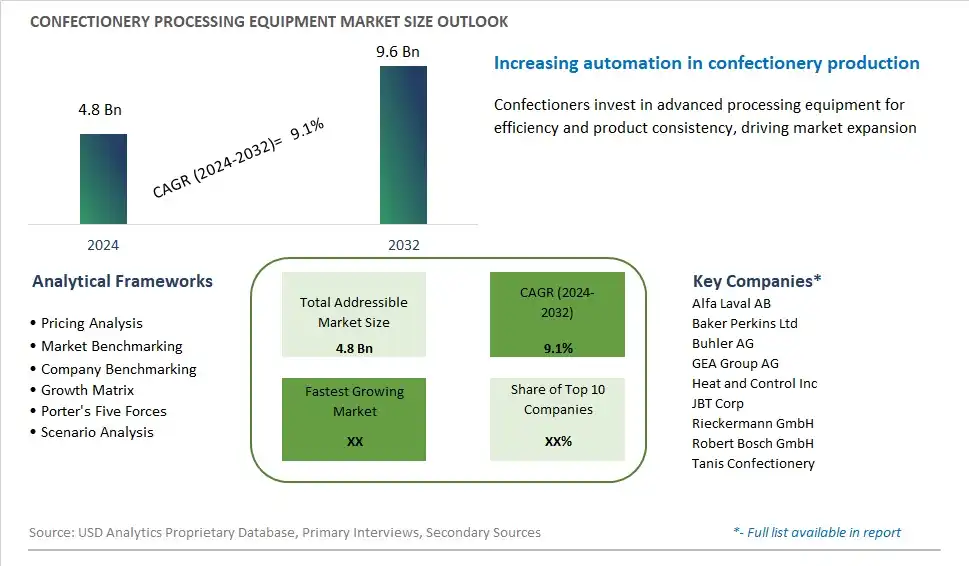
Global Confectionery Processing Equipment Market Size is valued at $4.8 Billion in 2024 and is forecast to register a growth rate (CAGR) of 9.1% to reach $9.6 Billion by 2032.
The global Confectionery Processing Equipment Market Comprehensive Study analyzes and forecasts the market size across 6 regions and 24 countries for diverse segments -By Product (Soft Confectionery, Hard Candies, Chewing Gums, Gummies & Jellies, Others), By Type (Thermal, Mixers, Blenders, Cutters, Extrusion, Cooling, Coating, Others), By Mode of Operation (Automatic, Semi-Automatic)
An Introduction to Confectionery Processing Equipment Market
Confectionery processing equipment encompasses a wide range of machinery and systems used in the production of candies, chocolates, gums, and other sweet treats, facilitating various stages of manufacturing such as mixing, cooking, molding, enrobing, and packaging. In 2024, manufacturers rely on advanced processing equipment to optimize production efficiency, consistency, and quality while meeting stringent food safety standards and consumer preferences. From batch cookers and tempering machines to depositor lines and wrapping systems, confectionery processing equipment comes in diverse configurations and capacities to suit the needs of small artisanal producers and large-scale manufacturers alike. With a focus on automation, flexibility, and sustainability, the latest innovations in confectionery processing equipment offer enhanced control, precision, and energy efficiency, driving productivity and profitability in the industry. As consumer demand for indulgent and innovative confectionery products continues to grow, the market for confectionery processing equipment is expected to expand, driven by investments in technology, customization, and automation that enable manufacturers to create premium and personalized offerings.
Confectionery Processing Equipment Competitive Landscape
The market report analyses the leading companies in the industry including Alfa Laval AB, Baker Perkins Ltd, Buhler AG, GEA Group AG, Heat and Control Inc, JBT Corp, Rieckermann GmbH, Robert Bosch GmbH, Tanis Confectionery, and Others.
Confectionery Processing Equipment Market Dynamics
Confectionery Processing Equipment Market Trend: Automation and Efficiency in Confectionery Processing
One prominent trend in the confectionery processing equipment market is the increasing adoption of automation and efficiency-enhancing technologies in manufacturing processes. With the growing demand for higher productivity, consistency, and quality in confectionery production, manufacturers are investing in advanced processing equipment that offers automation, digital controls, and real-time monitoring capabilities. This trend is driven by factors such as labor shortages, rising labor costs, and the need for faster production cycles to meet consumer demand. Manufacturers are leveraging automation to streamline processes such as mixing, molding, coating, and packaging, reducing manual intervention, minimizing errors, and optimizing resource utilization. Additionally, there's a growing emphasis on energy efficiency, waste reduction, and sustainability in confectionery processing, prompting manufacturers to invest in equipment that offers eco-friendly features and resource-saving technologies. This trend presents opportunities for equipment suppliers to develop innovative solutions that improve production efficiency, reduce operational costs, and enhance overall competitiveness in the confectionery market.
Market Driver: Demand for Novelty and Customization in Confectionery Products
A key driver propelling the growth of the confectionery processing equipment market is the increasing demand for novelty, customization, and personalization in confectionery products. With changing consumer preferences and evolving food trends, there's a growing interest in unique flavor combinations, shapes, colors, and textures in confectionery products. This driver is fueled by factors such as social media influence, the desire for experiential eating, and the popularity of themed and seasonal confectionery offerings. Manufacturers are responding by investing in versatile processing equipment that allows them to create a wide variety of confectionery products, including artisanal chocolates, gourmet gummies, customized candies, and novelty treats. Additionally, there's a growing demand for equipment that enables manufacturers to offer personalized confectionery options, such as customizable packaging, on-demand printing, and interactive experiences for consumers. By offering equipment that supports innovation and customization in confectionery production, suppliers can help manufacturers differentiate their products, capture consumer attention, and stay ahead of market trends.
Market Opportunity: Integration of Industry 4.0 Technologies in Confectionery Processing
An opportunity within the confectionery processing equipment market lies in the integration of Industry 4.0 technologies to enhance production efficiency, quality control, and traceability in confectionery processing. With the digitization of manufacturing processes, there's increasing interest in technologies such as IoT (Internet of Things), AI (Artificial Intelligence), machine learning, and data analytics to optimize equipment performance, predict maintenance needs, and ensure product consistency. This presents an opportunity for equipment suppliers to develop smart and connected processing equipment that offers real-time monitoring, remote control capabilities, and predictive maintenance functionalities. Additionally, there's potential for equipment that enables manufacturers to collect and analyze data throughout the production process, allowing for continuous improvement, recipe optimization, and quality assurance. By embracing Industry 4.0 principles and offering advanced processing equipment with digital capabilities, suppliers can help confectionery manufacturers improve operational efficiency, reduce downtime, and meet the demands of an increasingly digital and interconnected marketplace.
Confectionery Processing Equipment Market Share Analysis: Gummies & Jellies held the dominant market share in 2024
In the Confectionery Processing Equipment Market segmented by product, the gummies & jellies segment is the largest, propelled by several pivotal factors. Gummies and jellies represent a significant category within the confectionery industry, known for their wide appeal among consumers of all ages. The production of gummies and jellies requires specialized processing equipment to achieve the desired texture, shape, and consistency. Manufacturers rely on advanced machinery for tasks such as mixing, heating, shaping, and packaging to ensure the quality and uniformity of these confectionery products. Further, gummies and jellies offer versatility in flavors, shapes, and formulations, allowing manufacturers to cater to diverse consumer preferences and market demands. Additionally, the growing popularity of functional gummies and jellies, fortified with vitamins, minerals, and other health-enhancing ingredients, has further boosted demand for processing equipment in this segment. Furthermore, the widespread availability of gummies and jellies across various retail channels, including supermarkets, convenience stores, and online platforms, contributes to the dominance of this segment in the Confectionery Processing Equipment Market. As a result, the gummies & jellies segment stands as the largest, poised for sustained growth as consumer demand for these chewy and flavorful confectionery treats continues to rise globally.
Confectionery Processing Equipment Market Share Analysis: Extrusion market is poised to register the fastest growth rae over the forecast period to 2032
In the Confectionery Processing Equipment Market segmented by type, the extrusion segment is the fastest-growing, driven by several transformative factors. Extrusion equipment plays a vital role in the production of a wide range of confectionery products, including extruded snacks, cereal bars, filled candies, and licorice ropes. The versatility of extrusion technology allows manufacturers to create innovative and complex shapes, textures, and fillings in confectionery products, catering to evolving consumer preferences for unique and indulgent treats. Further, extrusion equipment offers efficiency and flexibility in production processes, enabling manufacturers to achieve higher throughput and faster turnaround times while maintaining product quality and consistency. Additionally, the growing demand for healthier and functional confectionery products, such as protein bars, fiber-enriched snacks, and fortified candies, has spurred interest in extrusion technology for the incorporation of nutritious ingredients and formulations. Furthermore, advancements in extrusion equipment design, automation, and control systems have further enhanced its capabilities and reliability, driving its adoption by confectionery manufacturers seeking to optimize their production operations. As a result, the extrusion segment stands as the fastest-growing in the Confectionery Processing Equipment Market, poised for continued expansion as manufacturers leverage extrusion technology to innovate and diversify their product offerings to meet evolving consumer demands.
Confectionery Processing Equipment Market Share Analysis: Automatic held the dominant market share in 2024
In the Confectionery Processing Equipment Market segmented by mode of operation, the automatic segment is the largest, driven by several pivotal factors. Automatic confectionery processing equipment offers efficiency, consistency, and scalability in production operations, making it a preferred choice for manufacturers seeking to streamline their processes and maximize output. Automated equipment reduces reliance on manual labor, minimizing human error and ensuring higher levels of precision and quality control throughout the production process. Further, automatic systems enable manufacturers to achieve higher throughput rates and meet the demands of large-scale production volumes, catering to the needs of mass-market confectionery brands and retailers. Additionally, advancements in automation technologies, such as robotics, sensors, and data analytics, have further enhanced the capabilities and efficiency of automatic confectionery processing equipment, driving its widespread adoption across the industry. Furthermore, the growing emphasis on operational efficiency, cost reduction, and product consistency in the confectionery manufacturing sector has fueled the demand for automated solutions. As a result, the automatic segment stands as the largest in the Confectionery Processing Equipment Market, poised for continued dominance as manufacturers prioritize investments in automation to enhance productivity and competitiveness in the global market.
Confectionery Processing Equipment Market Segmentation
By Product
Soft Confectionery
Hard Candies
Chewing Gums
Gummies & Jellies
Others
By Type
Thermal
Mixers
Blenders
Cutters
Extrusion
Cooling
Coating
Others
By Mode of Operation
Automatic
Semi-Automatic
Countries Analyzed
North America (US, Canada, Mexico)
Europe (Germany, UK, France, Spain, Italy, Russia, Rest of Europe)
Asia Pacific (China, India, Japan, South Korea, Australia, South East Asia, Rest of Asia)
South America (Brazil, Argentina, Rest of South America)
Middle East and Africa (Saudi Arabia, UAE, Rest of Middle East, South Africa, Egypt, Rest of Africa)
Confectionery Processing Equipment Companies Profiled in the Study
Alfa Laval AB
Baker Perkins Ltd
Buhler AG
GEA Group AG
Heat and Control Inc
JBT Corp
Rieckermann GmbH
Robert Bosch GmbH
Tanis Confectionery
*- List Not Exhaustive
Chapter 1. TABLE OF CONTENTS
Chapter 2. Introduction to Confectionery Processing Equipment Market
2.1. Market Overview
2.2. Key Statistics and Report Highlights
2.3. Scope of the Comprehensive Study
2.3.1. Market Definition
2.3.2 Countries and Regions Covered
2.3.3 Research Objective
2.3.4 Units, Currency, and Conversions
2.3.5 Industry Value Chain
2.4. Key Market Segments
2.5. Key Companies
2.6. Study Period
Chapter 3. Strategic Analysis Review
3.1. Confectionery Processing Equipment Pricing Analysis and Forecast
3.2. Porter’s Five Forces
3.3. Market Ecosystem
3.4. SWOT Analysis
3.5. Regulatory Scenario
3.3. Effects of Inflation, Russia-Ukraine War, moderating economic growth, and other macroeconomic factors
Chapter 4. Competitive Landscape
4.1. Market Share Analysis
4.1.1. Global Confectionery Processing Equipment Market Share by Company, 2023
4.1.2. Product Offerings of Leading Confectionery Processing Equipment Companies
4.2. Market Entropy
4.2.1. New Product Launches in the Industry
4.2.2. Mergers, Acquisitions, Joint ventures, and Partnerships
4.3. Key Strategies and Best Practices
Chapter 5. Global Market Projections: Best, Reference, and Low Case Scenarios
5.1. Growth Analysis- Case Scenario Definitions
5.2. Low Growth Case Scenario Forecasts
5.3. Reference Growth Case Scenario Forecasts
5.4. High Growth Case Scenario Forecasts
Chapter 6. Market Dynamics
6.1. Confectionery Processing Equipment Market Drivers
6.2. Confectionery Processing Equipment Market Challenges
6.6. Confectionery Processing Equipment Market Opportunities
6.4. Confectionery Processing Equipment Market Trends
Chapter 7. Global Confectionery Processing Equipment Market Outlook Trends
7.1. Global Confectionery Processing Equipment Revenue (USD Million) and CAGR (%) by Type (2021-2032)
7.2. Global Confectionery Processing Equipment Revenue (USD Million) and CAGR (%) by Application (2021-2032)
7.3. Global Confectionery Processing Equipment Revenue (USD Million) and CAGR (%) by Product (2021-2032)
By Product
Soft Confectionery
Hard Candies
Chewing Gums
Gummies & Jellies
Others
By Type
Thermal
Mixers
Blenders
Cutters
Extrusion
Cooling
Coating
Others
By Mode of Operation
Automatic
Semi-Automatic
Chapter 8. Global Confectionery Processing Equipment Regional Analysis and Outlook
8.1. Global Confectionery Processing Equipment Revenue (USD Million) By Regions (2021- 2032)
8.2. North America Confectionery Processing Equipment Revenue (USD Million) by Country (2021-2032)
8.2.1. United States Confectionery Processing Equipment Regional Analysis and Outlook
8.2.2. Canada Confectionery Processing Equipment Regional Analysis and Outlook
8.2.3. Mexico Confectionery Processing Equipment Regional Analysis and Outlook
8.3. Europe Confectionery Processing Equipment Revenue (USD Million), by Country (2021-2032)
8.3.1. Germany Confectionery Processing Equipment Regional Analysis and Outlook
8.3.2. France Confectionery Processing Equipment Regional Analysis and Outlook
8.3.3. United Kingdom Confectionery Processing Equipment Regional Analysis and Outlook
8.3.4. Spain Confectionery Processing Equipment Regional Analysis and Outlook
8.3.5. Italy Confectionery Processing Equipment Regional Analysis and Outlook
8.3.6. Russia Confectionery Processing Equipment Regional Analysis and Outlook
8.3.7. Rest of Europe Confectionery Processing Equipment Regional Analysis and Outlook
8.4. Asia Pacific Confectionery Processing Equipment Revenue (USD Million) by Country (2021-2032)
8.4.1. China Confectionery Processing Equipment Regional Analysis and Outlook
8.4.2. Japan Confectionery Processing Equipment Regional Analysis and Outlook
8.4.3. India Confectionery Processing Equipment Regional Analysis and Outlook
8.4.4. South Korea Confectionery Processing Equipment Regional Analysis and Outlook
8.4.5. Australia Confectionery Processing Equipment Regional Analysis and Outlook
8.4.6. South East Asia Confectionery Processing Equipment Regional Analysis and Outlook
8.4.7. Rest of Asia Pacific Confectionery Processing Equipment Regional Analysis and Outlook
8.5. South America Confectionery Processing Equipment Revenue (USD Million), by Country (2021-2032)
8.5.1. Brazil Confectionery Processing Equipment Regional Analysis and Outlook
8.5.2. Argentina Confectionery Processing Equipment Regional Analysis and Outlook
8.5.3. Rest of South America Confectionery Processing Equipment Regional Analysis and Outlook
8.6. Middle East and Africa Confectionery Processing Equipment Revenue (USD Million) by Country (2021-2032)
8.6.1. Middle East Confectionery Processing Equipment Regional Analysis and Outlook
8.6.2. Africa Confectionery Processing Equipment Regional Analysis and Outlook
Chapter 9. North America Confectionery Processing Equipment Analysis and Outlook
9.1. North America Confectionery Processing Equipment Revenue (USD Million) by Segments (2021-2032)
9.1.1. North America Confectionery Processing Equipment Revenue (USD Million) by Type (2021-2032)
9.1.2. North America Confectionery Processing Equipment Revenue (USD Million) by Application (2021-2032)
9.1.3. North America Confectionery Processing Equipment Revenue (USD Million) by Product (2021-2032)
By Product
Soft Confectionery
Hard Candies
Chewing Gums
Gummies & Jellies
Others
By Type
Thermal
Mixers
Blenders
Cutters
Extrusion
Cooling
Coating
Others
By Mode of Operation
Automatic
Semi-Automatic
Chapter 10. Europe Confectionery Processing Equipment Analysis and Outlook
10.1. Europe Confectionery Processing Equipment Revenue (USD Million), by Segments (USD Million) (2021-2032)
10.1.1. Europe Confectionery Processing Equipment Revenue (USD Million) by Type (2021-2032)
10.1.2. Europe Confectionery Processing Equipment Revenue (USD Million) by Application (2021-2032)
10.1.3. Europe Confectionery Processing Equipment Revenue (USD Million) by Product (2021-2032)
By Product
Soft Confectionery
Hard Candies
Chewing Gums
Gummies & Jellies
Others
By Type
Thermal
Mixers
Blenders
Cutters
Extrusion
Cooling
Coating
Others
By Mode of Operation
Automatic
Semi-Automatic
Chapter 11. Asia Pacific Confectionery Processing Equipment Analysis and Outlook
11.1. Asia Pacific Confectionery Processing Equipment Revenue (USD Million), and Revenue (USD Million) by Segments (2021-2032)
11.1.1. Asia Pacific Confectionery Processing Equipment Revenue (USD Million) by Type (2021-2032)
11.1.2. Asia Pacific Confectionery Processing Equipment Revenue (USD Million) by Application (2021-2032)
11.1.3. Asia Pacific Confectionery Processing Equipment Revenue (USD Million) by Product (2021-2032)
By Product
Soft Confectionery
Hard Candies
Chewing Gums
Gummies & Jellies
Others
By Type
Thermal
Mixers
Blenders
Cutters
Extrusion
Cooling
Coating
Others
By Mode of Operation
Automatic
Semi-Automatic
Chapter 12. South America Confectionery Processing Equipment Analysis and Outlook
12.1. South America Confectionery Processing Equipment Revenue (USD Million), by Segments (2021-2032)
12.1.1. South America Confectionery Processing Equipment Revenue (USD Million) by Type (2021-2032)
12.1.2. South America Confectionery Processing Equipment Revenue (USD Million) by Application (2021-2032)
12.1.3. South America Confectionery Processing Equipment Revenue (USD Million) by Product (2021-2032)
By Product
Soft Confectionery
Hard Candies
Chewing Gums
Gummies & Jellies
Others
By Type
Thermal
Mixers
Blenders
Cutters
Extrusion
Cooling
Coating
Others
By Mode of Operation
Automatic
Semi-Automatic
Chapter 13. Middle East and Africa Confectionery Processing Equipment Analysis and Outlook
13.1. Middle East and Africa Confectionery Processing Equipment Revenue (USD Million), by Segments (2021-2032)
13.1.1. Middle East and Africa Confectionery Processing Equipment Revenue (USD Million) by Type (2021-2032)
13.1.2. Middle East and Africa Confectionery Processing Equipment Revenue (USD Million) by Application (2021-2032)
13.1.3. Middle East and Africa Confectionery Processing Equipment Revenue (USD Million) by Product (2021-2032)
By Product
Soft Confectionery
Hard Candies
Chewing Gums
Gummies & Jellies
Others
By Type
Thermal
Mixers
Blenders
Cutters
Extrusion
Cooling
Coating
Others
By Mode of Operation
Automatic
Semi-Automatic
Chapter 14. Confectionery Processing Equipment Company Profiles
14.1 Business Overview
14.2 Product Profiles
14.3 SWOT Profiles
14.5 Recent Developments
14.6 Financial Profile
List of Companies
Alfa Laval AB
Baker Perkins Ltd
Buhler AG
GEA Group AG
Heat and Control Inc
JBT Corp
Rieckermann GmbH
Robert Bosch GmbH
Tanis Confectionery
15. Methodology and Data Sources
15.1 Customization Offerings
15.2 Subscription Services
15.3 Related Reports
15.4 Publisher Expertise
LIST OF TABLES
Table 1 Market Segmentation Analysis
Table 2 Global Confectionery Processing Equipment Market Share of Leading Companies, 2023
Table 3 Product Offerings of Leading Companies
Table 4 Low Growth Scenario Forecasts
Table 5 Reference Case Growth Scenario
Table 6 High Growth Case Scenario
Table 7 Global Confectionery Processing Equipment Revenue (USD Million) And CAGR (%) By Type (2021-2032)
Table 8 Global Confectionery Processing Equipment Revenue (USD Million) And CAGR (%) By Application (2021-2032)
Table 9 Global Confectionery Processing Equipment Revenue (USD Million) And CAGR (%) By Product (2021-2032)
Table 10 Global Confectionery Processing Equipment Market Revenue (USD Million) By Regions (2021-2032)
Table 11 Global Confectionery Processing Equipment Market Share (%) By Regions (2021-2032)
Table 12 North America Confectionery Processing Equipment Revenue (USD Million) By Country (2021-2032)
Table 13 Europe Confectionery Processing Equipment Revenue (USD Million) By Country (2021-2032)
Table 14 Asia Pacific Confectionery Processing Equipment Revenue (USD Million) By Country (2021-2032)
Table 15 South America Confectionery Processing Equipment Revenue (USD Million) By Country (2021-2032)
Table 16 Middle East and Africa Confectionery Processing Equipment Revenue (USD Million) By Region (2021-2032)
Table 17 North America Confectionery Processing Equipment Revenue (USD Million) By Type (2021-2032)
Table 18 North America Confectionery Processing Equipment Revenue (USD Million) By Application (2021-2032)
Table 19 North America Confectionery Processing Equipment Revenue (USD Million) By Product (2021-2032)
Table 20 Europe Confectionery Processing Equipment Revenue (USD Million) By Type (2021-2032)
Table 21 Europe Confectionery Processing Equipment Revenue (USD Million) By Application (2021-2032)
Table 22 Europe Confectionery Processing Equipment Revenue (USD Million) By Product (2021-2032)
Table 23 Asia Pacific Confectionery Processing Equipment Revenue (USD Million) By Type (2021-2032)
Table 24 Asia Pacific Confectionery Processing Equipment Revenue (USD Million) By Application (2021-2032)
Table 25 Asia Pacific Confectionery Processing Equipment Revenue (USD Million) By Product (2021-2032)
Table 26 South America Confectionery Processing Equipment Revenue (USD Million) By Type (2021-2032)
Table 27 South America Confectionery Processing Equipment Revenue (USD Million) By Application (2021-2032)
Table 28 South America Confectionery Processing Equipment Revenue (USD Million) By Product (2021-2032)
Table 29 Middle East and Africa Confectionery Processing Equipment Revenue (USD Million) By Type (2021-2032)
Table 30 Middle East and Africa Confectionery Processing Equipment Revenue (USD Million) By Application (2021-2032)
Table 31 Middle East and Africa Confectionery Processing Equipment Revenue (USD Million) By Product (2021-2032)
LIST OF FIGURES
Figure 1. Market Scope
Figure 2. Pricing Forecasts Per Unit, 2023- 2032
Figure 3. Porter’s Five Forces
Figure 4. Global Confectionery Processing Equipment Market Revenue (USD Million) By Regions (2021-2032)
Figure 5. Global Confectionery Processing Equipment Market Share (%) By Regions (2023)
Figure 6. North America Confectionery Processing Equipment Revenue (USD Million) By Country (2021-2032)
Figure 7. United States Confectionery Processing Equipment Revenue (USD Million) By Country (2021-2032)
Figure 8. Canada Confectionery Processing Equipment Revenue (USD Million) By Country (2021-2032)
Figure 9. Mexico Confectionery Processing Equipment Revenue (USD Million) By Country (2021-2032)
Figure 10. Europe Confectionery Processing Equipment Revenue (USD Million) By Country (2021-2032)
Figure 11. Germany Confectionery Processing Equipment Revenue (USD Million) By Country (2021-2032)
Figure 12. France Confectionery Processing Equipment Revenue (USD Million) By Country (2021-2032)
Figure 13. United Kingdom Confectionery Processing Equipment Revenue (USD Million) By Country (2021-2032)
Figure 14. Spain Confectionery Processing Equipment Revenue (USD Million) By Country (2021-2032)
Figure 15. Italy Confectionery Processing Equipment Revenue (USD Million) By Country (2021-2032)
Figure 16. Russia Confectionery Processing Equipment Revenue (USD Million) By Country (2021-2032)
Figure 17. Rest of Europe Confectionery Processing Equipment Revenue (USD Million) By Country (2021-2032)
Figure 11. Asia Pacific Confectionery Processing Equipment Revenue (USD Million) By Country (2021-2032)
Figure 12. China Confectionery Processing Equipment Revenue (USD Million) By Country (2021-2032)
Figure 13. Japan Confectionery Processing Equipment Revenue (USD Million) By Country (2021-2032)
Figure 14. India Confectionery Processing Equipment Revenue (USD Million) By Country (2021-2032)
Figure 15. South Korea Confectionery Processing Equipment Revenue (USD Million) By Country (2021-2032)
Figure 16. Australia Confectionery Processing Equipment Revenue (USD Million) By Country (2021-2032)
Figure 17. South East Asia Confectionery Processing Equipment Revenue (USD Million) By Country (2021-2032)
Figure 18. South America Confectionery Processing Equipment Revenue (USD Million) By Country (2021-2032)
Figure 19. Brazil Confectionery Processing Equipment Revenue (USD Million) By Country (2021-2032)
Figure 20. Argentina Confectionery Processing Equipment Revenue (USD Million) By Country (2021-2032)
Figure 21. Rest of Asia Pacific Confectionery Processing Equipment Revenue (USD Million) By Country (2021-2032)
Figure 22. Middle East and Africa Confectionery Processing Equipment Revenue (USD Million) By Region (2021-2032)
Figure 23. Saudi Arabia Confectionery Processing Equipment Revenue (USD Million) By Region (2021-2032)
Figure 24. The UAE Confectionery Processing Equipment Revenue (USD Million) By Region (2021-2032)
Figure 25. Rest of Middle East Confectionery Processing Equipment Revenue (USD Million) By Region (2021-2032)
Figure 26. South Africa Confectionery Processing Equipment Revenue (USD Million) By Region (2021-2032)
Figure 27. Africa Confectionery Processing Equipment Revenue (USD Million) By Region (2021-2032)
Figure 28. North America Confectionery Processing Equipment Revenue (USD Million) By Type (2021-2032)
Figure 29. North America Confectionery Processing Equipment Revenue (USD Million) By Application (2021-2032)
Figure 30. North America Confectionery Processing Equipment Revenue (USD Million) By Product (2021-2032)
Figure 31. Europe Confectionery Processing Equipment Revenue (USD Million) By Type (2021-2032)
Figure 32. Europe Confectionery Processing Equipment Revenue (USD Million) By Application (2021-2032)
Figure 33. Europe Confectionery Processing Equipment Revenue (USD Million) By Product (2021-2032)
Figure 34. Asia Pacific Confectionery Processing Equipment Revenue (USD Million) By Type (2021-2032)
Figure 35. Asia Pacific Confectionery Processing Equipment Revenue (USD Million) By Application (2021-2032)
Figure 36. Asia Pacific Confectionery Processing Equipment Revenue (USD Million) By Product (2021-2032)
Figure 37. South America Confectionery Processing Equipment Revenue (USD Million) By Type (2021-2032)
Figure 38. South America Confectionery Processing Equipment Revenue (USD Million) By Application (2021-2032)
Figure 39. South America Confectionery Processing Equipment Revenue (USD Million) By Product (2021-2032)
Figure 40. Middle East and Africa Confectionery Processing Equipment Revenue (USD Million) By Type (2021-2032)
Figure 41. Middle East and Africa Confectionery Processing Equipment Revenue (USD Million) By Application (2021-2032)
Figure 42. Middle East and Africa Confectionery Processing Equipment Revenue (USD Million) By Product (2021-2032)
By Product
Soft Confectionery
Hard Candies
Chewing Gums
Gummies & Jellies
Others
By Type
Thermal
Mixers
Blenders
Cutters
Extrusion
Cooling
Coating
Others
By Mode of Operation
Automatic
Semi-Automatic
Countries Analyzed
North America (US, Canada, Mexico)
Europe (Germany, UK, France, Spain, Italy, Russia, Rest of Europe)
Asia Pacific (China, India, Japan, South Korea, Australia, South East Asia, Rest of Asia)
South America (Brazil, Argentina, Rest of South America)
Middle East and Africa (Saudi Arabia, UAE, Rest of Middle East, South Africa, Egypt, Rest of Africa)
