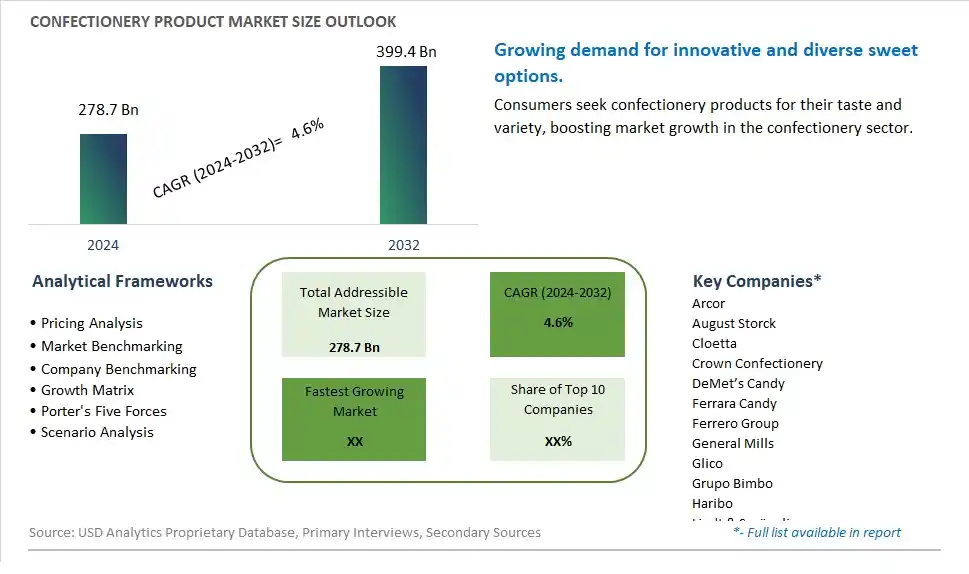
Global Confectionery Product Market Size is valued at $278.7 Billion in 2024 and is forecast to register a growth rate (CAGR) of 4.6% to reach $399.4 Billion by 2032.
The global Confectionery Product Market Comprehensive Study analyzes and forecasts the market size across 6 regions and 24 countries for diverse segments -By Type (Hard Confectionery Product, Soft Confectionery Product), By Sales Channel (Online, Offline)
An Introduction to Confectionery Product Market
In 2024, the Confectionery Product market is witnessing significant growth, driven by the increasing demand for a diverse range of sweets and snacks. Confectionery products, including chocolates, candies, gums, and mints, are valued for their wide variety of flavors, textures, and forms. The market is supported by the growing trend towards premium and innovative confections. Advances in formulation and production technologies are enhancing the quality, flavor, and shelf life of confectionery products. The market is also benefiting from the trend towards clean-label and natural ingredients, appealing to consumers seeking high-quality and enjoyable confectionery experiences.
Confectionery Product Competitive Landscape
The market report analyses the leading companies in the industry including Arcor, August Storck, Cloetta, Crown Confectionery, DeMet’s Candy, Ferrara Candy, Ferrero Group, General Mills, Glico, Grupo Bimbo, Haribo, Lindt & Sprüngli, LOTTE Confectionery, Mars Inc, Meiji Co. Ltd, Mondeléz, Morinaga, Nestlé S.A., Orion, Perfetti Van Melle, Storck, The Hershey Company, United Confectioners, Yildiz, and Others.
Confectionery Product Market Dynamics
Confectionery Product Market Trend: Innovation in Flavor and Texture
One prominent market trend in the Confectionery Product market is the continuous innovation in flavor and texture. Consumers are increasingly looking for unique and exciting taste experiences, leading manufacturers to develop new flavor profiles, combinations, and textures in their confectionery offerings. This trend is driven by the demand for novelty and variety, as well as the influence of global culinary trends shaping consumer preferences in the confectionery sector.
Confectionery Product Market Driver: Consumer Demand for Premium and Artisanal Confectionery
The market driver for Confectionery Products is the growing consumer demand for premium and artisanal confectionery items. Consumers are willing to pay a premium for high-quality ingredients, craftsmanship, and unique flavor combinations in their sweets and treats. This demand is fueled by the desire for indulgence, gifting, and special occasions, driving manufacturers to focus on creating upscale confectionery products that cater to these preferences.
Confectionery Product Market Opportunity: Health-Conscious Confectionery Offerings
An opportunity within the Confectionery Product market lies in the development of health-conscious offerings. With an increasing focus on health and wellness, consumers are seeking confectionery products that align with their dietary preferences and lifestyle choices. Manufacturers can capitalize on this trend by introducing healthier alternatives such as sugar-free, low-calorie, organic, and natural ingredient-based confectionery products. Additionally, incorporating functional ingredients like probiotics, vitamins, and antioxidants can appeal to health-conscious consumers looking for guilt-free indulgence options. This approach not only meets consumer demand for healthier choices but also opens up new market segments and enhances brand loyalty.
Confectionery Product Market Share Analysis: Hard Confectionery Product segment generated the highest revenue share in the industry
The Hard Confectionery Product segment is the largest in the Confectionery Product Market by type. This segment's dominance is driven by its wide appeal and long shelf life, making it a staple in the confectionery industry. Hard confectionery products, such as candies, lollipops, and mints, are popular across all age groups due to their variety of flavors, colors, and shapes. These products are often associated with nostalgia and tradition, further enhancing their appeal. Additionally, hard confectionery items are convenient for both consumers and retailers; they are easy to store, transport, and display, leading to extensive distribution through various retail channels, including supermarkets, convenience stores, and vending machines. The durability and stability of hard confectionery products make them ideal for bulk purchasing and long-term storage, which is particularly appealing to both individual consumers and businesses. The segment also benefits from continuous innovation in flavor combinations, packaging, and health-oriented variations, such as sugar-free options, which cater to diverse consumer preferences and dietary needs. As a result, the hard confectionery product segment maintains its leading position in the market due to its broad consumer base, convenience, and continuous innovation.
Confectionery Product Market Share Analysis: Online is the fastest growing segment over the forecast period to 2032
The Online segment is projected to be the fastest-growing sales channel in the Confectionery Product Market by 2032. This rapid growth is driven by the increasing consumer preference for the convenience and variety offered by online shopping platforms. The shift towards e-commerce has been accelerated by the Past few years, which prompted many consumers to adopt online shopping as a safer alternative to visiting physical stores. Online platforms provide a vast selection of confectionery products, including niche and specialty items that might not be available in traditional retail outlets, catering to diverse consumer tastes and preferences. Additionally, the ability to compare products, read customer reviews, and access detailed product information enhances the shopping experience, making it easier for consumers to make informed purchasing decisions. The rise of direct-to-consumer (DTC) brands and the expansion of major e-commerce platforms have also contributed to the growth of the online segment. Subscription services, personalized recommendations, and frequent promotional offers further entice consumers to buy confectionery products online. Furthermore, advancements in logistics and delivery services ensure that products reach consumers quickly and in excellent condition. As a result, the online segment is set to experience robust growth, driven by convenience, variety, and the evolving digital landscape.
Confectionery Product Market Segmentation
By Type
Hard Confectionery Product
Soft Confectionery Product
By Sales Channel
Online
Offline
Countries Analyzed
North America (US, Canada, Mexico)
Europe (Germany, UK, France, Spain, Italy, Russia, Rest of Europe)
Asia Pacific (China, India, Japan, South Korea, Australia, South East Asia, Rest of Asia)
South America (Brazil, Argentina, Rest of South America)
Middle East and Africa (Saudi Arabia, UAE, Rest of Middle East, South Africa, Egypt, Rest of Africa)
Confectionery Product Companies Profiled in the Study
Arcor
August Storck
Cloetta
Crown Confectionery
DeMet’s Candy
Ferrara Candy
Ferrero Group
General Mills
Glico
Grupo Bimbo
Haribo
Lindt & Sprüngli
LOTTE Confectionery
Mars Inc
Meiji Co. Ltd
Mondeléz
Morinaga
Nestlé S.A.
Orion
Perfetti Van Melle
Storck
The Hershey Company
United Confectioners
Yildiz
*- List Not Exhaustive
Chapter 1. TABLE OF CONTENTS
Chapter 2. Introduction to Confectionery Product Market
2.1. Market Overview
2.2. Key Statistics and Report Highlights
2.3. Scope of the Comprehensive Study
2.3.1. Market Definition
2.3.2 Countries and Regions Covered
2.3.3 Research Objective
2.3.4 Units, Currency, and Conversions
2.3.5 Industry Value Chain
2.4. Key Market Segments
2.5. Key Companies
2.6. Study Period
Chapter 3. Strategic Analysis Review
3.1. Confectionery Product Pricing Analysis and Forecast
3.2. Porter’s Five Forces
3.3. Market Ecosystem
3.4. SWOT Analysis
3.5. Regulatory Scenario
3.3. Effects of Inflation, Russia-Ukraine War, moderating economic growth, and other macroeconomic factors
Chapter 4. Competitive Landscape
4.1. Market Share Analysis
4.1.1. Global Confectionery Product Market Share by Company, 2023
4.1.2. Product Offerings of Leading Confectionery Product Companies
4.2. Market Entropy
4.2.1. New Product Launches in the Industry
4.2.2. Mergers, Acquisitions, Joint ventures, and Partnerships
4.3. Key Strategies and Best Practices
Chapter 5. Global Market Projections: Best, Reference, and Low Case Scenarios
5.1. Growth Analysis- Case Scenario Definitions
5.2. Low Growth Case Scenario Forecasts
5.3. Reference Growth Case Scenario Forecasts
5.4. High Growth Case Scenario Forecasts
Chapter 6. Market Dynamics
6.1. Confectionery Product Market Drivers
6.2. Confectionery Product Market Challenges
6.6. Confectionery Product Market Opportunities
6.4. Confectionery Product Market Trends
Chapter 7. Global Confectionery Product Market Outlook Trends
7.1. Global Confectionery Product Revenue (USD Million) and CAGR (%) by Type (2021-2032)
7.2. Global Confectionery Product Revenue (USD Million) and CAGR (%) by Application (2021-2032)
7.3. Global Confectionery Product Revenue (USD Million) and CAGR (%) by Product (2021-2032)
By Type
Hard Confectionery Product
Soft Confectionery Product
By Sales Channel
Online
Offline
Chapter 8. Global Confectionery Product Regional Analysis and Outlook
8.1. Global Confectionery Product Revenue (USD Million) By Regions (2021- 2032)
8.2. North America Confectionery Product Revenue (USD Million) by Country (2021-2032)
8.2.1. United States Confectionery Product Regional Analysis and Outlook
8.2.2. Canada Confectionery Product Regional Analysis and Outlook
8.2.3. Mexico Confectionery Product Regional Analysis and Outlook
8.3. Europe Confectionery Product Revenue (USD Million), by Country (2021-2032)
8.3.1. Germany Confectionery Product Regional Analysis and Outlook
8.3.2. France Confectionery Product Regional Analysis and Outlook
8.3.3. United Kingdom Confectionery Product Regional Analysis and Outlook
8.3.4. Spain Confectionery Product Regional Analysis and Outlook
8.3.5. Italy Confectionery Product Regional Analysis and Outlook
8.3.6. Russia Confectionery Product Regional Analysis and Outlook
8.3.7. Rest of Europe Confectionery Product Regional Analysis and Outlook
8.4. Asia Pacific Confectionery Product Revenue (USD Million) by Country (2021-2032)
8.4.1. China Confectionery Product Regional Analysis and Outlook
8.4.2. Japan Confectionery Product Regional Analysis and Outlook
8.4.3. India Confectionery Product Regional Analysis and Outlook
8.4.4. South Korea Confectionery Product Regional Analysis and Outlook
8.4.5. Australia Confectionery Product Regional Analysis and Outlook
8.4.6. South East Asia Confectionery Product Regional Analysis and Outlook
8.4.7. Rest of Asia Pacific Confectionery Product Regional Analysis and Outlook
8.5. South America Confectionery Product Revenue (USD Million), by Country (2021-2032)
8.5.1. Brazil Confectionery Product Regional Analysis and Outlook
8.5.2. Argentina Confectionery Product Regional Analysis and Outlook
8.5.3. Rest of South America Confectionery Product Regional Analysis and Outlook
8.6. Middle East and Africa Confectionery Product Revenue (USD Million) by Country (2021-2032)
8.6.1. Middle East Confectionery Product Regional Analysis and Outlook
8.6.2. Africa Confectionery Product Regional Analysis and Outlook
Chapter 9. North America Confectionery Product Analysis and Outlook
9.1. North America Confectionery Product Revenue (USD Million) by Segments (2021-2032)
9.1.1. North America Confectionery Product Revenue (USD Million) by Type (2021-2032)
9.1.2. North America Confectionery Product Revenue (USD Million) by Application (2021-2032)
9.1.3. North America Confectionery Product Revenue (USD Million) by Product (2021-2032)
By Type
Hard Confectionery Product
Soft Confectionery Product
By Sales Channel
Online
Offline
Chapter 10. Europe Confectionery Product Analysis and Outlook
10.1. Europe Confectionery Product Revenue (USD Million), by Segments (USD Million) (2021-2032)
10.1.1. Europe Confectionery Product Revenue (USD Million) by Type (2021-2032)
10.1.2. Europe Confectionery Product Revenue (USD Million) by Application (2021-2032)
10.1.3. Europe Confectionery Product Revenue (USD Million) by Product (2021-2032)
By Type
Hard Confectionery Product
Soft Confectionery Product
By Sales Channel
Online
Offline
Chapter 11. Asia Pacific Confectionery Product Analysis and Outlook
11.1. Asia Pacific Confectionery Product Revenue (USD Million), and Revenue (USD Million) by Segments (2021-2032)
11.1.1. Asia Pacific Confectionery Product Revenue (USD Million) by Type (2021-2032)
11.1.2. Asia Pacific Confectionery Product Revenue (USD Million) by Application (2021-2032)
11.1.3. Asia Pacific Confectionery Product Revenue (USD Million) by Product (2021-2032)
By Type
Hard Confectionery Product
Soft Confectionery Product
By Sales Channel
Online
Offline
Chapter 12. South America Confectionery Product Analysis and Outlook
12.1. South America Confectionery Product Revenue (USD Million), by Segments (2021-2032)
12.1.1. South America Confectionery Product Revenue (USD Million) by Type (2021-2032)
12.1.2. South America Confectionery Product Revenue (USD Million) by Application (2021-2032)
12.1.3. South America Confectionery Product Revenue (USD Million) by Product (2021-2032)
By Type
Hard Confectionery Product
Soft Confectionery Product
By Sales Channel
Online
Offline
Chapter 13. Middle East and Africa Confectionery Product Analysis and Outlook
13.1. Middle East and Africa Confectionery Product Revenue (USD Million), by Segments (2021-2032)
13.1.1. Middle East and Africa Confectionery Product Revenue (USD Million) by Type (2021-2032)
13.1.2. Middle East and Africa Confectionery Product Revenue (USD Million) by Application (2021-2032)
13.1.3. Middle East and Africa Confectionery Product Revenue (USD Million) by Product (2021-2032)
By Type
Hard Confectionery Product
Soft Confectionery Product
By Sales Channel
Online
Offline
Chapter 14. Confectionery Product Company Profiles
14.1 Business Overview
14.2 Product Profiles
14.3 SWOT Profiles
14.5 Recent Developments
14.6 Financial Profile
List of Companies
Arcor
August Storck
Cloetta
Crown Confectionery
DeMet’s Candy
Ferrara Candy
Ferrero Group
General Mills
Glico
Grupo Bimbo
Haribo
Lindt & Sprüngli
LOTTE Confectionery
Mars Inc
Meiji Co. Ltd
Mondeléz
Morinaga
Nestlé S.A.
Orion
Perfetti Van Melle
Storck
The Hershey Company
United Confectioners
Yildiz
15. Methodology and Data Sources
15.1 Customization Offerings
15.2 Subscription Services
15.3 Related Reports
15.4 Publisher Expertise
LIST OF TABLES
Table 1 Market Segmentation Analysis
Table 2 Global Confectionery Product Market Share of Leading Companies, 2023
Table 3 Product Offerings of Leading Companies
Table 4 Low Growth Scenario Forecasts
Table 5 Reference Case Growth Scenario
Table 6 High Growth Case Scenario
Table 7 Global Confectionery Product Revenue (USD Million) And CAGR (%) By Type (2021-2032)
Table 8 Global Confectionery Product Revenue (USD Million) And CAGR (%) By Application (2021-2032)
Table 9 Global Confectionery Product Revenue (USD Million) And CAGR (%) By Product (2021-2032)
Table 10 Global Confectionery Product Market Revenue (USD Million) By Regions (2021-2032)
Table 11 Global Confectionery Product Market Share (%) By Regions (2021-2032)
Table 12 North America Confectionery Product Revenue (USD Million) By Country (2021-2032)
Table 13 Europe Confectionery Product Revenue (USD Million) By Country (2021-2032)
Table 14 Asia Pacific Confectionery Product Revenue (USD Million) By Country (2021-2032)
Table 15 South America Confectionery Product Revenue (USD Million) By Country (2021-2032)
Table 16 Middle East and Africa Confectionery Product Revenue (USD Million) By Region (2021-2032)
Table 17 North America Confectionery Product Revenue (USD Million) By Type (2021-2032)
Table 18 North America Confectionery Product Revenue (USD Million) By Application (2021-2032)
Table 19 North America Confectionery Product Revenue (USD Million) By Product (2021-2032)
Table 20 Europe Confectionery Product Revenue (USD Million) By Type (2021-2032)
Table 21 Europe Confectionery Product Revenue (USD Million) By Application (2021-2032)
Table 22 Europe Confectionery Product Revenue (USD Million) By Product (2021-2032)
Table 23 Asia Pacific Confectionery Product Revenue (USD Million) By Type (2021-2032)
Table 24 Asia Pacific Confectionery Product Revenue (USD Million) By Application (2021-2032)
Table 25 Asia Pacific Confectionery Product Revenue (USD Million) By Product (2021-2032)
Table 26 South America Confectionery Product Revenue (USD Million) By Type (2021-2032)
Table 27 South America Confectionery Product Revenue (USD Million) By Application (2021-2032)
Table 28 South America Confectionery Product Revenue (USD Million) By Product (2021-2032)
Table 29 Middle East and Africa Confectionery Product Revenue (USD Million) By Type (2021-2032)
Table 30 Middle East and Africa Confectionery Product Revenue (USD Million) By Application (2021-2032)
Table 31 Middle East and Africa Confectionery Product Revenue (USD Million) By Product (2021-2032)
LIST OF FIGURES
Figure 1. Market Scope
Figure 2. Pricing Forecasts Per Unit, 2023- 2032
Figure 3. Porter’s Five Forces
Figure 4. Global Confectionery Product Market Revenue (USD Million) By Regions (2021-2032)
Figure 5. Global Confectionery Product Market Share (%) By Regions (2023)
Figure 6. North America Confectionery Product Revenue (USD Million) By Country (2021-2032)
Figure 7. United States Confectionery Product Revenue (USD Million) By Country (2021-2032)
Figure 8. Canada Confectionery Product Revenue (USD Million) By Country (2021-2032)
Figure 9. Mexico Confectionery Product Revenue (USD Million) By Country (2021-2032)
Figure 10. Europe Confectionery Product Revenue (USD Million) By Country (2021-2032)
Figure 11. Germany Confectionery Product Revenue (USD Million) By Country (2021-2032)
Figure 12. France Confectionery Product Revenue (USD Million) By Country (2021-2032)
Figure 13. United Kingdom Confectionery Product Revenue (USD Million) By Country (2021-2032)
Figure 14. Spain Confectionery Product Revenue (USD Million) By Country (2021-2032)
Figure 15. Italy Confectionery Product Revenue (USD Million) By Country (2021-2032)
Figure 16. Russia Confectionery Product Revenue (USD Million) By Country (2021-2032)
Figure 17. Rest of Europe Confectionery Product Revenue (USD Million) By Country (2021-2032)
Figure 11. Asia Pacific Confectionery Product Revenue (USD Million) By Country (2021-2032)
Figure 12. China Confectionery Product Revenue (USD Million) By Country (2021-2032)
Figure 13. Japan Confectionery Product Revenue (USD Million) By Country (2021-2032)
Figure 14. India Confectionery Product Revenue (USD Million) By Country (2021-2032)
Figure 15. South Korea Confectionery Product Revenue (USD Million) By Country (2021-2032)
Figure 16. Australia Confectionery Product Revenue (USD Million) By Country (2021-2032)
Figure 17. South East Asia Confectionery Product Revenue (USD Million) By Country (2021-2032)
Figure 18. South America Confectionery Product Revenue (USD Million) By Country (2021-2032)
Figure 19. Brazil Confectionery Product Revenue (USD Million) By Country (2021-2032)
Figure 20. Argentina Confectionery Product Revenue (USD Million) By Country (2021-2032)
Figure 21. Rest of Asia Pacific Confectionery Product Revenue (USD Million) By Country (2021-2032)
Figure 22. Middle East and Africa Confectionery Product Revenue (USD Million) By Region (2021-2032)
Figure 23. Saudi Arabia Confectionery Product Revenue (USD Million) By Region (2021-2032)
Figure 24. The UAE Confectionery Product Revenue (USD Million) By Region (2021-2032)
Figure 25. Rest of Middle East Confectionery Product Revenue (USD Million) By Region (2021-2032)
Figure 26. South Africa Confectionery Product Revenue (USD Million) By Region (2021-2032)
Figure 27. Africa Confectionery Product Revenue (USD Million) By Region (2021-2032)
Figure 28. North America Confectionery Product Revenue (USD Million) By Type (2021-2032)
Figure 29. North America Confectionery Product Revenue (USD Million) By Application (2021-2032)
Figure 30. North America Confectionery Product Revenue (USD Million) By Product (2021-2032)
Figure 31. Europe Confectionery Product Revenue (USD Million) By Type (2021-2032)
Figure 32. Europe Confectionery Product Revenue (USD Million) By Application (2021-2032)
Figure 33. Europe Confectionery Product Revenue (USD Million) By Product (2021-2032)
Figure 34. Asia Pacific Confectionery Product Revenue (USD Million) By Type (2021-2032)
Figure 35. Asia Pacific Confectionery Product Revenue (USD Million) By Application (2021-2032)
Figure 36. Asia Pacific Confectionery Product Revenue (USD Million) By Product (2021-2032)
Figure 37. South America Confectionery Product Revenue (USD Million) By Type (2021-2032)
Figure 38. South America Confectionery Product Revenue (USD Million) By Application (2021-2032)
Figure 39. South America Confectionery Product Revenue (USD Million) By Product (2021-2032)
Figure 40. Middle East and Africa Confectionery Product Revenue (USD Million) By Type (2021-2032)
Figure 41. Middle East and Africa Confectionery Product Revenue (USD Million) By Application (2021-2032)
Figure 42. Middle East and Africa Confectionery Product Revenue (USD Million) By Product (2021-2032)
By Type
Hard Confectionery Product
Soft Confectionery Product
By Sales Channel
Online
Offline
Countries Analyzed
North America (US, Canada, Mexico)
Europe (Germany, UK, France, Spain, Italy, Russia, Rest of Europe)
Asia Pacific (China, India, Japan, South Korea, Australia, South East Asia, Rest of Asia)
South America (Brazil, Argentina, Rest of South America)
Middle East and Africa (Saudi Arabia, UAE, Rest of Middle East, South Africa, Egypt, Rest of Africa)
