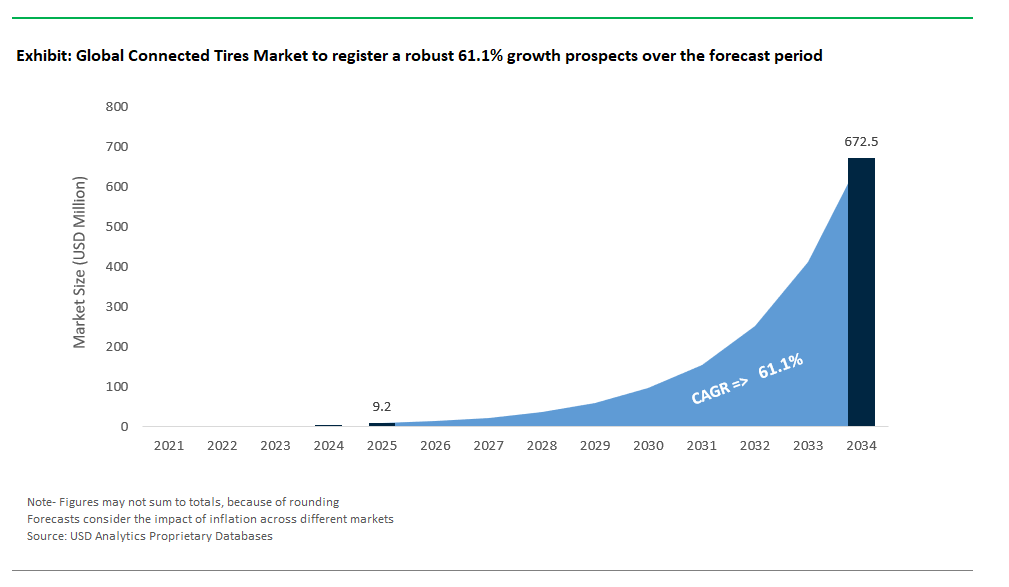
The Global Connected Tires Market Size is estimated at $9.2 Million in 2025 and is forecast to register an annual growth rate (CAGR) of 61.1% to reach $671.2 Million by 2034.
The global Connected Tires Market Study analyzes and forecasts the market size across 6 regions and 24 countries for diverse segments -By Offering (Hardware, Software), By Propulsion (Electric, ICE), By Rim Size (12 to 17 Inches, 18 to 22 Inches, Above 22 Inches), By Sales Channel (OEM, Aftermarket), By Component (TPMS, Accelerometer sensors, Strain gauge sensors, RFID chips, Others), By Vehicle (Passenger Cars, Commercial Vehicles).
An Introduction to Connected Tires Market in 2025
The connected tires market is at the forefront of integrating smart technology into tire systems, enabling real-time data collection and communication to enhance vehicle performance and safety. Connected tires use sensors and wireless technology to monitor tire pressure, temperature, tread wear, and other critical parameters, providing valuable insights to both drivers and fleet operators. The market is driven by advancements in IoT technology, increasing demand for enhanced safety features, and the need for better fleet management solutions. Innovations in tire sensor technology, data analytics, and integration with vehicle systems are shaping market trends. As the automotive industry embraces digital transformation and connectivity, the connected tires market is set for substantial growth and development.
Connected Tires Competitive Landscape
The market report analyses the leading companies in the industry including Bridgestone, Continental AG, Goodyear, Hankook Tires, JK Tyre, Michelin, MRF, Nokian Tyres, Pirelli, Sumitomo Rubber Industries Ltd, Toyo Tires, Yokohama Rubber Co., and others.
Connected Tires Market Dynamics
Market Trend: Rise of Real-Time Data Analytics
The most prominent trend in the connected tires market is the rise of real-time data analytics facilitated by integrated sensors and connectivity features. Connected tires are equipped with advanced sensors that collect and transmit data regarding tire performance, including pressure, temperature, and tread wear. This data is analyzed in real-time to provide insights into tire condition and performance, enabling proactive maintenance and safety measures. The trend is driven by the increasing adoption of smart vehicle technologies and the demand for enhanced vehicle safety and operational efficiency. Real-time data analytics not only improve tire management but also contribute to the overall optimization of vehicle performance and safety, aligning with the broader shift towards data-driven decision-making in the automotive industry.
Market Driver: Growing Demand for Enhanced Vehicle Safety and Maintenance
The primary driver for the connected tires market is the growing demand for enhanced vehicle safety and maintenance capabilities. As vehicles become more advanced, there is a stronger emphasis on technologies that can monitor and improve vehicle safety. Connected tires provide crucial information that helps in preventing accidents caused by tire issues, such as blowouts or under-inflation. They also facilitate predictive maintenance by alerting drivers and fleet managers to potential tire problems before they lead to significant issues. This focus on safety and proactive maintenance is driving the adoption of connected tire technologies, which are seen as essential components in the evolving landscape of smart and connected vehicles.
Market Opportunity: Expansion in Fleet Management Solutions
A significant opportunity in the connected tires market lies in the expansion of fleet management solutions. As fleet operators seek to enhance efficiency, reduce operational costs, and improve safety, connected tire technology offers valuable benefits. By integrating connected tires into fleet management systems, operators can gain comprehensive insights into tire performance across their entire fleet, enabling them to optimize tire usage, reduce downtime, and extend tire life. This capability is particularly valuable for large fleets where managing tire performance and maintenance can be complex and costly. The growth in logistics, transportation, and delivery services further amplifies this opportunity, presenting a substantial market for connected tire solutions tailored to fleet management needs.
Connected Tires Market Share Analysis: Hardware generated the highest revenue in 2024
In the Connected Tires Market by offering, Hardware is the largest segment. This dominance is due to the fundamental role that hardware components play in the operation of connected tires. Hardware includes sensors and communication systems that monitor and transmit data regarding tire pressure, temperature, and wear. These components are essential for the functionality of connected tires, providing real-time information that enhances vehicle safety and performance. The critical nature of these hardware components in enabling the core features of connected tires—such as predictive maintenance and performance monitoring—ensures that they constitute the largest segment of the market.
Connected Tires Market Share Analysis: Electric is poised to register the fastest CAGR over the forecast period
In the Connected Tires Market by propulsion, Electric vehicles (EVs) represent the fastest growing segment. This rapid growth is driven by the increasing adoption of EVs and their unique requirements for advanced tire technologies. Electric vehicles, with their higher torque and different weight distribution compared to internal combustion engine (ICE) vehicles, demand specialized tire solutions to optimize performance and safety. Connected tires for EVs are particularly important as they provide critical data that helps manage the specific demands of electric propulsion, such as handling and efficiency. As the EV market expands, the demand for connected tires tailored to these vehicles is accelerating, making it the fastest growing segment.
Connected Tires Market Share Analysis: 18 to 22 Inches generated the highest revenue in 2024
In the Connected Tires Market by rim size, the 18 to 22 Inches segment is the largest. This size range covers a broad spectrum of vehicles, including SUVs, light trucks, and premium sedans, which commonly use larger rim sizes for improved performance and aesthetics. The prevalence of these vehicles on the road drives higher demand for connected tires in this rim size category. Larger rims are associated with higher performance and luxury vehicles, which often incorporate advanced technologies like connected tires. As a result, this segment holds the largest share of the market, reflecting its alignment with the vehicle types that typically require or benefit from connected tire technologies.
Connected Tires Market Share Analysis: OEM is poised to register the fastest CAGR over the forecast period
In the Connected Tires Market by sales channel, OEM (Original Equipment Manufacturer) is the fastest growing segment. This growth is primarily driven by the increasing integration of connected tire technologies into new vehicles directly from the manufacturer. As automakers increasingly adopt advanced technologies as standard features in new models, the demand for connected tires through OEM channels is rising rapidly. Manufacturers are incorporating connected tire systems into their vehicles to meet consumer expectations for enhanced safety and performance, which accelerates growth in the OEM segment. The shift towards more sophisticated, technology-integrated vehicles makes OEM the fastest growing sales channel for connected tires.
Connected Tires Market Report Scope
|
Parameter
|
Details
|
|
Market Size (2025)
|
$ 9.2 Million
|
|
Market Size (2034)
|
$ 671.2 Million
|
|
Market Growth Rate
|
61.1%
|
|
Segments
|
By Offering (Hardware, Software), By Propulsion (Electric, ICE), By Rim Size (12 to 17 Inches, 18 to 22 Inches, Above 22 Inches), By Sales Channel (OEM, Aftermarket), By Component (TPMS, Accelerometer sensors, Strain gauge sensors, RFID chips, Others), By Vehicle (Passenger Cars, Commercial Vehicles)
|
|
Study Period
|
2019- 2024 and 2025-2034
|
|
Units
|
Revenue (USD)
|
|
Qualitative Analysis
|
Porter’s Five Forces, SWOT Profile, Market Share, Scenario Forecasts, Market Ecosystem, Company Ranking, Market Dynamics, Industry Benchmarking
|
|
Companies
|
Bridgestone, Continental AG, Goodyear, Hankook Tires, JK Tyre, Michelin, MRF, Nokian Tyres, Pirelli, Sumitomo Rubber Industries Ltd, Toyo Tires, Yokohama Rubber Co.
|
|
Countries
|
US, Canada, Mexico, Germany, France, Spain, Italy, UK, Russia, China, India, Japan, South Korea, Australia, South East Asia, Brazil, Argentina, Middle East, Africa
|
Connected Tires Market Segmentation
By Offering
Hardware
Software
By Propulsion
Electric
ICE
By Rim Size
12 to 17 Inches
18 to 22 Inches
Above 22 Inches
By Sales Channel
OEM
Aftermarket
By Component
TPMS
Accelerometer sensors
Strain gauge sensors
RFID chips
Others
By Vehicle
Passenger Cars
Commercial Vehicles
Countries Analyzed
North America (US, Canada, Mexico)
Europe (Germany, UK, France, Spain, Italy, Russia, Rest of Europe)
Asia Pacific (China, India, Japan, South Korea, Australia, South East Asia, Rest of Asia)
South America (Brazil, Argentina, Rest of South America)
Middle East and Africa (Saudi Arabia, UAE, Rest of Middle East, South Africa, Egypt, Rest of Africa)
Connected Tires Companies Profiled in the Study
Bridgestone
Continental AG
Goodyear
Hankook Tires
JK Tyre
Michelin
MRF
Nokian Tyres
Pirelli
Sumitomo Rubber Industries Ltd
Toyo Tires
Yokohama Rubber Co.
*- List Not Exhaustive
About USD Analytics
Table of Contents
List of Charts and Exhibits
List of Tables
1. Executive Summary
What’s New in 2025?
Top 10 Takeaways from the industry
Potential Opportunities for Industry Stakeholders
Strategic Imperatives
Company Market Positioning
Industry Benchmarking Matrix
2. Research Scope and Methodology
Market Definition
Market Segments
Companies Profiled
Research Methodology
Bottom-Up Method
Top-Down Method
Data Triangulation
Forecast Methodology
Data Sources
USDA Proprietary Databases
External Sources
Primary Research and Interviews
Conversion Rates for USD
Abbreviations
3. Strategic Landscape: Key Insights and Implications
Spotlight: Key Strategies opted by Business Leaders
Competitive Landscape
Market Size ($ Million) and Share (%) by Company, 2024
SWOT Analysis
- Key Market Strengths
- Key Market Weaknesses
- Potential Opportunities
- Potential Threats
Porter’s Five Force Analysis
- Summary
- Bargaining Power of Buyers- Impact Analysis
- Bargaining Power of Suppliers- Impact Analysis
- Threat of new entrants- Impact Analysis
- Intensity of Competitive Rivalry- Impact Analysis
Macro-Environmental Analysis
- Economic forecasts by Country, 2010- 2035
- Population forecasts by Country, 2010- 2035
- Inflation Outlook by Country, 2010-2035
- Impact of Russia-Ukraine Conflict, Sluggish China Growth, US Developments
5. Growth Opportunity Analysis
Trends at a Glance
- What are the most noteworthy trends in the market
- Where should leaders pay attention?
- What industries are likely to be affected by the growth?
Market Dynamics
- Charting a path forward
- Growth Drivers
- Growth Barriers
Key Industry Stakeholders
- Suppliers
- Manufacturers and Service Providers
- Distribution Channels
- End-Users and Applications
- Regulators
- Investors, Traders, and R&D Institutes
Regulatory Landscape
6. Market Size Outlook to 2034
Global Nanocoatings Market Size Forecast, USD Million, 2018- 2034
- Historic Market Size, 2018- 2024
- Forecast Market Size, 2024- 2034
Scenario Analysis
- Low Growth Scenario: Definition and Outlook to 2034
- Reference Case: Definition and Outlook to 2034
- High Growth Scenario: Definition and Outlook to 2034
Pricing Analysis and Outlook
- Nanocoatings Average Price Forecast, 2021- 2034
- Key Factors Shaping the Pricing Patterns
7. Historical Nanocoatings Market Size by Segments, 2018- 2024
Key Statistics, 2024
Nanocoatings Market Size Outlook by Type, USD Million, 2018- 2024
Growth Comparison (y-o-y) across Nanocoatings Types, 2018- 2024
Nanocoatings Market Size Outlook by Application, USD Million, 2018- 2024
Growth Comparison (y-o-y) across Nanocoatings Applications, 2018- 2024
8. Nanocoatings Market Size Outlook by Segments, 2024- 2034
By Offering
Hardware
Software
By Propulsion
Electric
ICE
By Rim Size
12 to 17 Inches
18 to 22 Inches
Above 22 Inches
By Sales Channel
OEM
Aftermarket
By Component
TPMS
Accelerometer sensors
Strain gauge sensors
RFID chips
Others
By Vehicle
Passenger Cars
Commercial Vehicles
9. Nanocoatings Market Size Outlook by Region
North America
Key Market Dynamics
North America Nanocoatings Market Size Outlook by Type, USD Million, 2021-2034
North America Nanocoatings Market Size Outlook by Application, USD Million, 2021-2034
North America Nanocoatings Market Size Outlook by Sales Channel, USD Million, 2021-2034
North America Nanocoatings Market Size Outlook by Country, USD Million, 2021-2034
Europe
Key Market Dynamics
Europe Nanocoatings Market Size Outlook by Type, USD Million, 2021-2034
Europe Nanocoatings Market Size Outlook by Application, USD Million, 2021-2034
Europe Nanocoatings Market Size Outlook by Sales Channel, USD Million, 2021-2034
Europe Nanocoatings Market Size Outlook by Country, USD Million, 2021-2034
Asia Pacific
Key Market Dynamics
Asia Pacific Nanocoatings Market Size Outlook by Type, USD Million, 2021-2034
Asia Pacific Nanocoatings Market Size Outlook by Application, USD Million, 2021-2034
Asia Pacific Nanocoatings Market Size Outlook by Sales Channel, USD Million, 2021-2034
Asia Pacific Nanocoatings Market Size Outlook by Country, USD Million, 2021-2034
South America
Key Market Dynamics
South America Nanocoatings Market Size Outlook by Type, USD Million, 2021-2034
South America Nanocoatings Market Size Outlook by Application, USD Million, 2021-2034
South America Nanocoatings Market Size Outlook by Sales Channel, USD Million, 2021-2034
South America Nanocoatings Market Size Outlook by Country, USD Million, 2021-2034
Middle East and Africa
Key Market Dynamics
Middle East and Africa Nanocoatings Market Size Outlook by Type, USD Million, 2021-2034
Middle East and Africa Nanocoatings Market Size Outlook by Application, USD Million, 2021-2034
Middle East and Africa Nanocoatings Market Size Outlook by Sales Channel, USD Million, 2021-2034
Middle East and Africa Nanocoatings Market Size Outlook by Country, USD Million, 2021-2034
10. United States Nanocoatings Market Analysis and Outlook, 2021- 2034
Key Statistics
United States Nanocoatings Market Size Outlook by Type, 2021- 2034
United States Nanocoatings Market Size Outlook by Application, 2021- 2034
United States Nanocoatings Market Size Outlook by End-User, 2021- 2034
11. Canada Nanocoatings Market Analysis and Outlook, 2021- 2034
Key Statistics
Canada Nanocoatings Market Size Outlook by Type, 2021- 2034
Canada Nanocoatings Market Size Outlook by Application, 2021- 2034
Canada Nanocoatings Market Size Outlook by End-User, 2021- 2034
12. Mexico Nanocoatings Market Analysis and Outlook, 2021- 2034
Key Statistics
Mexico Nanocoatings Market Size Outlook by Type, 2021- 2034
Mexico Nanocoatings Market Size Outlook by Application, 2021- 2034
Mexico Nanocoatings Market Size Outlook by End-User, 2021- 2034
13. Germany Nanocoatings Market Analysis and Outlook, 2021- 2034
Key Statistics
Germany Nanocoatings Market Size Outlook by Type, 2021- 2034
Germany Nanocoatings Market Size Outlook by Application, 2021- 2034
Germany Nanocoatings Market Size Outlook by End-User, 2021- 2034
14. France Nanocoatings Market Analysis and Outlook, 2021- 2034
Key Statistics
France Nanocoatings Market Size Outlook by Type, 2021- 2034
France Nanocoatings Market Size Outlook by Application, 2021- 2034
France Nanocoatings Market Size Outlook by End-User, 2021- 2034
15. United Kingdom Nanocoatings Market Analysis and Outlook, 2021- 2034
Key Statistics
United Kingdom Nanocoatings Market Size Outlook by Type, 2021- 2034
United Kingdom Nanocoatings Market Size Outlook by Application, 2021- 2034
United Kingdom Nanocoatings Market Size Outlook by End-User, 2021- 2034
16. Spain Nanocoatings Market Analysis and Outlook, 2021- 2034
Key Statistics
Spain Nanocoatings Market Size Outlook by Type, 2021- 2034
Spain Nanocoatings Market Size Outlook by Application, 2021- 2034
Spain Nanocoatings Market Size Outlook by End-User, 2021- 2034
17. Italy Nanocoatings Market Analysis and Outlook, 2021- 2034
Key Statistics
Italy Nanocoatings Market Size Outlook by Type, 2021- 2034
Italy Nanocoatings Market Size Outlook by Application, 2021- 2034
Italy Nanocoatings Market Size Outlook by End-User, 2021- 2034
18. Benelux Nanocoatings Market Analysis and Outlook, 2021- 2034
Key Statistics
Benelux Nanocoatings Market Size Outlook by Type, 2021- 2034
Benelux Nanocoatings Market Size Outlook by Application, 2021- 2034
Benelux Nanocoatings Market Size Outlook by End-User, 2021- 2034
19. Nordic Nanocoatings Market Analysis and Outlook, 2021- 2034
Key Statistics
Nordic Nanocoatings Market Size Outlook by Type, 2021- 2034
Nordic Nanocoatings Market Size Outlook by Application, 2021- 2034
Nordic Nanocoatings Market Size Outlook by End-User, 2021- 2034
20. Rest of Europe Nanocoatings Market Analysis and Outlook, 2021- 2034
Key Statistics
Rest of Europe Nanocoatings Market Size Outlook by Type, 2021- 2034
Rest of Europe Nanocoatings Market Size Outlook by Application, 2021- 2034
Rest of Europe Nanocoatings Market Size Outlook by End-User, 2021- 2034
21. China Nanocoatings Market Analysis and Outlook, 2021- 2034
Key Statistics
China Nanocoatings Market Size Outlook by Type, 2021- 2034
China Nanocoatings Market Size Outlook by Application, 2021- 2034
China Nanocoatings Market Size Outlook by End-User, 2021- 2034
22. India Nanocoatings Market Analysis and Outlook, 2021- 2034
Key Statistics
India Nanocoatings Market Size Outlook by Type, 2021- 2034
India Nanocoatings Market Size Outlook by Application, 2021- 2034
India Nanocoatings Market Size Outlook by End-User, 2021- 2034
23. Japan Nanocoatings Market Analysis and Outlook, 2021- 2034
Key Statistics
Japan Nanocoatings Market Size Outlook by Type, 2021- 2034
Japan Nanocoatings Market Size Outlook by Application, 2021- 2034
Japan Nanocoatings Market Size Outlook by End-User, 2021- 2034
24. South Korea Nanocoatings Market Analysis and Outlook, 2021- 2034
Key Statistics
South Korea Nanocoatings Market Size Outlook by Type, 2021- 2034
South Korea Nanocoatings Market Size Outlook by Application, 2021- 2034
South Korea Nanocoatings Market Size Outlook by End-User, 2021- 2034
25. Australia Nanocoatings Market Analysis and Outlook, 2021- 2034
Key Statistics
Australia Nanocoatings Market Size Outlook by Type, 2021- 2034
Australia Nanocoatings Market Size Outlook by Application, 2021- 2034
Australia Nanocoatings Market Size Outlook by End-User, 2021- 2034
26. South East Asia Nanocoatings Market Analysis and Outlook, 2021- 2034
Key Statistics
South East Asia Nanocoatings Market Size Outlook by Type, 2021- 2034
South East Asia Nanocoatings Market Size Outlook by Application, 2021- 2034
South East Asia Nanocoatings Market Size Outlook by End-User, 2021- 2034
27. Rest of Asia Pacific Nanocoatings Market Analysis and Outlook, 2021- 2034
Key Statistics
Rest of Asia Pacific Nanocoatings Market Size Outlook by Type, 2021- 2034
Rest of Asia Pacific Nanocoatings Market Size Outlook by Application, 2021- 2034
Rest of Asia Pacific Nanocoatings Market Size Outlook by End-User, 2021- 2034
28. Brazil Nanocoatings Market Analysis and Outlook, 2021- 2034
Key Statistics
Brazil Nanocoatings Market Size Outlook by Type, 2021- 2034
Brazil Nanocoatings Market Size Outlook by Application, 2021- 2034
Brazil Nanocoatings Market Size Outlook by End-User, 2021- 2034
29. Argentina Nanocoatings Market Analysis and Outlook, 2021- 2034
Key Statistics
Argentina Nanocoatings Market Size Outlook by Type, 2021- 2034
Argentina Nanocoatings Market Size Outlook by Application, 2021- 2034
Argentina Nanocoatings Market Size Outlook by End-User, 2021- 2034
30. Rest of South America Nanocoatings Market Analysis and Outlook, 2021- 2034
Key Statistics
Rest of South America Nanocoatings Market Size Outlook by Type, 2021- 2034
Rest of South America Nanocoatings Market Size Outlook by Application, 2021- 2034
Rest of South America Nanocoatings Market Size Outlook by End-User, 2021- 2034
31. United Arab Emirates Nanocoatings Market Analysis and Outlook, 2021- 2034
Key Statistics
United Arab Emirates Nanocoatings Market Size Outlook by Type, 2021- 2034
United Arab Emirates Nanocoatings Market Size Outlook by Application, 2021- 2034
United Arab Emirates Nanocoatings Market Size Outlook by End-User, 2021- 2034
32. Saudi Arabia Nanocoatings Market Analysis and Outlook, 2021- 2034
Key Statistics
Saudi Arabia Nanocoatings Market Size Outlook by Type, 2021- 2034
Saudi Arabia Nanocoatings Market Size Outlook by Application, 2021- 2034
Saudi Arabia Nanocoatings Market Size Outlook by End-User, 2021- 2034
33. Rest of Middle East Nanocoatings Market Analysis and Outlook, 2021- 2034
Key Statistics
Rest of Middle East Nanocoatings Market Size Outlook by Type, 2021- 2034
Rest of Middle East Nanocoatings Market Size Outlook by Application, 2021- 2034
Rest of Middle East Nanocoatings Market Size Outlook by End-User, 2021- 2034
34. South Africa Nanocoatings Market Analysis and Outlook, 2021- 2034
Key Statistics
South Africa Nanocoatings Market Size Outlook by Type, 2021- 2034
South Africa Nanocoatings Market Size Outlook by Application, 2021- 2034
South Africa Nanocoatings Market Size Outlook by End-User, 2021- 2034
35. Rest of Africa Nanocoatings Market Analysis and Outlook, 2021- 2034
Key Statistics
Rest of Africa Nanocoatings Market Size Outlook by Type, 2021- 2034
Rest of Africa Nanocoatings Market Size Outlook by Application, 2021- 2034
Rest of Africa Nanocoatings Market Size Outlook by End-User, 2021- 2034
36. Key Companies
Market Share Analysis
Bridgestone
Continental AG
Goodyear
Hankook Tires
JK Tyre
Michelin
MRF
Nokian Tyres
Pirelli
Sumitomo Rubber Industries Ltd
Toyo Tires
Yokohama Rubber Co.
Company Benchmarking
Financial Analysis
37. Recent Market Developments
38. Appendix
Looking Ahead
Research Methodology
Legal Disclaimer
