
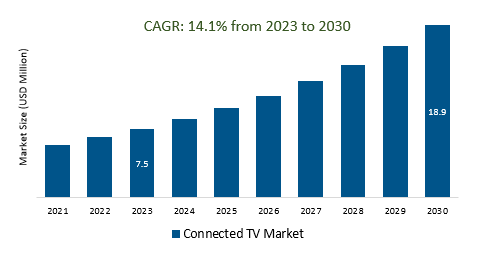
The Global Connected TV Market Size is estimated to be US 7.5 Billion in 2023 and is poised to register 14.1% growth over the forecast period from 2023 to 2030 to reach US $ 0018.9 billion in 2030.
The market growth is driven by the increasing Consumers who are increasingly canceling traditional cable and satellite TV subscriptions in favor of more flexible and cost-effective streaming options. CTV devices are often chosen as replacements for traditional TV. Leading companies that are focused on Global Expansion, Interactive and Immersive Experiences, Advertising Innovation, Cross-Platform Integration, 5G Connectivity, Privacy and Security, and others to boost market shares in the industry.
The Connected TV (CTV) market, as of September 2021, was characterized by substantial growth driven by the shift from traditional TV to streaming services, with key players including Roku, Apple, Amazon, and streaming platforms like Netflix and Disney+. Notable trends included the rise of original content production, increased CTV advertising, affordability, and ongoing innovation. Challenges included privacy concerns and subscription fatigue. The CTV market was expected to continue expanding globally, integrating 5G and advancing display technology, with regulatory changes and innovation driving its future growth.
Smart TV adoption has been a significant driver behind the growth of the Connected TV (CTV) market. These internet-connected televisions have transformed how consumers access and consume content. Smart TVs offer built-in internet connectivity and pre-installed streaming apps, making it easier for users to access online content without the need for additional devices. This convenience has contributed to the decline in traditional cable and satellite TV subscriptions as consumers embrace the flexibility and diversity of streaming services.
The demand for data analytics is on the rise in the Connected TV (CTV) market. Advertisers and content providers are increasingly leveraging data analytics to target specific demographics, measure the effectiveness of advertising campaigns, and personalize content recommendations. This data-driven approach allows for more efficient ad placement and improved user experiences, making data analytics a critical component in shaping the CTV landscape.
Technological advancements continue to shape the Connected TV (CTV) market, enhancing the user experience and expanding its potential. Key advancements include improved display technology (e.g., 8K resolution, OLED screens), faster and more reliable connectivity with the rollout of 5G networks, and the integration of AI-powered voice assistants and natural language processing for more intuitive interactions with CTV devices. These advancements, coupled with ongoing innovation in content delivery and interactivity, are poised to further solidify CTV's position as a dominant entertainment platform.
The Global Connected TV Market is analyzed across Smart TV, Streaming Media Player, and others. Smart TVs are poised to register the fastest growth. Smart TVs are integral to the Connected TV (CTV) market, offering easy access to streaming services and the internet, driving the transition away from traditional TV subscriptions, and serving as a primary entry point into the CTV ecosystem, fueling market growth.
The Global Connected TV Market is analyzed across various Platforms including 4K UHD TV, HDTV, Full HD TV, and others. Of these, 4K UHD TV held a significant market share in 2023. 4K UHD TVs have significantly impacted the Connected TV (CTV) market by offering superior picture quality and aligning with the increasing availability of 4K content on streaming platforms. This demand for enhanced viewing experiences has fueled the growth of the CTV market as consumers seek high-quality displays to maximize their streaming experiences.
By Device
By Resolution
By Inch Type
By Region
*List not exhaustive
Connected TV Market Outlook 2023
1 Market Overview
1.1 Introduction to the Connected TV Market
1.2 Scope of the Study
1.3 Research Objective
1.3.1 Key Market Scope and Segments
1.3.2 Players Covered
1.3.3 Years Considered
2 Executive Summary
2.1 2023 Connected TV - Market Statistics
3 Market Dynamics
3.1 Market Drivers
3.2 Market Challenges
3.3 Market Opportunities
3.4 Market Trends
4 Market Factor Analysis
4.1 Porter’s Five Forces
4.2 Market Entropy
4.2.1 Global Connected TV Market Companies with Area Served
4.2.2 Products Offerings Global Connected TV Market
5 COVID-19 Impact Analysis and Outlook Scenarios
5.1.1 Covid-19 Impact Analysis
5.1.2 post-COVID-19 Scenario- Low Growth Case
5.1.3 post-COVID-19 Scenario- Reference Growth Case
5.1.4 post-COVID-19 Scenario- Low Growth Case
6 Global Connected TV Market Trends
6.1 Global Connected TV Revenue (USD Million) and CAGR (%) by Type (2018-2030)
6.2 Global Connected TV Revenue (USD Million) and CAGR (%) by Applications (2018-2030)
6.3 Global Connected TV Revenue (USD Million) and CAGR (%) by regions (2018-2030)
7 Global Connected TV Market Revenue (USD Million) by Type, and Applications (2018-2022)
7.1 Global Connected TV Revenue (USD Million) by Type (2018-2022)
7.1.1 Global Connected TV Revenue (USD Million), Market Share (%) by Type (2018-2022)
7.2 Global Connected TV Revenue (USD Million) by Applications (2018-2022)
7.2.1 Global Connected TV Revenue (USD Million), Market Share (%) by Applications (2018-2022)
8 Global Connected TV Development Regional Status and Outlook
8.1 Global Connected TV Revenue (USD Million) By Regions (2018-2022)
8.2 North America Connected TV Revenue (USD Million) by Type, and Application (2018-2022)
8.2.1 North America Connected TV Revenue (USD Million) by Country (2018-2022)
8.2.2 North America Connected TV Revenue (USD Million) by Type (2018-2022)
8.2.3 North America Connected TV Revenue (USD Million) by Applications (2018-2022)
8.3 Europe Connected TV Revenue (USD Million), by Type, and Applications (USD Million) (2018-2022)
8.3.1 Europe Connected TV Revenue (USD Million), by Country (2018-2022)
8.3.2 Europe Connected TV Revenue (USD Million) by Type (2018-2022)
8.3.3 Europe Connected TV Revenue (USD Million) by Applications (2018-2022)
8.4 Asia Pacific Connected TV Revenue (USD Million), and Revenue (USD Million) by Type, and Applications (2018-2022)
8.4.1 Asia Pacific Connected TV Revenue (USD Million) by Country (2018-2022)
8.4.2 Asia Pacific Connected TV Revenue (USD Million) by Type (2018-2022)
8.4.3 Asia Pacific Connected TV Revenue (USD Million) by Applications (2018-2022)
8.5 South America Connected TV Revenue (USD Million), by Type, and Applications (2018-2022)
8.5.1 South America Connected TV Revenue (USD Million), by Country (2018-2022)
8.5.2 South America Connected TV Revenue (USD Million) by Type (2018-2022)
8.5.3 South America Connected TV Revenue (USD Million) by Applications (2018-2022)
8.6 Middle East and Africa Connected TV Revenue (USD Million), by Type, Technology, Application, Thickness (2018-2022)
8.6.1 Middle East and Africa Connected TV Revenue (USD Million) by Country (2018-2022)
8.6.2 Middle East and Africa Connected TV Revenue (USD Million) by Type (2018-2022)
8.6.3 Middle East and Africa Connected TV Revenue (USD Million) by Applications (2018-2022)
9 Company Profiles
10 Global Connected TV Market Revenue (USD Million), by Type, and Applications (2023-2030)
10.1 Global Connected TV Revenue (USD Million) and Market Share (%) by Type (2023-2030)
10.1.1 Global Connected TV Revenue (USD Million), and Market Share (%) by Type (2023-2030)
10.2 Global Connected TV Revenue (USD Million) and Market Share (%) by Applications (2023-2030)
10.2.1 Global Connected TV Revenue (USD Million), and Market Share (%) by Applications (2023-2030)
11 Global Connected TV Development Regional Status and Outlook Forecast
11.1 Global Connected TV Revenue (USD Million) By Regions (2023-2030)
11.2 North America Connected TV Revenue (USD Million) by Type, and Applications (2023-2030)
11.2.1 North America Connected TV Revenue (USD) Million by Country (2023-2030)
11.2.2 North America Connected TV Revenue (USD Million), by Type (2023-2030)
11.2.3 North America Connected TV Revenue (USD Million), Market Share (%) by Applications (2023-2030)
11.3 Europe Connected TV Revenue (USD Million), by Type, and Applications (2023-2030)
11.3.1 Europe Connected TV Revenue (USD Million), by Country (2023-2030)
11.3.2 Europe Connected TV Revenue (USD Million), by Type (2023-2030)
11.3.3 Europe Connected TV Revenue (USD Million), by Applications (2023-2030)
11.4 Asia Pacific Connected TV Revenue (USD Million) by Type, and Applications (2023-2030)
11.4.1 Asia Pacific Connected TV Revenue (USD Million), by Country (2023-2030)
11.4.2 Asia Pacific Connected TV Revenue (USD Million), by Type (2023-2030)
11.4.3 Asia Pacific Connected TV Revenue (USD Million), by Applications (2023-2030)
11.5 South America Connected TV Revenue (USD Million), by Type, and Applications (2023-2030)
11.5.1 South America Connected TV Revenue (USD Million), by Country (2023-2030)
11.5.2 South America Connected TV Revenue (USD Million), by Type (2023-2030)
11.5.3 South America Connected TV Revenue (USD Million), by Applications (2023-2030)
11.6 Middle East and Africa Connected TV Revenue (USD Million), by Type, and Applications (2023-2030)
11.6.1 Middle East and Africa Connected TV Revenue (USD Million), by region (2023-2030)
11.6.2 Middle East and Africa Connected TV Revenue (USD Million), by Type (2023-2030)
11.6.3 Middle East and Africa Connected TV Revenue (USD Million), by Applications (2023-2030)
12 Methodology and Data Sources
12.1 Methodology/Research Approach
12.1.1 Research Programs/Design
12.1.2 Market Size Estimation
12.1.3 Market Breakdown and Data Triangulation
12.2 Data Sources
12.2.1 Secondary Sources
12.2.2 Primary Sources
12.3 Disclaimer
List of Tables
Table 1 Market Segmentation Analysis
Table 2 Global Connected TV Market Companies with Areas Served
Table 3 Products Offerings Global Connected TV Market
Table 4 Low Growth Scenario Forecasts
Table 5 Reference Case Growth Scenario
Table 6 High Growth Case Scenario
Table 7 Global Connected TV Revenue (USD Million) And CAGR (%) By Type (2018-2030)
Table 8 Global Connected TV Revenue (USD Million) And CAGR (%) By Applications (2018-2030)
Table 9 Global Connected TV Revenue (USD Million) And CAGR (%) By Regions (2018-2030)
Table 10 Global Connected TV Revenue (USD Million) By Type (2018-2022)
Table 11 Global Connected TV Revenue Market Share (%) By Type (2018-2022)
Table 12 Global Connected TV Revenue (USD Million) By Applications (2018-2022)
Table 13 Global Connected TV Revenue Market Share (%) By Applications (2018-2022)
Table 14 Global Connected TV Market Revenue (USD Million) By Regions (2018-2022)
Table 15 Global Connected TV Market Share (%) By Regions (2018-2022)
Table 16 North America Connected TV Revenue (USD Million) By Country (2018-2022)
Table 17 North America Connected TV Revenue (USD Million) By Type (2018-2022)
Table 18 North America Connected TV Revenue (USD Million) By Applications (2018-2022)
Table 19 Europe Connected TV Revenue (USD Million) By Country (2018-2022)
Table 20 Europe Connected TV Revenue (USD Million) By Type (2018-2022)
Table 21 Europe Connected TV Revenue (USD Million) By Applications (2018-2022)
Table 22 Asia Pacific Connected TV Revenue (USD Million) By Country (2018-2022)
Table 23 Asia Pacific Connected TV Revenue (USD Million) By Type (2018-2022)
Table 24 Asia Pacific Connected TV Revenue (USD Million) By Applications (2018-2022)
Table 25 South America Connected TV Revenue (USD Million) By Country (2018-2022)
Table 26 South America Connected TV Revenue (USD Million) By Type (2018-2022)
Table 27 South America Connected TV Revenue (USD Million) By Applications (2018-2022)
Table 28 Middle East and Africa Connected TV Revenue (USD Million) By Region (2018-2022)
Table 29 Middle East and Africa Connected TV Revenue (USD Million) By Type (2018-2022)
Table 30 Middle East and Africa Connected TV Revenue (USD Million) By Applications (2018-2022)
Table 31 Financial Analysis
Table 32 Global Connected TV Revenue (USD Million) By Type (2023-2030)
Table 33 Global Connected TV Revenue Market Share (%) By Type (2023-2030)
Table 34 Global Connected TV Revenue (USD Million) By Applications (2023-2030)
Table 35 Global Connected TV Revenue Market Share (%) By Applications (2023-2030)
Table 36 Global Connected TV Market Revenue (USD Million), And Revenue (USD Million) By Regions (2023-2030)
Table 37 North America Connected TV Revenue (USD)By Country (2023-2030)
Table 38 North America Connected TV Revenue (USD Million) By Type (2023-2030)
Table 39 North America Connected TV Revenue (USD Million) By Applications (2023-2030)
Table 40 Europe Connected TV Revenue (USD Million) By Country (2023-2030)
Table 41 Europe Connected TV Revenue (USD Million) By Type (2023-2030)
Table 42 Europe Connected TV Revenue (USD Million) By Applications (2023-2030)
Table 43 Asia Pacific Connected TV Revenue (USD Million) By Country (2023-2030)
Table 44 Asia Pacific Connected TV Revenue (USD Million) By Type (2023-2030)
Table 45 Asia Pacific Connected TV Revenue (USD Million) By Applications (2023-2030)
Table 46 South America Connected TV Revenue (USD Million) By Country (2023-2030)
Table 47 South America Connected TV Revenue (USD Million) By Type (2023-2030)
Table 48 South America Connected TV Revenue (USD Million) By Applications (2023-2030)
Table 49 Middle East and Africa Connected TV Revenue (USD Million) By Region (2023-2030)
Table 50 Middle East and Africa Connected TV Revenue (USD Million) By Region (2023-2030)
Table 51 Middle East and Africa Connected TV Revenue (USD Million) By Type (2023-2030)
Table 52 Middle East and Africa Connected TV Revenue (USD Million) By Applications (2023-2030)
Table 53 Research Programs/Design for This Report
Table 54 Key Data Information from Secondary Sources
Table 55 Key Data Information from Primary Sources
List of Figures
Figure 1 Market Scope
Figure 2 Porter’s Five Forces
Figure 3 Global Connected TV Revenue (USD Million) By Type (2018-2022)
Figure 4 Global Connected TV Revenue Market Share (%) By Type (2022)
Figure 5 Global Connected TV Revenue (USD Million) By Applications (2018-2022)
Figure 6 Global Connected TV Revenue Market Share (%) By Applications (2022)
Figure 7 Global Connected TV Market Revenue (USD Million) By Regions (2018-2022)
Figure 8 Global Connected TV Market Share (%) By Regions (2022)
Figure 9 North America Connected TV Revenue (USD Million) By Country (2018-2022)
Figure 10 North America Connected TV Revenue (USD Million) By Type (2018-2022)
Figure 11 North America Connected TV Revenue (USD Million) By Applications (2018-2022)
Figure 12 Europe Connected TV Revenue (USD Million) By Country (2018-2022)
Figure 13 Europe Connected TV Revenue (USD Million) By Type (2018-2022)
Figure 14 Europe Connected TV Revenue (USD Million) By Applications (2018-2022)
Figure 15 Asia Pacific Connected TV Revenue (USD Million) By Country (2018-2022)
Figure 16 Asia Pacific Connected TV Revenue (USD Million) By Type (2018-2022)
Figure 17 Asia Pacific Connected TV Revenue (USD Million) By Applications (2018-2022)
Figure 18 South America Connected TV Revenue (USD Million) By Country (2018-2022)
Figure 19 South America Connected TV Revenue (USD Million) By Type (2018-2022)
Figure 20 South America Connected TV Revenue (USD Million) By Applications (2018-2022)
Figure 21 Middle East and Africa Connected TV Revenue (USD Million) By Region (2018-2022)
Figure 22 Middle East and Africa Connected TV Revenue (USD Million) By Type (2018-2022)
Figure 23 Middle East and Africa Connected TV Revenue (USD Million) By Applications (2018-2022)
Figure 24 Global Connected TV Revenue (USD Million) By Type (2023-2030)
Figure 25 Global Connected TV Revenue Market Share (%) By Type (2030)
Figure 26 Global Connected TV Revenue (USD Million) By Applications (2023-2030)
Figure 27 Global Connected TV Revenue Market Share (%) By Applications (2030)
Figure 28 Global Connected TV Market Revenue (USD Million) By Regions (2023-2030)
Figure 29 North America Connected TV Revenue (USD Million) By Country (2023-2030)
Figure 30 North America Connected TV Revenue (USD Million) By Type (2023-2030)
Figure 31 North America Connected TV Revenue (USD Million) By Applications (2023-2030)
Figure 32 Europe Connected TV Revenue (USD Million) By Country (2023-2030)
Figure 33 Europe Connected TV Revenue (USD Million) By Type (2023-2030)
Figure 34 Europe Connected TV Revenue (USD Million) By Applications (2023-2030)
Figure 35 Asia Pacific Connected TV Revenue (USD Million) By Country (2023-2030)
Figure 36 Asia Pacific Connected TV Revenue (USD Million) By Type (2023-2030)
Figure 37 Asia Pacific Connected TV Revenue (USD Million) By Applications (2023-2030)
Figure 38 South America Connected TV Revenue (USD Million) By Country (2023-2030)
Figure 39 South America Connected TV Revenue (USD Million) By Type (2023-2030)
Figure 40 South America Connected TV Revenue (USD Million) By Applications (2023-2030)
Figure 41 Middle East and Africa Connected TV Revenue (USD Million) By Region (2023-2030)
Figure 42 Middle East and Africa Connected TV Revenue (USD Million) By Region (2023-2030)
Figure 43 Middle East and Africa Connected TV Revenue (USD Million) By Type (2023-2030)
Figure 44 Middle East and Africa Connected TV Revenue (USD Million) By Applications (2023-2030)
Figure 45 Bottom-Up and Top-Down Approaches for This Report
Figure 46 Data Triangulation
By Device
By Resolution
By Inch Type
By Region