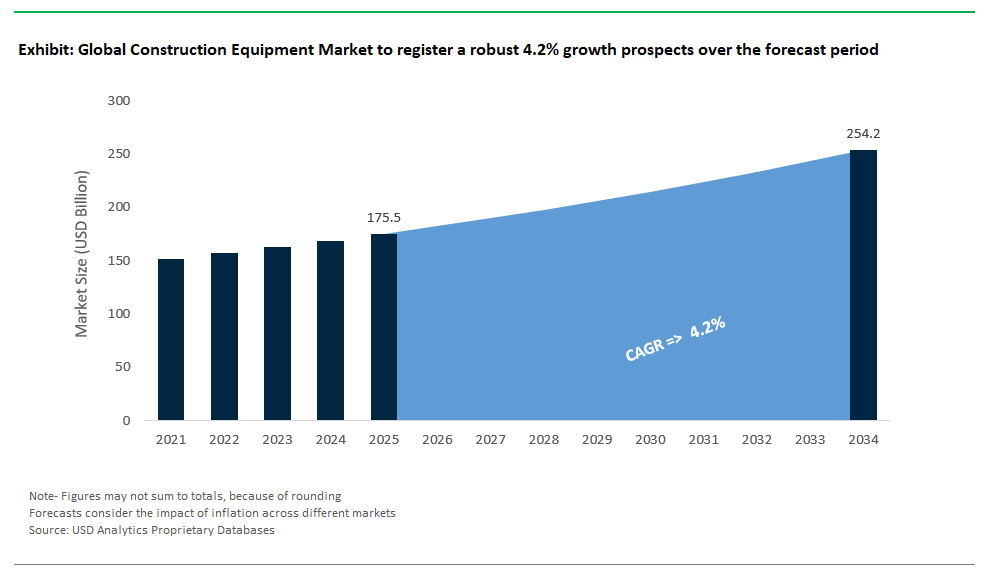
The Global Construction Equipment Market Size is estimated at $175.5 Billion in 2025 and is forecast to register an annual growth rate (CAGR) of 4.2% to reach $254.1 Billion by 2034.
The global Construction Equipment Market Study analyzes and forecasts the market size across 6 regions and 24 countries for diverse segments -By Product (Earth Moving Machinery, Material Handling Machinery), By Type (Heavy Construction Equipment, Compact Construction Equipment), By Propulsion (ICE, Electric, CNG/LNG), By Power Output (Below 100 HP, 100 to 200 HP, 200 to 400 HP, Above 400 HP), By Engine Capacity (Up to 250 HP, 250 to 500 HP, Above 500 HP).
An Introduction to Construction Equipment Market in 2025
The Construction Equipment market is expanding due to the growing demand for infrastructure development and construction activities worldwide. Construction equipment includes machinery such as excavators, bulldozers, cranes, and loaders, essential for various construction projects, including roads, bridges, and buildings. The market is driven by increasing urbanization, infrastructure investment, and technological advancements in equipment, such as automation and advanced control systems. Innovations such as smart construction equipment, energy-efficient models, and improved safety features are shaping the market. As construction projects become more ambitious and complex, the demand for advanced and reliable construction equipment is expected to grow significantly.
Construction Equipment Competitive Landscape
The market report analyses the leading companies in the industry including AB Volvo, Caterpillar Inc, CNH Industrial America LLC, Deere & Company, Doosan Corp, Escorts Ltd, Hitachi Construction Machinery Co. Ltd, Hyundai Construction Equipment Co. Ltd, J C Bamford Excavators Ltd, Komatsu Ltd, KUBOTA Corp, LIEBHERR, MANITOU Group, SANY Group, Terex Corp, Wacker Neuson SE, XCMG Group, Zoomlion Heavy Industry Science&Technology Co. Ltd, and others.
Construction Equipment Market Dynamics
Market Trend: Emphasis on Equipment Electrification and Fuel Efficiency
A significant trend in the construction equipment market is the emphasis on equipment electrification and fuel efficiency. As environmental regulations become more stringent and the construction industry seeks to reduce its carbon footprint, there is an increasing focus on developing electric and hybrid construction equipment. These innovations offer benefits such as lower emissions, reduced operating costs, and quieter operation. The trend towards electrification reflects the broader movement within the construction industry to adopt more sustainable practices and improve operational efficiency.
Market Driver: Growing Infrastructure Development and Urbanization
The primary driver of the construction equipment market is the growing infrastructure development and urbanization across the globe. Rapid urban expansion, population growth, and government investments in infrastructure projects are fueling demand for advanced construction equipment. This includes machinery for road construction, building development, and infrastructure maintenance. The need to support large-scale construction projects and improve urban infrastructure drives investments in new equipment and technology, supporting market growth.
Market Opportunity: Adoption of Smart Construction Technologies
An emerging opportunity in the construction equipment market is the adoption of smart construction technologies. The integration of Internet of Things (IoT) devices, sensors, and data analytics into construction equipment can provide real-time insights into equipment performance, maintenance needs, and operational efficiency. Smart technologies offer the potential to enhance productivity, reduce downtime, and improve safety on construction sites. Companies that develop and deploy these smart solutions can capitalize on the growing demand for innovative and data-driven construction equipment, positioning themselves for future growth in the market.
Construction Equipment Market Share Analysis: Earth Moving Machinery generated the highest revenue in 2024
In the Construction Equipment Market, Earth Moving Machinery is the largest segment due to its fundamental role in various construction activities. Earth moving machinery, which includes excavators, bulldozers, backhoes, and loaders, is essential for tasks such as excavation, grading, and material handling on construction sites. This category of equipment is pivotal in preparing construction sites, managing large volumes of earth, and performing foundational work, making it a cornerstone of construction operations. The extensive and varied applications of earth moving machinery across residential, commercial, and infrastructure projects drive its dominance in the market. The constant need for site preparation and material handling in construction projects ensures that earth moving machinery remains the largest segment in the construction equipment market.
Construction Equipment Market Share Analysis: Compact Construction Equipment is poised to register the fastest CAGR over the forecast period
In the Construction Equipment Market, Compact Construction Equipment is the fastest growing segment due to its increasing applicability in urban and constrained environments. Compact construction equipment, such as mini excavators, skid steer loaders, and compact track loaders, is designed for versatility and maneuverability in confined spaces. The rising demand for construction and renovation work in urban areas, where space is limited, has significantly boosted the need for compact equipment. Additionally, advancements in technology have improved the performance and efficiency of compact machinery, making it an attractive option for contractors seeking both power and agility. The growing focus on efficiency and adaptability in construction projects drives the rapid growth of the compact construction equipment segment.
Construction Equipment Market Share Analysis: Internal Combustion Engine (ICE) generated the highest revenue in 2024
In the Construction Equipment Market, Internal Combustion Engine (ICE) is the largest segment due to its longstanding dominance and reliability in powering construction machinery. ICE-powered equipment, including diesel engines, has been the traditional choice for construction applications due to its robustness, high power output, and established infrastructure for fuel supply and maintenance. The majority of heavy and earth moving machinery continues to rely on ICE for its proven performance in demanding conditions. Despite the gradual shift towards alternative propulsion technologies like electric and CNG/LNG, ICE remains the largest segment due to its extensive use and the significant investment in existing engine technology.
Construction Equipment Market Share Analysis: Above 400 HP is poised to register the fastest CAGR over the forecast period
In the Construction Equipment Market, Above 400 HP is the fastest growing segment due to increasing demands for high-power equipment in large-scale construction projects and mining operations. Equipment with power outputs exceeding 400 horsepower is essential for handling the most demanding tasks, such as large earthmoving operations, heavy lifting, and extensive material handling. The growth in infrastructure projects, large-scale commercial construction, and mining activities drives the need for more powerful machinery capable of efficiently performing these tasks. As projects become larger and more complex, the demand for high-power construction equipment grows, making the above 400 HP segment the fastest growing in the market.
Construction Equipment Market Report Scope
|
Parameter
|
Details
|
|
Market Size (2025)
|
$ 175.5 Billion
|
|
Market Size (2034)
|
$ 254.1 Billion
|
|
Market Growth Rate
|
4.2%
|
|
Segments
|
By Product (Earth Moving Machinery, Material Handling Machinery), By Type (Heavy Construction Equipment, Compact Construction Equipment), By Propulsion (ICE, Electric, CNG/LNG), By Power Output (Below 100 HP, 100 to 200 HP, 200 to 400 HP, Above 400 HP), By Engine Capacity (Up to 250 HP, 250 to 500 HP, Above 500 HP)
|
|
Study Period
|
2019- 2024 and 2025-2034
|
|
Units
|
Revenue (USD)
|
|
Qualitative Analysis
|
Porter’s Five Forces, SWOT Profile, Market Share, Scenario Forecasts, Market Ecosystem, Company Ranking, Market Dynamics, Industry Benchmarking
|
|
Companies
|
AB Volvo, Caterpillar Inc, CNH Industrial America LLC, Deere & Company, Doosan Corp, Escorts Ltd, Hitachi Construction Machinery Co. Ltd, Hyundai Construction Equipment Co. Ltd, J C Bamford Excavators Ltd, Komatsu Ltd, KUBOTA Corp, LIEBHERR, MANITOU Group, SANY Group, Terex Corp, Wacker Neuson SE, XCMG Group, Zoomlion Heavy Industry Science&Technology Co. Ltd
|
|
Countries
|
US, Canada, Mexico, Germany, France, Spain, Italy, UK, Russia, China, India, Japan, South Korea, Australia, South East Asia, Brazil, Argentina, Middle East, Africa
|
Construction Equipment Market Segmentation
By Product
Earth Moving Machinery
-Excavators
-Loaders
-Dump Trucks
-Moto Graders
-Dozers
Material Handling Machinery
-Crawler Cranes
-Trailer Mounted Cranes
-Truck Mounted Cranes
-Forklift
Concrete and Road Construction Machinery
-Concrete Mixer & Pavers
-Construction Pumps
-Others
By Type
Heavy Construction Equipment
Compact Construction Equipment
By Propulsion
ICE
Electric
CNG/LNG
By Power Output
Below 100 HP
100 to 200 HP
200 to 400 HP
Above 400 HP
By Engine Capacity
Up to 250 HP
250 to 500 HP
Above 500 HP
Countries Analyzed
North America (US, Canada, Mexico)
Europe (Germany, UK, France, Spain, Italy, Russia, Rest of Europe)
Asia Pacific (China, India, Japan, South Korea, Australia, South East Asia, Rest of Asia)
South America (Brazil, Argentina, Rest of South America)
Middle East and Africa (Saudi Arabia, UAE, Rest of Middle East, South Africa, Egypt, Rest of Africa)
Construction Equipment Companies Profiled in the Study
AB Volvo
Caterpillar Inc
CNH Industrial America LLC
Deere & Company
Doosan Corp
Escorts Ltd
Hitachi Construction Machinery Co. Ltd
Hyundai Construction Equipment Co. Ltd
J C Bamford Excavators Ltd
Komatsu Ltd
KUBOTA Corp
LIEBHERR
MANITOU Group
SANY Group
Terex Corp
Wacker Neuson SE
XCMG Group
Zoomlion Heavy Industry Science&Technology Co. Ltd
*- List Not Exhaustive
About USD Analytics
Table of Contents
List of Charts and Exhibits
List of Tables
1. Executive Summary
What’s New in 2025?
Top 10 Takeaways from the industry
Potential Opportunities for Industry Stakeholders
Strategic Imperatives
Company Market Positioning
Industry Benchmarking Matrix
2. Research Scope and Methodology
Market Definition
Market Segments
Companies Profiled
Research Methodology
Bottom-Up Method
Top-Down Method
Data Triangulation
Forecast Methodology
Data Sources
USDA Proprietary Databases
External Sources
Primary Research and Interviews
Conversion Rates for USD
Abbreviations
3. Strategic Landscape: Key Insights and Implications
Spotlight: Key Strategies opted by Business Leaders
Competitive Landscape
Market Size ($ Million) and Share (%) by Company, 2024
SWOT Analysis
- Key Market Strengths
- Key Market Weaknesses
- Potential Opportunities
- Potential Threats
Porter’s Five Force Analysis
- Summary
- Bargaining Power of Buyers- Impact Analysis
- Bargaining Power of Suppliers- Impact Analysis
- Threat of new entrants- Impact Analysis
- Intensity of Competitive Rivalry- Impact Analysis
Macro-Environmental Analysis
- Economic forecasts by Country, 2010- 2035
- Population forecasts by Country, 2010- 2035
- Inflation Outlook by Country, 2010-2035
- Impact of Russia-Ukraine Conflict, Sluggish China Growth, US Developments
5. Growth Opportunity Analysis
Trends at a Glance
- What are the most noteworthy trends in the market
- Where should leaders pay attention?
- What industries are likely to be affected by the growth?
Market Dynamics
- Charting a path forward
- Growth Drivers
- Growth Barriers
Key Industry Stakeholders
- Suppliers
- Manufacturers and Service Providers
- Distribution Channels
- End-Users and Applications
- Regulators
- Investors, Traders, and R&D Institutes
Regulatory Landscape
6. Market Size Outlook to 2034
Global Nanocoatings Market Size Forecast, USD Million, 2018- 2034
- Historic Market Size, 2018- 2024
- Forecast Market Size, 2024- 2034
Scenario Analysis
- Low Growth Scenario: Definition and Outlook to 2034
- Reference Case: Definition and Outlook to 2034
- High Growth Scenario: Definition and Outlook to 2034
Pricing Analysis and Outlook
- Nanocoatings Average Price Forecast, 2021- 2034
- Key Factors Shaping the Pricing Patterns
7. Historical Nanocoatings Market Size by Segments, 2018- 2024
Key Statistics, 2024
Nanocoatings Market Size Outlook by Type, USD Million, 2018- 2024
Growth Comparison (y-o-y) across Nanocoatings Types, 2018- 2024
Nanocoatings Market Size Outlook by Application, USD Million, 2018- 2024
Growth Comparison (y-o-y) across Nanocoatings Applications, 2018- 2024
8. Nanocoatings Market Size Outlook by Segments, 2024- 2034
By Product
Earth Moving Machinery
-Excavators
-Loaders
-Dump Trucks
-Moto Graders
-Dozers
Material Handling Machinery
-Crawler Cranes
-Trailer Mounted Cranes
-Truck Mounted Cranes
-Forklift
Concrete and Road Construction Machinery
-Concrete Mixer & Pavers
-Construction Pumps
-Others
By Type
Heavy Construction Equipment
Compact Construction Equipment
By Propulsion
ICE
Electric
CNG/LNG
By Power Output
Below 100 HP
100 to 200 HP
200 to 400 HP
Above 400 HP
By Engine Capacity
Up to 250 HP
250 to 500 HP
Above 500 HP
9. Nanocoatings Market Size Outlook by Region
North America
Key Market Dynamics
North America Nanocoatings Market Size Outlook by Type, USD Million, 2021-2034
North America Nanocoatings Market Size Outlook by Application, USD Million, 2021-2034
North America Nanocoatings Market Size Outlook by Sales Channel, USD Million, 2021-2034
North America Nanocoatings Market Size Outlook by Country, USD Million, 2021-2034
Europe
Key Market Dynamics
Europe Nanocoatings Market Size Outlook by Type, USD Million, 2021-2034
Europe Nanocoatings Market Size Outlook by Application, USD Million, 2021-2034
Europe Nanocoatings Market Size Outlook by Sales Channel, USD Million, 2021-2034
Europe Nanocoatings Market Size Outlook by Country, USD Million, 2021-2034
Asia Pacific
Key Market Dynamics
Asia Pacific Nanocoatings Market Size Outlook by Type, USD Million, 2021-2034
Asia Pacific Nanocoatings Market Size Outlook by Application, USD Million, 2021-2034
Asia Pacific Nanocoatings Market Size Outlook by Sales Channel, USD Million, 2021-2034
Asia Pacific Nanocoatings Market Size Outlook by Country, USD Million, 2021-2034
South America
Key Market Dynamics
South America Nanocoatings Market Size Outlook by Type, USD Million, 2021-2034
South America Nanocoatings Market Size Outlook by Application, USD Million, 2021-2034
South America Nanocoatings Market Size Outlook by Sales Channel, USD Million, 2021-2034
South America Nanocoatings Market Size Outlook by Country, USD Million, 2021-2034
Middle East and Africa
Key Market Dynamics
Middle East and Africa Nanocoatings Market Size Outlook by Type, USD Million, 2021-2034
Middle East and Africa Nanocoatings Market Size Outlook by Application, USD Million, 2021-2034
Middle East and Africa Nanocoatings Market Size Outlook by Sales Channel, USD Million, 2021-2034
Middle East and Africa Nanocoatings Market Size Outlook by Country, USD Million, 2021-2034
10. United States Nanocoatings Market Analysis and Outlook, 2021- 2034
Key Statistics
United States Nanocoatings Market Size Outlook by Type, 2021- 2034
United States Nanocoatings Market Size Outlook by Application, 2021- 2034
United States Nanocoatings Market Size Outlook by End-User, 2021- 2034
11. Canada Nanocoatings Market Analysis and Outlook, 2021- 2034
Key Statistics
Canada Nanocoatings Market Size Outlook by Type, 2021- 2034
Canada Nanocoatings Market Size Outlook by Application, 2021- 2034
Canada Nanocoatings Market Size Outlook by End-User, 2021- 2034
12. Mexico Nanocoatings Market Analysis and Outlook, 2021- 2034
Key Statistics
Mexico Nanocoatings Market Size Outlook by Type, 2021- 2034
Mexico Nanocoatings Market Size Outlook by Application, 2021- 2034
Mexico Nanocoatings Market Size Outlook by End-User, 2021- 2034
13. Germany Nanocoatings Market Analysis and Outlook, 2021- 2034
Key Statistics
Germany Nanocoatings Market Size Outlook by Type, 2021- 2034
Germany Nanocoatings Market Size Outlook by Application, 2021- 2034
Germany Nanocoatings Market Size Outlook by End-User, 2021- 2034
14. France Nanocoatings Market Analysis and Outlook, 2021- 2034
Key Statistics
France Nanocoatings Market Size Outlook by Type, 2021- 2034
France Nanocoatings Market Size Outlook by Application, 2021- 2034
France Nanocoatings Market Size Outlook by End-User, 2021- 2034
15. United Kingdom Nanocoatings Market Analysis and Outlook, 2021- 2034
Key Statistics
United Kingdom Nanocoatings Market Size Outlook by Type, 2021- 2034
United Kingdom Nanocoatings Market Size Outlook by Application, 2021- 2034
United Kingdom Nanocoatings Market Size Outlook by End-User, 2021- 2034
16. Spain Nanocoatings Market Analysis and Outlook, 2021- 2034
Key Statistics
Spain Nanocoatings Market Size Outlook by Type, 2021- 2034
Spain Nanocoatings Market Size Outlook by Application, 2021- 2034
Spain Nanocoatings Market Size Outlook by End-User, 2021- 2034
17. Italy Nanocoatings Market Analysis and Outlook, 2021- 2034
Key Statistics
Italy Nanocoatings Market Size Outlook by Type, 2021- 2034
Italy Nanocoatings Market Size Outlook by Application, 2021- 2034
Italy Nanocoatings Market Size Outlook by End-User, 2021- 2034
18. Benelux Nanocoatings Market Analysis and Outlook, 2021- 2034
Key Statistics
Benelux Nanocoatings Market Size Outlook by Type, 2021- 2034
Benelux Nanocoatings Market Size Outlook by Application, 2021- 2034
Benelux Nanocoatings Market Size Outlook by End-User, 2021- 2034
19. Nordic Nanocoatings Market Analysis and Outlook, 2021- 2034
Key Statistics
Nordic Nanocoatings Market Size Outlook by Type, 2021- 2034
Nordic Nanocoatings Market Size Outlook by Application, 2021- 2034
Nordic Nanocoatings Market Size Outlook by End-User, 2021- 2034
20. Rest of Europe Nanocoatings Market Analysis and Outlook, 2021- 2034
Key Statistics
Rest of Europe Nanocoatings Market Size Outlook by Type, 2021- 2034
Rest of Europe Nanocoatings Market Size Outlook by Application, 2021- 2034
Rest of Europe Nanocoatings Market Size Outlook by End-User, 2021- 2034
21. China Nanocoatings Market Analysis and Outlook, 2021- 2034
Key Statistics
China Nanocoatings Market Size Outlook by Type, 2021- 2034
China Nanocoatings Market Size Outlook by Application, 2021- 2034
China Nanocoatings Market Size Outlook by End-User, 2021- 2034
22. India Nanocoatings Market Analysis and Outlook, 2021- 2034
Key Statistics
India Nanocoatings Market Size Outlook by Type, 2021- 2034
India Nanocoatings Market Size Outlook by Application, 2021- 2034
India Nanocoatings Market Size Outlook by End-User, 2021- 2034
23. Japan Nanocoatings Market Analysis and Outlook, 2021- 2034
Key Statistics
Japan Nanocoatings Market Size Outlook by Type, 2021- 2034
Japan Nanocoatings Market Size Outlook by Application, 2021- 2034
Japan Nanocoatings Market Size Outlook by End-User, 2021- 2034
24. South Korea Nanocoatings Market Analysis and Outlook, 2021- 2034
Key Statistics
South Korea Nanocoatings Market Size Outlook by Type, 2021- 2034
South Korea Nanocoatings Market Size Outlook by Application, 2021- 2034
South Korea Nanocoatings Market Size Outlook by End-User, 2021- 2034
25. Australia Nanocoatings Market Analysis and Outlook, 2021- 2034
Key Statistics
Australia Nanocoatings Market Size Outlook by Type, 2021- 2034
Australia Nanocoatings Market Size Outlook by Application, 2021- 2034
Australia Nanocoatings Market Size Outlook by End-User, 2021- 2034
26. South East Asia Nanocoatings Market Analysis and Outlook, 2021- 2034
Key Statistics
South East Asia Nanocoatings Market Size Outlook by Type, 2021- 2034
South East Asia Nanocoatings Market Size Outlook by Application, 2021- 2034
South East Asia Nanocoatings Market Size Outlook by End-User, 2021- 2034
27. Rest of Asia Pacific Nanocoatings Market Analysis and Outlook, 2021- 2034
Key Statistics
Rest of Asia Pacific Nanocoatings Market Size Outlook by Type, 2021- 2034
Rest of Asia Pacific Nanocoatings Market Size Outlook by Application, 2021- 2034
Rest of Asia Pacific Nanocoatings Market Size Outlook by End-User, 2021- 2034
28. Brazil Nanocoatings Market Analysis and Outlook, 2021- 2034
Key Statistics
Brazil Nanocoatings Market Size Outlook by Type, 2021- 2034
Brazil Nanocoatings Market Size Outlook by Application, 2021- 2034
Brazil Nanocoatings Market Size Outlook by End-User, 2021- 2034
29. Argentina Nanocoatings Market Analysis and Outlook, 2021- 2034
Key Statistics
Argentina Nanocoatings Market Size Outlook by Type, 2021- 2034
Argentina Nanocoatings Market Size Outlook by Application, 2021- 2034
Argentina Nanocoatings Market Size Outlook by End-User, 2021- 2034
30. Rest of South America Nanocoatings Market Analysis and Outlook, 2021- 2034
Key Statistics
Rest of South America Nanocoatings Market Size Outlook by Type, 2021- 2034
Rest of South America Nanocoatings Market Size Outlook by Application, 2021- 2034
Rest of South America Nanocoatings Market Size Outlook by End-User, 2021- 2034
31. United Arab Emirates Nanocoatings Market Analysis and Outlook, 2021- 2034
Key Statistics
United Arab Emirates Nanocoatings Market Size Outlook by Type, 2021- 2034
United Arab Emirates Nanocoatings Market Size Outlook by Application, 2021- 2034
United Arab Emirates Nanocoatings Market Size Outlook by End-User, 2021- 2034
32. Saudi Arabia Nanocoatings Market Analysis and Outlook, 2021- 2034
Key Statistics
Saudi Arabia Nanocoatings Market Size Outlook by Type, 2021- 2034
Saudi Arabia Nanocoatings Market Size Outlook by Application, 2021- 2034
Saudi Arabia Nanocoatings Market Size Outlook by End-User, 2021- 2034
33. Rest of Middle East Nanocoatings Market Analysis and Outlook, 2021- 2034
Key Statistics
Rest of Middle East Nanocoatings Market Size Outlook by Type, 2021- 2034
Rest of Middle East Nanocoatings Market Size Outlook by Application, 2021- 2034
Rest of Middle East Nanocoatings Market Size Outlook by End-User, 2021- 2034
34. South Africa Nanocoatings Market Analysis and Outlook, 2021- 2034
Key Statistics
South Africa Nanocoatings Market Size Outlook by Type, 2021- 2034
South Africa Nanocoatings Market Size Outlook by Application, 2021- 2034
South Africa Nanocoatings Market Size Outlook by End-User, 2021- 2034
35. Rest of Africa Nanocoatings Market Analysis and Outlook, 2021- 2034
Key Statistics
Rest of Africa Nanocoatings Market Size Outlook by Type, 2021- 2034
Rest of Africa Nanocoatings Market Size Outlook by Application, 2021- 2034
Rest of Africa Nanocoatings Market Size Outlook by End-User, 2021- 2034
36. Key Companies
Market Share Analysis
AB Volvo
Caterpillar Inc
CNH Industrial America LLC
Deere & Company
Doosan Corp
Escorts Ltd
Hitachi Construction Machinery Co. Ltd
Hyundai Construction Equipment Co. Ltd
J C Bamford Excavators Ltd
Komatsu Ltd
KUBOTA Corp
LIEBHERR
MANITOU Group
SANY Group
Terex Corp
Wacker Neuson SE
XCMG Group
Zoomlion Heavy Industry Science&Technology Co. Ltd
Company Benchmarking
Financial Analysis
37. Recent Market Developments
38. Appendix
Looking Ahead
Research Methodology
Legal Disclaimer
