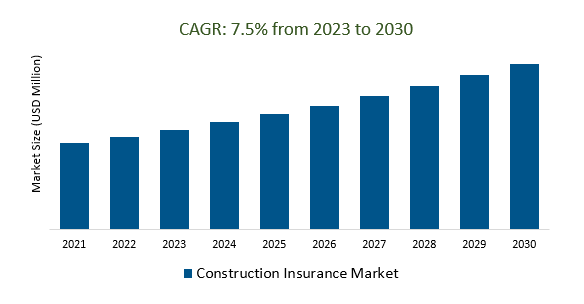
The Global Construction Insurance Market Size is estimated to register 7.5% growth over the forecast period from 2023 to 2030.
The market growth is driven by the increasing growth of PPPs in infrastructure development projects can impact insurance requirements, as these projects involve both public and private entities with different risk profiles. Leading companies that are focused on Increased Demand for Infrastructure Projects, Green and Sustainable Construction, Cybersecurity Insurance, Innovation in Risk Assessment, Global Expansion, and others to boost market shares in the industry.
Market Overview
The Construction Insurance Market offers specialized coverage for construction-related risks, encompassing builder's risk, general liability, workers' compensation, and environmental liability. Key drivers include heightened construction activity, technological advancements, sustainability practices, regulatory shifts, climate change concerns, and cybersecurity risks. Challenges involve risk assessment complexity, claims management, pricing fluctuations, and contract intricacies, necessitating adaptation to evolving industry demands for construction companies and insurers alike.
Market Dynamics
Market Trends - Insurance coverage for green buildings
Insurance coverage for green buildings within the Construction Insurance Market is specifically designed to mitigate risks associated with environmentally sustainable construction practices, including energy-efficient systems, green certifications, and eco-friendly materials. This coverage addresses aspects like design errors, energy performance guarantees, and environmental liabilities, while also accommodating increased project costs tied to green building standards and materials. As sustainability gains importance in the construction sector, the demand for such specialized insurance is expected to rise.
Market Driver- Natural Disasters and Climate Change Demand Construction Insurance Market
Rising natural disasters and climate change concerns are driving increased demand for construction insurance in the Construction Insurance Market. The growing frequency and severity of climate-related events like hurricanes, floods, and wildfires have heightened construction project risks. Builders seek insurance coverage to safeguard their investments, maintain project schedules, and enhance resilience in the face of evolving climate challenges, reflecting a growing industry trend.
Market Opportunity-Introduction of Technology Advancements
Technology advancements, including Building Information Modeling (BIM), drones, and the Internet of Things (IoT), are reshaping the Construction Insurance Market. These innovations enable real-time data gathering, precise risk assessment, and customized coverage solutions. They also enhance communication, safety measures, and risk mitigation in construction projects, marking a significant influence of technology in the insurance sector.
Market Share Analysis- General Liability Insurance Construction Insurance Market will register the fastest growth
The Global Construction Insurance Market is analyzed across General Liability Insurance, Worker Compensation Insurance, Commercial Property Insurance, Builder Risk, and others. General Liability Insurance is poised to register the fastest growth. General Liability Insurance is a crucial aspect of the Construction Insurance Market, providing protection to construction companies against third-party claims for injuries or property damage occurring during construction projects. This coverage mitigates legal costs, medical expenses, and property repair or replacement costs associated with accidents, ensuring the financial security of construction businesses, contractors, and subcontractors while safeguarding project continuity.
Market Share Analysis- Digital Direct Channels held a significant market share in 2023
The Global Construction Insurance Market is analyzed across various Channels including Agency, Bancassurance, Digital Direct channels, and others. Of these, Digital Direct Channels held a significant market share in 2023. Digital direct channels are reshaping the Construction Insurance Market by enabling construction professionals and companies to directly access and purchase insurance online, eliminating the need for intermediaries. These digital channels offer convenience, speed, and cost-efficiency, streamlining the insurance procurement process. This shift also allows insurers to reach a wider audience and provide tailored insurance solutions while reducing administrative costs, making digital direct channels a critical part of the market's distribution strategy.
Construction Insurance Market Segmentation
By Type
- General Liability Insurance
- Worker Compensation Insurance
- Commercial Property Insurance
- Builder Risk
- Others
By Channel
- Agency
- Bancassurance
- Digital Direct Channels
By Region
- North America (United States, Canada, Mexico)
- Europe (Germany, France, United Kingdom, Spain, Italy, Others)
- Asia Pacific (China, India, Japan, South Korea, Australia, Others)
- Latin America (Brazil, Argentina, Others)
- Middle East and Africa (Saudi Arabia, UAE, Kuwait, Other Middle East, South Africa, Nigeria, Other Africa)
Construction Insurance Market Companies
- MetLife Services and Solutions (United States)
- Zurich Insurance Group (Switzerland)
- AXA (France)
- American International Group Inc (United States)
- Next Insurance (United States)
- Chubb Ltd (Switzerland)
- Allianz SE (Germany)
- Ageas (Belgium),
- Insureon (United States)
- The Hartford (United States)
*List not exhaustive
Construction Insurance Market Outlook 2023
1 Market Overview
1.1 Introduction to the Construction Insurance Market
1.2 Scope of the Study
1.3 Research Objective
1.3.1 Key Market Scope and Segments
1.3.2 Players Covered
1.3.3 Years Considered
2 Executive Summary
2.1 2023 Construction Insurance Industry- Market Statistics
3 Market Dynamics
3.1 Market Drivers
3.2 Market Challenges
3.3 Market Opportunities
3.4 Market Trends
4 Market Factor Analysis
4.1 Porter’s Five Forces
4.2 Market Entropy
4.2.1 Global Construction Insurance Market Companies with Area Served
4.2.2 Products Offerings Global Construction Insurance Market
5 COVID-19 Impact Analysis and Outlook Scenarios
5.1.1 Covid-19 Impact Analysis
5.1.2 post-COVID-19 Scenario- Low Growth Case
5.1.3 post-COVID-19 Scenario- Reference Growth Case
5.1.4 post-COVID-19 Scenario- Low Growth Case
6 Global Construction Insurance Market Trends
6.1 Global Construction Insurance Revenue (USD Million) and CAGR (%) by Type (2018-2030)
6.2 Global Construction Insurance Revenue (USD Million) and CAGR (%) by Applications (2018-2030)
6.3 Global Construction Insurance Revenue (USD Million) and CAGR (%) by regions (2018-2030)
7 Global Construction Insurance Market Revenue (USD Million) by Type, and Applications (2018-2022)
7.1 Global Construction Insurance Revenue (USD Million) by Type (2018-2022)
7.1.1 Global Construction Insurance Revenue (USD Million), Market Share (%) by Type (2018-2022)
7.2 Global Construction Insurance Revenue (USD Million) by Applications (2018-2022)
7.2.1 Global Construction Insurance Revenue (USD Million), Market Share (%) by Applications (2018-2022)
8 Global Construction Insurance Development Regional Status and Outlook
8.1 Global Construction Insurance Revenue (USD Million) By Regions (2018-2022)
8.2 North America Construction Insurance Revenue (USD Million) by Type, and Application (2018-2022)
8.2.1 North America Construction Insurance Revenue (USD Million) by Country (2018-2022)
8.2.2 North America Construction Insurance Revenue (USD Million) by Type (2018-2022)
8.2.3 North America Construction Insurance Revenue (USD Million) by Applications (2018-2022)
8.3 Europe Construction Insurance Revenue (USD Million), by Type, and Applications (USD Million) (2018-2022)
8.3.1 Europe Construction Insurance Revenue (USD Million), by Country (2018-2022)
8.3.2 Europe Construction Insurance Revenue (USD Million) by Type (2018-2022)
8.3.3 Europe Construction Insurance Revenue (USD Million) by Applications (2018-2022)
8.4 Asia Pacific Construction Insurance Revenue (USD Million), and Revenue (USD Million) by Type, and Applications (2018-2022)
8.4.1 Asia Pacific Construction Insurance Revenue (USD Million) by Country (2018-2022)
8.4.2 Asia Pacific Construction Insurance Revenue (USD Million) by Type (2018-2022)
8.4.3 Asia Pacific Construction Insurance Revenue (USD Million) by Applications (2018-2022)
8.5 South America Construction Insurance Revenue (USD Million), by Type, and Applications (2018-2022)
8.5.1 South America Construction Insurance Revenue (USD Million), by Country (2018-2022)
8.5.2 South America Construction Insurance Revenue (USD Million) by Type (2018-2022)
8.5.3 South America Construction Insurance Revenue (USD Million) by Applications (2018-2022)
8.6 Middle East and Africa Construction Insurance Revenue (USD Million), by Type, Technology, Application, Thickness (2018-2022)
8.6.1 Middle East and Africa Construction Insurance Revenue (USD Million) by Country (2018-2022)
8.6.2 Middle East and Africa Construction Insurance Revenue (USD Million) by Type (2018-2022)
8.6.3 Middle East and Africa Construction Insurance Revenue (USD Million) by Applications (2018-2022)
9 Company Profiles
10 Global Construction Insurance Market Revenue (USD Million), by Type, and Applications (2023-2030)
10.1 Global Construction Insurance Revenue (USD Million) and Market Share (%) by Type (2023-2030)
10.1.1 Global Construction Insurance Revenue (USD Million), and Market Share (%) by Type (2023-2030)
10.2 Global Construction Insurance Revenue (USD Million) and Market Share (%) by Applications (2023-2030)
10.2.1 Global Construction Insurance Revenue (USD Million), and Market Share (%) by Applications (2023-2030)
11 Global Construction Insurance Development Regional Status and Outlook Forecast
11.1 Global Construction Insurance Revenue (USD Million) By Regions (2023-2030)
11.2 North America Construction Insurance Revenue (USD Million) by Type, and Applications (2023-2030)
11.2.1 North America Construction Insurance Revenue (USD) Million by Country (2023-2030)
11.2.2 North America Construction Insurance Revenue (USD Million), by Type (2023-2030)
11.2.3 North America Construction Insurance Revenue (USD Million), Market Share (%) by Applications (2023-2030)
11.3 Europe Construction Insurance Revenue (USD Million), by Type, and Applications (2023-2030)
11.3.1 Europe Construction Insurance Revenue (USD Million), by Country (2023-2030)
11.3.2 Europe Construction Insurance Revenue (USD Million), by Type (2023-2030)
11.3.3 Europe Construction Insurance Revenue (USD Million), by Applications (2023-2030)
11.4 Asia Pacific Construction Insurance Revenue (USD Million) by Type, and Applications (2023-2030)
11.4.1 Asia Pacific Construction Insurance Revenue (USD Million), by Country (2023-2030)
11.4.2 Asia Pacific Construction Insurance Revenue (USD Million), by Type (2023-2030)
11.4.3 Asia Pacific Construction Insurance Revenue (USD Million), by Applications (2023-2030)
11.5 South America Construction Insurance Revenue (USD Million), by Type, and Applications (2023-2030)
11.5.1 South America Construction Insurance Revenue (USD Million), by Country (2023-2030)
11.5.2 South America Construction Insurance Revenue (USD Million), by Type (2023-2030)
11.5.3 South America Construction Insurance Revenue (USD Million), by Applications (2023-2030)
11.6 Middle East and Africa Construction Insurance Revenue (USD Million), by Type, and Applications (2023-2030)
11.6.1 Middle East and Africa Construction Insurance Revenue (USD Million), by region (2023-2030)
11.6.2 Middle East and Africa Construction Insurance Revenue (USD Million), by Type (2023-2030)
11.6.3 Middle East and Africa Construction Insurance Revenue (USD Million), by Applications (2023-2030)
12 Methodology and Data Sources
12.1 Methodology/Research Approach
12.1.1 Research Programs/Design
12.1.2 Market Size Estimation
12.1.3 Market Breakdown and Data Triangulation
12.2 Data Sources
12.2.1 Secondary Sources
12.2.2 Primary Sources
12.3 Disclaimer
List of Tables
Table 1 Market Segmentation Analysis
Table 2 Global Construction Insurance Market Companies with Areas Served
Table 3 Products Offerings Global Construction Insurance Market
Table 4 Low Growth Scenario Forecasts
Table 5 Reference Case Growth Scenario
Table 6 High Growth Case Scenario
Table 7 Global Construction Insurance Revenue (USD Million) And CAGR (%) By Type (2018-2030)
Table 8 Global Construction Insurance Revenue (USD Million) And CAGR (%) By Applications (2018-2030)
Table 9 Global Construction Insurance Revenue (USD Million) And CAGR (%) By Regions (2018-2030)
Table 10 Global Construction Insurance Revenue (USD Million) By Type (2018-2022)
Table 11 Global Construction Insurance Revenue Market Share (%) By Type (2018-2022)
Table 12 Global Construction Insurance Revenue (USD Million) By Applications (2018-2022)
Table 13 Global Construction Insurance Revenue Market Share (%) By Applications (2018-2022)
Table 14 Global Construction Insurance Market Revenue (USD Million) By Regions (2018-2022)
Table 15 Global Construction Insurance Market Share (%) By Regions (2018-2022)
Table 16 North America Construction Insurance Revenue (USD Million) By Country (2018-2022)
Table 17 North America Construction Insurance Revenue (USD Million) By Type (2018-2022)
Table 18 North America Construction Insurance Revenue (USD Million) By Applications (2018-2022)
Table 19 Europe Construction Insurance Revenue (USD Million) By Country (2018-2022)
Table 20 Europe Construction Insurance Revenue (USD Million) By Type (2018-2022)
Table 21 Europe Construction Insurance Revenue (USD Million) By Applications (2018-2022)
Table 22 Asia Pacific Construction Insurance Revenue (USD Million) By Country (2018-2022)
Table 23 Asia Pacific Construction Insurance Revenue (USD Million) By Type (2018-2022)
Table 24 Asia Pacific Construction Insurance Revenue (USD Million) By Applications (2018-2022)
Table 25 South America Construction Insurance Revenue (USD Million) By Country (2018-2022)
Table 26 South America Construction Insurance Revenue (USD Million) By Type (2018-2022)
Table 27 South America Construction Insurance Revenue (USD Million) By Applications (2018-2022)
Table 28 Middle East and Africa Construction Insurance Revenue (USD Million) By Region (2018-2022)
Table 29 Middle East and Africa Construction Insurance Revenue (USD Million) By Type (2018-2022)
Table 30 Middle East and Africa Construction Insurance Revenue (USD Million) By Applications (2018-2022)
Table 31 Financial Analysis
Table 32 Global Construction Insurance Revenue (USD Million) By Type (2023-2030)
Table 33 Global Construction Insurance Revenue Market Share (%) By Type (2023-2030)
Table 34 Global Construction Insurance Revenue (USD Million) By Applications (2023-2030)
Table 35 Global Construction Insurance Revenue Market Share (%) By Applications (2023-2030)
Table 36 Global Construction Insurance Market Revenue (USD Million), And Revenue (USD Million) By Regions (2023-2030)
Table 37 North America Construction Insurance Revenue (USD)By Country (2023-2030)
Table 38 North America Construction Insurance Revenue (USD Million) By Type (2023-2030)
Table 39 North America Construction Insurance Revenue (USD Million) By Applications (2023-2030)
Table 40 Europe Construction Insurance Revenue (USD Million) By Country (2023-2030)
Table 41 Europe Construction Insurance Revenue (USD Million) By Type (2023-2030)
Table 42 Europe Construction Insurance Revenue (USD Million) By Applications (2023-2030)
Table 43 Asia Pacific Construction Insurance Revenue (USD Million) By Country (2023-2030)
Table 44 Asia Pacific Construction Insurance Revenue (USD Million) By Type (2023-2030)
Table 45 Asia Pacific Construction Insurance Revenue (USD Million) By Applications (2023-2030)
Table 46 South America Construction Insurance Revenue (USD Million) By Country (2023-2030)
Table 47 South America Construction Insurance Revenue (USD Million) By Type (2023-2030)
Table 48 South America Construction Insurance Revenue (USD Million) By Applications (2023-2030)
Table 49 Middle East and Africa Construction Insurance Revenue (USD Million) By Region (2023-2030)
Table 50 Middle East and Africa Construction Insurance Revenue (USD Million) By Region (2023-2030)
Table 51 Middle East and Africa Construction Insurance Revenue (USD Million) By Type (2023-2030)
Table 52 Middle East and Africa Construction Insurance Revenue (USD Million) By Applications (2023-2030)
Table 53 Research Programs/Design for This Report
Table 54 Key Data Information from Secondary Sources
Table 55 Key Data Information from Primary Sources
List of Figures
Figure 1 Market Scope
Figure 2 Porter’s Five Forces
Figure 3 Global Construction Insurance Revenue (USD Million) By Type (2018-2022)
Figure 4 Global Construction Insurance Revenue Market Share (%) By Type (2022)
Figure 5 Global Construction Insurance Revenue (USD Million) By Applications (2018-2022)
Figure 6 Global Construction Insurance Revenue Market Share (%) By Applications (2022)
Figure 7 Global Construction Insurance Market Revenue (USD Million) By Regions (2018-2022)
Figure 8 Global Construction Insurance Market Share (%) By Regions (2022)
Figure 9 North America Construction Insurance Revenue (USD Million) By Country (2018-2022)
Figure 10 North America Construction Insurance Revenue (USD Million) By Type (2018-2022)
Figure 11 North America Construction Insurance Revenue (USD Million) By Applications (2018-2022)
Figure 12 Europe Construction Insurance Revenue (USD Million) By Country (2018-2022)
Figure 13 Europe Construction Insurance Revenue (USD Million) By Type (2018-2022)
Figure 14 Europe Construction Insurance Revenue (USD Million) By Applications (2018-2022)
Figure 15 Asia Pacific Construction Insurance Revenue (USD Million) By Country (2018-2022)
Figure 16 Asia Pacific Construction Insurance Revenue (USD Million) By Type (2018-2022)
Figure 17 Asia Pacific Construction Insurance Revenue (USD Million) By Applications (2018-2022)
Figure 18 South America Construction Insurance Revenue (USD Million) By Country (2018-2022)
Figure 19 South America Construction Insurance Revenue (USD Million) By Type (2018-2022)
Figure 20 South America Construction Insurance Revenue (USD Million) By Applications (2018-2022)
Figure 21 Middle East and Africa Construction Insurance Revenue (USD Million) By Region (2018-2022)
Figure 22 Middle East and Africa Construction Insurance Revenue (USD Million) By Type (2018-2022)
Figure 23 Middle East and Africa Construction Insurance Revenue (USD Million) By Applications (2018-2022)
Figure 24 Global Construction Insurance Revenue (USD Million) By Type (2023-2030)
Figure 25 Global Construction Insurance Revenue Market Share (%) By Type (2030)
Figure 26 Global Construction Insurance Revenue (USD Million) By Applications (2023-2030)
Figure 27 Global Construction Insurance Revenue Market Share (%) By Applications (2030)
Figure 28 Global Construction Insurance Market Revenue (USD Million) By Regions (2023-2030)
Figure 29 North America Construction Insurance Revenue (USD Million) By Country (2023-2030)
Figure 30 North America Construction Insurance Revenue (USD Million) By Type (2023-2030)
Figure 31 North America Construction Insurance Revenue (USD Million) By Applications (2023-2030)
Figure 32 Europe Construction Insurance Revenue (USD Million) By Country (2023-2030)
Figure 33 Europe Construction Insurance Revenue (USD Million) By Type (2023-2030)
Figure 34 Europe Construction Insurance Revenue (USD Million) By Applications (2023-2030)
Figure 35 Asia Pacific Construction Insurance Revenue (USD Million) By Country (2023-2030)
Figure 36 Asia Pacific Construction Insurance Revenue (USD Million) By Type (2023-2030)
Figure 37 Asia Pacific Construction Insurance Revenue (USD Million) By Applications (2023-2030)
Figure 38 South America Construction Insurance Revenue (USD Million) By Country (2023-2030)
Figure 39 South America Construction Insurance Revenue (USD Million) By Type (2023-2030)
Figure 40 South America Construction Insurance Revenue (USD Million) By Applications (2023-2030)
Figure 41 Middle East and Africa Construction Insurance Revenue (USD Million) By Region (2023-2030)
Figure 42 Middle East and Africa Construction Insurance Revenue (USD Million) By Region (2023-2030)
Figure 43 Middle East and Africa Construction Insurance Revenue (USD Million) By Type (2023-2030)
Figure 44 Middle East and Africa Construction Insurance Revenue (USD Million) By Applications (2023-2030)
Figure 45 Bottom-Up and Top-Down Approaches for This Report
Figure 46 Data Triangulation
