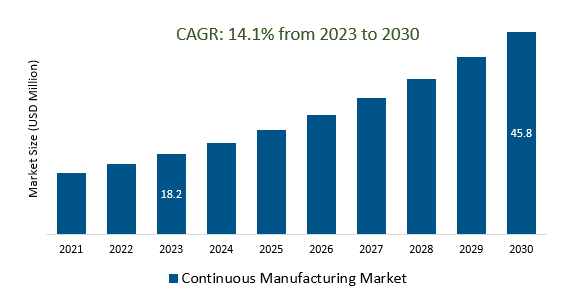
The global Continuous Manufacturing Market Size is estimated to be US$ 18.2 Billion in 2023 and is poised to register 14.10% growth over the forecast period from 2023 to 2030 to reach US $ 45.8 billion in 2030.
The Continuous Manufacturing Market is gaining momentum due to factors such as cost efficiency, quality assurance, regulatory support, shorter time-to-market, scalability, and environmental sustainability. The pharmaceutical industry is increasingly adopting continuous manufacturing for high-value and small-batch drugs. Digital technologies like Industry 4.0 and the Industrial Internet of Things are being integrated into continuous manufacturing processes. Advanced process control techniques like model predictive control and machine learning are becoming more prevalent. Continuous manufacturing can also facilitate personalized medicine, biopharmaceuticals, and food and chemical industries. The market is experiencing global growth, with increasing adoption in regions like North America, Europe, and Asia-Pacific. Collaborative partnerships and regulatory harmonization are also driving growth. Education and training programs are also essential for professionals to effectively operate and manage continuous manufacturing processes.
Cost Efficiency Through Continuous Manufacturing is attracting a wide customer base.
Continuous manufacturing is gaining significant traction in the market due to its cost-efficient nature. This innovative approach to production allows for streamlined and uninterrupted processes, reducing downtime and material wastage. As a result, it has become increasingly attractive to a diverse range of customers across various industries. Continuous manufacturing not only lowers operational costs but also enhances product quality and consistency. This trend is poised to reshape the manufacturing landscape, as companies increasingly recognize the potential for substantial savings and improved competitiveness by adopting this efficient and sustainable manufacturing method.
Advantages of Continuous Manufacturing like Shorter Time-to-Market and Scalability is creating a demand in the market.
Continuous manufacturing offers several advantages, driving increased demand in the market. Firstly, it significantly reduces time-to-market for pharmaceuticals and other products, as it eliminates the need for batch processing and the associated downtime between batches. This accelerated production timeline can be a game-changer in competitive industries. Moreover, scalability is a crucial factor that attracts businesses to continuous manufacturing. It allows for seamless adjustments in production volumes, making it easier to meet fluctuating market demands without incurring substantial costs or operational disruptions. This flexibility in scaling up or down provides a distinct competitive edge in today's fast-paced markets. Furthermore, continuous manufacturing also enhances product quality and consistency, reducing the risk of batch variations and ensuring a higher level of quality control. These advantages not only improve efficiency but also boost the overall competitiveness of companies adopting this innovative approach, explaining the growing demand in the continuous manufacturing market.
Harnessing Industry 4.0 and IIoT Integration for Automation and Real-time Insights is boosting the market.
The integration of Industry 4.0 technologies and Industrial Internet of Things (IIoT) into manufacturing processes has sparked a significant transformation in the Continuous Manufacturing Market. This synergy allows for the automation of production lines, enabling streamlined and efficient operations. Real-time data collection and analysis through IIoT devices provide manufacturers with invaluable insights into their processes, helping them make informed decisions promptly. As a result, product quality and consistency have improved, reducing waste and production costs. This Industry 4.0 and IIoT integration is driving the continuous manufacturing market forward, paving the way for more agile and responsive production systems in various industries.
Market Share Analysis:
Small molecules are the most dominant type of continuous manufacturing.
Continuous manufacturing is a prevalent approach in the pharmaceutical industry, primarily dominated by small molecules. Small molecules, organic compounds with molecular weights typically under 900 Daltons, are the most common type of drugs used to combat various diseases, including cancer and cardiovascular conditions. Continuous manufacturing, which eliminates the need for batch operations, offers numerous benefits such as increased productivity, cost reduction, enhanced quality control, and a reduced environmental footprint. Small molecules are particularly well-suited for this method due to their ease of processing compared to larger, more complex molecules like proteins and antibodies.
Continuous Manufacturing Market primarily relies on solid formulations, making it the prevailing choice among pharmaceutical manufacturers.
The approach offers numerous advantages, including consistent product quality, reduced production time, and improved efficiency. Solid formulations, such as tablets and capsules, are easier to handle and package, streamlining the entire production process. Additionally, they boast longer shelf lives and enhanced stability, ensuring product integrity throughout its lifecycle. The popularity of solid formulations underscores their reliability and cost-effectiveness, positioning them as the preferred method in the ever-evolving landscape of continuous manufacturing. This dominance reflects the industry's commitment to innovation and sustainability, promoting a more robust and efficient pharmaceutical production ecosystem.
In the realm of continuous manufacturing, finished formulation manufacturing stands out as the primary and most prevalent application.
The process involves the transformation of active pharmaceutical ingredients (APIs) into the ultimate drug products, encompassing tablets, capsules, and liquid medications. Continuous manufacturing offers substantial benefits compared to conventional batch manufacturing, including heightened operational efficiency, cost savings, elevated product quality, enhanced process monitoring, and a shorter time to market. This dominance of finished formulation manufacturing underscores its pivotal role in advancing pharmaceutical production methods.
Contract manufacturers (CMOs) are the most dominant in the continuous manufacturing market by mode.
Contract manufacturers (CMOs) hold a dominant position in the continuous manufacturing market, specializing in the production of pharmaceutical and biopharmaceutical products for other companies. Their expertise in implementing and operating continuous manufacturing processes has made them increasingly valuable to pharmaceutical and biopharmaceutical firms. CMOs offer benefits such as enhanced flexibility, scalability, cost reduction, improved quality control, and quicker time-to-market, making them a preferred choice for outsourcing manufacturing needs in these industries.
Commercial scale is the most dominant in the Continuous Manufacturing Market
Commercial scale continuous manufacturing is the prevailing trend in the pharmaceutical industry, involving the use of continuous processes to produce drugs and pharmaceutical products on a large scale to meet patient and healthcare demands. This approach offers numerous benefits, such as heightened efficiency, cost reduction, enhanced product quality, minimized waste, and reduced environmental impact, making it a favoured choice in pharmaceutical production due to its potential to streamline operations and deliver higher-quality products while maintaining environmental responsibility.
Integrated systems are the prevailing product in the continuous manufacturing market.
The systems consolidate multiple continuous manufacturing processes into a single, efficient system. These systems offer several advantages, including a notable reduction in production time for various products, enhanced product quality through minimized human error and contamination risks, improved manufacturing efficiency by reducing manual intervention and material handling, and decreased overall manufacturing costs by reducing labour, equipment, and space requirements. Integrated systems have become pivotal in revolutionizing manufacturing by streamlining processes and optimizing resource utilization.
Continuous Manufacturing Market Segmentation
By Type
- Large Molecules
- Small Molecules
By Formulation
- Solid Formulation
- Liquid & Semi-solid Formulation
By Application
- Finished Formulation Manufacturing
- API Manufacturing
By Mode
- In-house Manufacturing
- Contract Manufacturers
By Scale
- Preclinical
- Clinical
- Commercial
By Product
- Integrated Systems
- Semi-continuous Systems
- Continuous Blenders
- Continuous Granulators
- Continuous Coaters
- Continuous Compressors
- Continuous Dryers
- Others
By Region
- North America (United States, Canada, Mexico)
- Europe (Germany, France, United Kingdom, Spain, Italy, Others)
- Asia Pacific (China, India, Japan, South Korea, Australia, Others)
- Latin America (Brazil, Argentina, Others)
- Middle East and Africa (Saudi Arabia, UAE, Kuwait, Other Middle East, South Africa, Nigeria, Other Africa)
Continuous Manufacturing Market Players Covered
- Siemens Healthineers
- GEA Group AG
- Robert Bosch GmbH
- Glatt GmbH
- Thermo Fisher Scientific
- Munson Machinery Co. Inc.
- Coperion GmbH
- Scott Equipment Company
- HOSOKAWA MICRON CORP.
- Sturtevant Inc
- L.B Bohle
Continuous Manufacturing Market Outlook 2023
1 Market Overview
1.1 Introduction to the Continuous Manufacturing Market
1.2 Scope of the Study
1.3 Research Objective
1.3.1 Key Market Scope and Segments
1.3.2 Players Covered
1.3.3 Years Considered
2 Executive Summary
2.1 2023 Continuous Manufacturing Industry- Market Statistics
3 Market Dynamics
3.1 Market Drivers
3.2 Market Challenges
3.3 Market Opportunities
3.4 Market Trends
4 Market Factor Analysis
4.1 Porter’s Five Forces
4.2 Market Entropy
4.2.1 Global Continuous Manufacturing Market Companies with Area Served
4.2.2 Products Offerings Global Continuous Manufacturing Market
5 COVID-19 Impact Analysis and Outlook Scenarios
5.1.1 Covid-19 Impact Analysis
5.1.2 Post-COVID-19 Scenario- Low Growth Case
5.1.3 Post-COVID-19 Scenario- Reference Growth Case
5.1.4 Post-COVID-19 Scenario- Low Growth Case
6 Global Continuous Manufacturing Market Trends
6.1 Global Continuous Manufacturing Revenue (USD Million) and CAGR (%) by Type (2018-2030)
6.2 Global Continuous Manufacturing Revenue (USD Million) and CAGR (%) by Applications (2018-2030)
6.3 Global Continuous Manufacturing Revenue (USD Million) and CAGR (%) by Regions (2018-2030)
7 Global Continuous Manufacturing Market Revenue (USD Million) by Type, and Applications (2018-2022)
7.1 Global Continuous Manufacturing Revenue (USD Million) by Type (2018-2022)
7.1.1 Global Continuous Manufacturing Revenue (USD Million), Market Share (%) by Type (2018-2022)
7.2 Global Continuous Manufacturing Revenue (USD Million) by Applications (2018-2022)
7.2.1 Global Continuous Manufacturing Revenue (USD Million), Market Share (%) by Applications (2018-2022)
8 Global Continuous Manufacturing Development Regional Status and Outlook
8.1 Global Continuous Manufacturing Revenue (USD Million) By Regions (2018-2022)
8.2 North America Continuous Manufacturing Revenue (USD Million) by Type, and Application (2018-2022)
8.2.1 North America Continuous Manufacturing Revenue (USD Million) by Country (2018-2022)
8.2.2 North America Continuous Manufacturing Revenue (USD Million) by Type (2018-2022)
8.2.3 North America Continuous Manufacturing Revenue (USD Million) by Applications (2018-2022)
8.3 Europe Continuous Manufacturing Revenue (USD Million), by Type, and Applications (USD Million) (2018-2022)
8.3.1 Europe Continuous Manufacturing Revenue (USD Million), by Country (2018-2022)
8.3.2 Europe Continuous Manufacturing Revenue (USD Million) by Type (2018-2022)
8.3.3 Europe Continuous Manufacturing Revenue (USD Million) by Applications (2018-2022)
8.4 Asia Pacific Continuous Manufacturing Revenue (USD Million), and Revenue (USD Million) by Type, and Applications (2018-2022)
8.4.1 Asia Pacific Continuous Manufacturing Revenue (USD Million) by Country (2018-2022)
8.4.2 Asia Pacific Continuous Manufacturing Revenue (USD Million) by Type (2018-2022)
8.4.3 Asia Pacific Continuous Manufacturing Revenue (USD Million) by Applications (2018-2022)
8.5 South America Continuous Manufacturing Revenue (USD Million), by Type, and Applications (2018-2022)
8.5.1 South America Continuous Manufacturing Revenue (USD Million), by Country (2018-2022)
8.5.2 South America Continuous Manufacturing Revenue (USD Million) by Type (2018-2022)
8.5.3 South America Continuous Manufacturing Revenue (USD Million) by Applications (2018-2022)
8.6 Middle East and Africa Continuous Manufacturing Revenue (USD Million), by Type, Technology, Application, Thickness (2018-2022)
8.6.1 Middle East and Africa Continuous Manufacturing Revenue (USD Million) by Country (2018-2022)
8.6.2 Middle East and Africa Continuous Manufacturing Revenue (USD Million) by Type (2018-2022)
8.6.3 Middle East and Africa Continuous Manufacturing Revenue (USD Million) by Applications (2018-2022)
9 Company Profiles
10 Global Continuous Manufacturing Market Revenue (USD Million), by Type, and Applications (2023-2030)
10.1 Global Continuous Manufacturing Revenue (USD Million) and Market Share (%) by Type (2023-2030)
10.1.1 Global Continuous Manufacturing Revenue (USD Million), and Market Share (%) by Type (2023-2030)
10.2 Global Continuous Manufacturing Revenue (USD Million) and Market Share (%) by Applications (2023-2030)
10.2.1 Global Continuous Manufacturing Revenue (USD Million), and Market Share (%) by Applications (2023-2030)
11 Global Continuous Manufacturing Development Regional Status and Outlook Forecast
11.1 Global Continuous Manufacturing Revenue (USD Million) By Regions (2023-2030)
11.2 North America Continuous Manufacturing Revenue (USD Million) by Type, and Applications (2023-2030)
11.2.1 North America Continuous Manufacturing Revenue (USD) Million by Country (2023-2030)
11.2.2 North America Continuous Manufacturing Revenue (USD Million), by Type (2023-2030)
11.2.3 North America Continuous Manufacturing Revenue (USD Million), Market Share (%) by Applications (2023-2030)
11.3 Europe Continuous Manufacturing Revenue (USD Million), by Type, and Applications (2023-2030)
11.3.1 Europe Continuous Manufacturing Revenue (USD Million), by Country (2023-2030)
11.3.2 Europe Continuous Manufacturing Revenue (USD Million), by Type (2023-2030)
11.3.3 Europe Continuous Manufacturing Revenue (USD Million), by Applications (2023-2030)
11.4 Asia Pacific Continuous Manufacturing Revenue (USD Million) by Type, and Applications (2023-2030)
11.4.1 Asia Pacific Continuous Manufacturing Revenue (USD Million), by Country (2023-2030)
11.4.2 Asia Pacific Continuous Manufacturing Revenue (USD Million), by Type (2023-2030)
11.4.3 Asia Pacific Continuous Manufacturing Revenue (USD Million), by Applications (2023-2030)
11.5 South America Continuous Manufacturing Revenue (USD Million), by Type, and Applications (2023-2030)
11.5.1 South America Continuous Manufacturing Revenue (USD Million), by Country (2023-2030)
11.5.2 South America Continuous Manufacturing Revenue (USD Million), by Type (2023-2030)
11.5.3 South America Continuous Manufacturing Revenue (USD Million), by Applications (2023-2030)
11.6 Middle East and Africa Continuous Manufacturing Revenue (USD Million), by Type, and Applications (2023-2030)
11.6.1 Middle East and Africa Continuous Manufacturing Revenue (USD Million), by Region (2023-2030)
11.6.2 Middle East and Africa Continuous Manufacturing Revenue (USD Million), by Type (2023-2030)
11.6.3 Middle East and Africa Continuous Manufacturing Revenue (USD Million), by Applications (2023-2030)
12 Methodology and Data Sources
12.1 Methodology/Research Approach
12.1.1 Research Programs/Design
12.1.2 Market Size Estimation
12.1.3 Market Breakdown and Data Triangulation
12.2 Data Sources
12.2.1 Secondary Sources
12.2.2 Primary Sources
12.3 Disclaimer
List of Tables
Table 1 Market Segmentation Analysis
Table 2 Global Continuous Manufacturing Market Companies with Areas Served
Table 3 Products Offerings Global Continuous Manufacturing Market
Table 4 Low Growth Scenario Forecasts
Table 5 Reference Case Growth Scenario
Table 6 High Growth Case Scenario
Table 7 Global Continuous Manufacturing Revenue (USD Million) And CAGR (%) By Type (2018-2030)
Table 8 Global Continuous Manufacturing Revenue (USD Million) And CAGR (%) By Applications (2018-2030)
Table 9 Global Continuous Manufacturing Revenue (USD Million) And CAGR (%) By Regions (2018-2030)
Table 10 Global Continuous Manufacturing Revenue (USD Million) By Type (2018-2022)
Table 11 Global Continuous Manufacturing Revenue Market Share (%) By Type (2018-2022)
Table 12 Global Continuous Manufacturing Revenue (USD Million) By Applications (2018-2022)
Table 13 Global Continuous Manufacturing Revenue Market Share (%) By Applications (2018-2022)
Table 14 Global Continuous Manufacturing Market Revenue (USD Million) By Regions (2018-2022)
Table 15 Global Continuous Manufacturing Market Share (%) By Regions (2018-2022)
Table 16 North America Continuous Manufacturing Revenue (USD Million) By Country (2018-2022)
Table 17 North America Continuous Manufacturing Revenue (USD Million) By Type (2018-2022)
Table 18 North America Continuous Manufacturing Revenue (USD Million) By Applications (2018-2022)
Table 19 Europe Continuous Manufacturing Revenue (USD Million) By Country (2018-2022)
Table 20 Europe Continuous Manufacturing Revenue (USD Million) By Type (2018-2022)
Table 21 Europe Continuous Manufacturing Revenue (USD Million) By Applications (2018-2022)
Table 22 Asia Pacific Continuous Manufacturing Revenue (USD Million) By Country (2018-2022)
Table 23 Asia Pacific Continuous Manufacturing Revenue (USD Million) By Type (2018-2022)
Table 24 Asia Pacific Continuous Manufacturing Revenue (USD Million) By Applications (2018-2022)
Table 25 South America Continuous Manufacturing Revenue (USD Million) By Country (2018-2022)
Table 26 South America Continuous Manufacturing Revenue (USD Million) By Type (2018-2022)
Table 27 South America Continuous Manufacturing Revenue (USD Million) By Applications (2018-2022)
Table 28 Middle East and Africa Continuous Manufacturing Revenue (USD Million) By Region (2018-2022)
Table 29 Middle East and Africa Continuous Manufacturing Revenue (USD Million) By Type (2018-2022)
Table 30 Middle East and Africa Continuous Manufacturing Revenue (USD Million) By Applications (2018-2022)
Table 31 Financial Analysis
Table 32 Global Continuous Manufacturing Revenue (USD Million) By Type (2023-2030)
Table 33 Global Continuous Manufacturing Revenue Market Share (%) By Type (2023-2030)
Table 34 Global Continuous Manufacturing Revenue (USD Million) By Applications (2023-2030)
Table 35 Global Continuous Manufacturing Revenue Market Share (%) By Applications (2023-2030)
Table 36 Global Continuous Manufacturing Market Revenue (USD Million), And Revenue (USD Million) By Regions (2023-2030)
Table 37 North America Continuous Manufacturing Revenue (USD)By Country (2023-2030)
Table 38 North America Continuous Manufacturing Revenue (USD Million) By Type (2023-2030)
Table 39 North America Continuous Manufacturing Revenue (USD Million) By Applications (2023-2030)
Table 40 Europe Continuous Manufacturing Revenue (USD Million) By Country (2023-2030)
Table 41 Europe Continuous Manufacturing Revenue (USD Million) By Type (2023-2030)
Table 42 Europe Continuous Manufacturing Revenue (USD Million) By Applications (2023-2030)
Table 43 Asia Pacific Continuous Manufacturing Revenue (USD Million) By Country (2023-2030)
Table 44 Asia Pacific Continuous Manufacturing Revenue (USD Million) By Type (2023-2030)
Table 45 Asia Pacific Continuous Manufacturing Revenue (USD Million) By Applications (2023-2030)
Table 46 South America Continuous Manufacturing Revenue (USD Million) By Country (2023-2030)
Table 47 South America Continuous Manufacturing Revenue (USD Million) By Type (2023-2030)
Table 48 South America Continuous Manufacturing Revenue (USD Million) By Applications (2023-2030)
Table 49 Middle East and Africa Continuous Manufacturing Revenue (USD Million) By Region (2023-2030)
Table 50 Middle East and Africa Continuous Manufacturing Revenue (USD Million) By Region (2023-2030)
Table 51 Middle East and Africa Continuous Manufacturing Revenue (USD Million) By Type (2023-2030)
Table 52 Middle East and Africa Continuous Manufacturing Revenue (USD Million) By Applications (2023-2030)
Table 53 Research Programs/Design for This Report
Table 54 Key Data Information from Secondary Sources
Table 55 Key Data Information from Primary Sources
List of Figures
Figure 1 Market Scope
Figure 2 Porter’s Five Forces
Figure 3 Global Continuous Manufacturing Revenue (USD Million) By Type (2018-2022)
Figure 4 Global Continuous Manufacturing Revenue Market Share (%) By Type (2022)
Figure 5 Global Continuous Manufacturing Revenue (USD Million) By Applications (2018-2022)
Figure 6 Global Continuous Manufacturing Revenue Market Share (%) By Applications (2022)
Figure 7 Global Continuous Manufacturing Market Revenue (USD Million) By Regions (2018-2022)
Figure 8 Global Continuous Manufacturing Market Share (%) By Regions (2022)
Figure 9 North America Continuous Manufacturing Revenue (USD Million) By Country (2018-2022)
Figure 10 North America Continuous Manufacturing Revenue (USD Million) By Type (2018-2022)
Figure 11 North America Continuous Manufacturing Revenue (USD Million) By Applications (2018-2022)
Figure 12 Europe Continuous Manufacturing Revenue (USD Million) By Country (2018-2022)
Figure 13 Europe Continuous Manufacturing Revenue (USD Million) By Type (2018-2022)
Figure 14 Europe Continuous Manufacturing Revenue (USD Million) By Applications (2018-2022)
Figure 15 Asia Pacific Continuous Manufacturing Revenue (USD Million) By Country (2018-2022)
Figure 16 Asia Pacific Continuous Manufacturing Revenue (USD Million) By Type (2018-2022)
Figure 17 Asia Pacific Continuous Manufacturing Revenue (USD Million) By Applications (2018-2022)
Figure 18 South America Continuous Manufacturing Revenue (USD Million) By Country (2018-2022)
Figure 19 South America Continuous Manufacturing Revenue (USD Million) By Type (2018-2022)
Figure 20 South America Continuous Manufacturing Revenue (USD Million) By Applications (2018-2022)
Figure 21 Middle East and Africa Continuous Manufacturing Revenue (USD Million) By Region (2018-2022)
Figure 22 Middle East and Africa Continuous Manufacturing Revenue (USD Million) By Type (2018-2022)
Figure 23 Middle East and Africa Continuous Manufacturing Revenue (USD Million) By Applications (2018-2022)
Figure 24 Global Continuous Manufacturing Revenue (USD Million) By Type (2023-2030)
Figure 25 Global Continuous Manufacturing Revenue Market Share (%) By Type (2030)
Figure 26 Global Continuous Manufacturing Revenue (USD Million) By Applications (2023-2030)
Figure 27 Global Continuous Manufacturing Revenue Market Share (%) By Applications (2030)
Figure 28 Global Continuous Manufacturing Market Revenue (USD Million) By Regions (2023-2030)
Figure 29 North America Continuous Manufacturing Revenue (USD Million) By Country (2023-2030)
Figure 30 North America Continuous Manufacturing Revenue (USD Million) By Type (2023-2030)
Figure 31 North America Continuous Manufacturing Revenue (USD Million) By Applications (2023-2030)
Figure 32 Europe Continuous Manufacturing Revenue (USD Million) By Country (2023-2030)
Figure 33 Europe Continuous Manufacturing Revenue (USD Million) By Type (2023-2030)
Figure 34 Europe Continuous Manufacturing Revenue (USD Million) By Applications (2023-2030)
Figure 35 Asia Pacific Continuous Manufacturing Revenue (USD Million) By Country (2023-2030)
Figure 36 Asia Pacific Continuous Manufacturing Revenue (USD Million) By Type (2023-2030)
Figure 37 Asia Pacific Continuous Manufacturing Revenue (USD Million) By Applications (2023-2030)
Figure 38 South America Continuous Manufacturing Revenue (USD Million) By Country (2023-2030)
Figure 39 South America Continuous Manufacturing Revenue (USD Million) By Type (2023-2030)
Figure 40 South America Continuous Manufacturing Revenue (USD Million) By Applications (2023-2030)
Figure 41 Middle East and Africa Continuous Manufacturing Revenue (USD Million) By Region (2023-2030)
Figure 42 Middle East and Africa Continuous Manufacturing Revenue (USD Million) By Region (2023-2030)
Figure 43 Middle East and Africa Continuous Manufacturing Revenue (USD Million) By Type (2023-2030)
Figure 44 Middle East and Africa Continuous Manufacturing Revenue (USD Million) By Applications (2023-2030)
Figure 45 Bottom-Up and Top-Down Approaches For This Report
Figure 46 Data Triangulation
