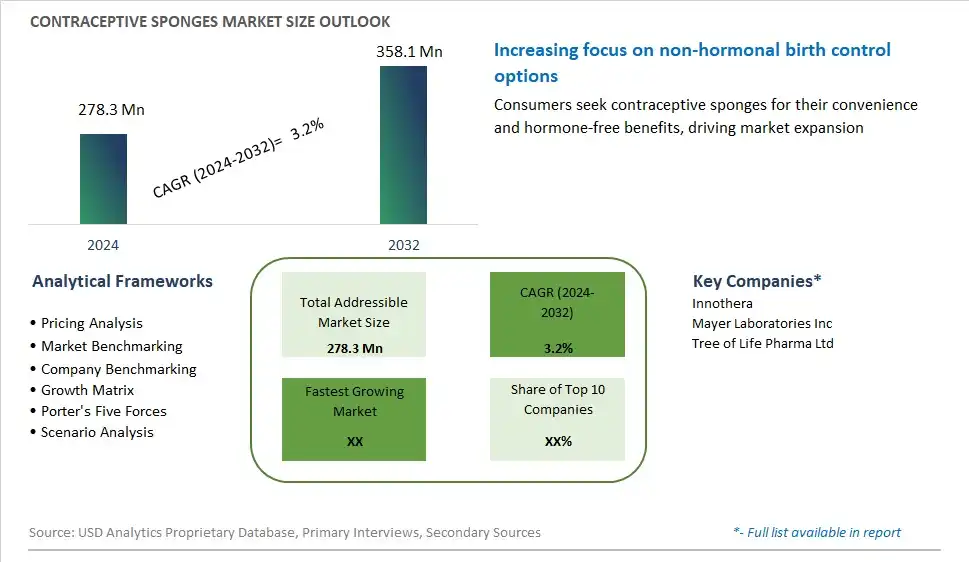
Global Contraceptive Sponges Market Size is valued at $278.3 Million in 2024 and is forecast to register a growth rate (CAGR) of 3.2% to reach $358.1 Million by 2032.
The global Contraceptive Sponges Market Comprehensive Study analyzes and forecasts the market size across 6 regions and 24 countries for diverse segments -By Type (Ultrathin, Ordinary), By Distribution Channel (Pharmacies, Online Stores, Others)
An Introduction to Contraceptive Sponges Market
In 2024, the contraceptive sponge market continues to serve as a popular non-hormonal birth control option for individuals seeking effective and discreet contraception. Contraceptive sponges are soft, disposable devices made from polyurethane foam that are inserted into the vagina before intercourse to prevent pregnancy by blocking sperm from entering the cervix. They are preferred by some users for their convenience, ease of use, and lack of systemic side effects commonly associated with hormonal contraceptives. The market for contraceptive sponges is driven by factors such as increasing awareness about sexual health and family planning, rising demand for non-hormonal birth control options, and the availability of over-the-counter contraceptive products. Manufacturers are focusing on product innovation, improving efficacy, and enhancing user experience by introducing features such as ergonomic designs, hypoallergenic materials, and enhanced spermicide formulations. Additionally, the market benefits from initiatives to promote sexual education, access to contraception, and reproductive health services, contributing to the overall growth and acceptance of contraceptive sponges as a safe and reliable birth control method.
Contraceptive Sponges Competitive Landscape
The market report analyses the leading companies in the industry including Innothera, Mayer Laboratories Inc, Tree of Life Pharma Ltd, and Others.
Contraceptive Sponges Market Dynamics
Contraceptive Sponges Market Trend: Growing Demand for Hormone-Free Contraception
The most prominent market trend for Contraceptive Sponges is the growing demand for hormone-free contraception, driven by increasing awareness of the potential side effects associated with hormonal birth control methods and the desire for non-invasive alternatives. Contraceptive sponges offer a hormone-free option for individuals seeking effective contraception without the use of synthetic hormones. This trend aligns with the broader movement towards natural and holistic approaches to health and wellness, as consumers prioritize products that are perceived as safer, gentler, and more aligned with their lifestyle preferences.
Market Driver: Focus on Female Empowerment and Reproductive Autonomy
A significant market driver for Contraceptive Sponges is the focus on female empowerment and reproductive autonomy, driven by changing societal attitudes towards women's health and decision-making autonomy. Contraceptive sponges provide women with a non-prescription, over-the-counter contraceptive option that they can use discreetly and independently, without requiring a visit to a healthcare provider. This driver is reinforced by efforts to promote reproductive rights, access to contraception, and education about sexual health, empowering women to take control of their reproductive choices and make informed decisions about their bodies and futures.
Market Opportunity: Innovation in Product Design and Marketing
An opportunity in the Contraceptive Sponges market lies in innovation in product design and marketing strategies to attract and retain customers, particularly younger demographics and those seeking convenience and ease of use. Companies can explore opportunities to enhance the design, efficacy, and user experience of contraceptive sponges through innovations such as improved materials, ergonomic shapes, and enhanced applicators. Additionally, there's potential to leverage digital marketing channels, social media influencers, and online platforms to raise awareness, educate consumers, and destigmatize conversations around contraception and sexual health. By offering innovative and user-friendly contraceptive sponge options that resonate with modern consumers' preferences and values, companies can capitalize on the growing demand for hormone-free contraception and differentiate themselves in the market.
Contraceptive Sponges Market Share Analysis: Ordinary held the dominant market share in 2024
Ordinary contraceptive sponges represent the largest segment in the contraceptive sponges market due to their widespread acceptance and ease of use. These sponges are typically more cost-effective and readily available compared to their ultrathin counterparts, making them accessible to a larger demographic. Ordinary sponges offer reliable contraceptive efficacy by combining a physical barrier with spermicide, providing a dual mechanism of action that appeals to users seeking non-hormonal birth control options. Their simplicity in application and removal, coupled with the absence of hormonal side effects, makes them a popular choice among women seeking over-the-counter contraceptive solutions. Furthermore, the familiarity and proven track record of ordinary sponges in preventing pregnancy contribute to their continued dominance in the market. As awareness about contraceptive options grows and accessibility improves, ordinary contraceptive sponges are to maintain their leading position, driven by their practicality, affordability, and effectiveness in contraception.
Contraceptive Sponges Market Share Analysis: Online Stores market is poised to register the fastest growth rae over the forecast period to 2032
Online stores are the fastest growing segment in the contraceptive sponges market, driven by the increasing shift towards digital shopping and the convenience it offers. The rise of e-commerce platforms has made it easier for consumers to access a wide range of contraceptive products discreetly and efficiently, without the need to visit a physical store. This convenience is particularly appealing for products related to personal health and contraception, where privacy is a significant concern for many buyers. Additionally, online stores often provide detailed product information, user reviews, and competitive pricing, enabling consumers to make informed purchasing decisions. The COVID-19 pandemic has further accelerated the adoption of online shopping as people sought to minimize in-person interactions. Furthermore, the availability of subscription services and automatic reordering options on e-commerce platforms ensures a steady supply of contraceptive sponges, enhancing user adherence and satisfaction. As digital literacy and internet penetration continue to grow globally, the online stores segment is poised for substantial growth, reshaping the distribution landscape of contraceptive sponges.
Contraceptive Sponges Market Segmentation
By Type
Ultrathin
Ordinary
By Distribution Channel
Pharmacies
Online Stores
Others
Countries Analyzed
North America (US, Canada, Mexico)
Europe (Germany, UK, France, Spain, Italy, Russia, Rest of Europe)
Asia Pacific (China, India, Japan, South Korea, Australia, South East Asia, Rest of Asia)
South America (Brazil, Argentina, Rest of South America)
Middle East and Africa (Saudi Arabia, UAE, Rest of Middle East, South Africa, Egypt, Rest of Africa)
Contraceptive Sponges Companies Profiled in the Study
Innothera
Mayer Laboratories Inc
Tree of Life Pharma Ltd
*- List Not Exhaustive
Chapter 1. TABLE OF CONTENTS
Chapter 2. Introduction to Contraceptive Sponges Market
2.1. Market Overview
2.2. Key Statistics and Report Highlights
2.3. Scope of the Comprehensive Study
2.3.1. Market Definition
2.3.2 Countries and Regions Covered
2.3.3 Research Objective
2.3.4 Units, Currency, and Conversions
2.3.5 Industry Value Chain
2.4. Key Market Segments
2.5. Key Companies
2.6. Study Period
Chapter 3. Strategic Analysis Review
3.1. Contraceptive Sponges Pricing Analysis and Forecast
3.2. Porter’s Five Forces
3.3. Market Ecosystem
3.4. SWOT Analysis
3.5. Regulatory Scenario
3.3. Effects of Inflation, Russia-Ukraine War, moderating economic growth, and other macroeconomic factors
Chapter 4. Competitive Landscape
4.1. Market Share Analysis
4.1.1. Global Contraceptive Sponges Market Share by Company, 2023
4.1.2. Product Offerings of Leading Contraceptive Sponges Companies
4.2. Market Entropy
4.2.1. New Product Launches in the Industry
4.2.2. Mergers, Acquisitions, Joint ventures, and Partnerships
4.3. Key Strategies and Best Practices
Chapter 5. Global Market Projections: Best, Reference, and Low Case Scenarios
5.1. Growth Analysis- Case Scenario Definitions
5.2. Low Growth Case Scenario Forecasts
5.3. Reference Growth Case Scenario Forecasts
5.4. High Growth Case Scenario Forecasts
Chapter 6. Market Dynamics
6.1. Contraceptive Sponges Market Drivers
6.2. Contraceptive Sponges Market Challenges
6.6. Contraceptive Sponges Market Opportunities
6.4. Contraceptive Sponges Market Trends
Chapter 7. Global Contraceptive Sponges Market Outlook Trends
7.1. Global Contraceptive Sponges Revenue (USD Million) and CAGR (%) by Type (2021-2032)
7.2. Global Contraceptive Sponges Revenue (USD Million) and CAGR (%) by Application (2021-2032)
7.3. Global Contraceptive Sponges Revenue (USD Million) and CAGR (%) by Product (2021-2032)
By Type
Ultrathin
Ordinary
By Distribution Channel
Pharmacies
Online Stores
Others
Chapter 8. Global Contraceptive Sponges Regional Analysis and Outlook
8.1. Global Contraceptive Sponges Revenue (USD Million) By Regions (2021- 2032)
8.2. North America Contraceptive Sponges Revenue (USD Million) by Country (2021-2032)
8.2.1. United States Contraceptive Sponges Regional Analysis and Outlook
8.2.2. Canada Contraceptive Sponges Regional Analysis and Outlook
8.2.3. Mexico Contraceptive Sponges Regional Analysis and Outlook
8.3. Europe Contraceptive Sponges Revenue (USD Million), by Country (2021-2032)
8.3.1. Germany Contraceptive Sponges Regional Analysis and Outlook
8.3.2. France Contraceptive Sponges Regional Analysis and Outlook
8.3.3. United Kingdom Contraceptive Sponges Regional Analysis and Outlook
8.3.4. Spain Contraceptive Sponges Regional Analysis and Outlook
8.3.5. Italy Contraceptive Sponges Regional Analysis and Outlook
8.3.6. Russia Contraceptive Sponges Regional Analysis and Outlook
8.3.7. Rest of Europe Contraceptive Sponges Regional Analysis and Outlook
8.4. Asia Pacific Contraceptive Sponges Revenue (USD Million) by Country (2021-2032)
8.4.1. China Contraceptive Sponges Regional Analysis and Outlook
8.4.2. Japan Contraceptive Sponges Regional Analysis and Outlook
8.4.3. India Contraceptive Sponges Regional Analysis and Outlook
8.4.4. South Korea Contraceptive Sponges Regional Analysis and Outlook
8.4.5. Australia Contraceptive Sponges Regional Analysis and Outlook
8.4.6. South East Asia Contraceptive Sponges Regional Analysis and Outlook
8.4.7. Rest of Asia Pacific Contraceptive Sponges Regional Analysis and Outlook
8.5. South America Contraceptive Sponges Revenue (USD Million), by Country (2021-2032)
8.5.1. Brazil Contraceptive Sponges Regional Analysis and Outlook
8.5.2. Argentina Contraceptive Sponges Regional Analysis and Outlook
8.5.3. Rest of South America Contraceptive Sponges Regional Analysis and Outlook
8.6. Middle East and Africa Contraceptive Sponges Revenue (USD Million) by Country (2021-2032)
8.6.1. Middle East Contraceptive Sponges Regional Analysis and Outlook
8.6.2. Africa Contraceptive Sponges Regional Analysis and Outlook
Chapter 9. North America Contraceptive Sponges Analysis and Outlook
9.1. North America Contraceptive Sponges Revenue (USD Million) by Segments (2021-2032)
9.1.1. North America Contraceptive Sponges Revenue (USD Million) by Type (2021-2032)
9.1.2. North America Contraceptive Sponges Revenue (USD Million) by Application (2021-2032)
9.1.3. North America Contraceptive Sponges Revenue (USD Million) by Product (2021-2032)
By Type
Ultrathin
Ordinary
By Distribution Channel
Pharmacies
Online Stores
Others
Chapter 10. Europe Contraceptive Sponges Analysis and Outlook
10.1. Europe Contraceptive Sponges Revenue (USD Million), by Segments (USD Million) (2021-2032)
10.1.1. Europe Contraceptive Sponges Revenue (USD Million) by Type (2021-2032)
10.1.2. Europe Contraceptive Sponges Revenue (USD Million) by Application (2021-2032)
10.1.3. Europe Contraceptive Sponges Revenue (USD Million) by Product (2021-2032)
By Type
Ultrathin
Ordinary
By Distribution Channel
Pharmacies
Online Stores
Others
Chapter 11. Asia Pacific Contraceptive Sponges Analysis and Outlook
11.1. Asia Pacific Contraceptive Sponges Revenue (USD Million), and Revenue (USD Million) by Segments (2021-2032)
11.1.1. Asia Pacific Contraceptive Sponges Revenue (USD Million) by Type (2021-2032)
11.1.2. Asia Pacific Contraceptive Sponges Revenue (USD Million) by Application (2021-2032)
11.1.3. Asia Pacific Contraceptive Sponges Revenue (USD Million) by Product (2021-2032)
By Type
Ultrathin
Ordinary
By Distribution Channel
Pharmacies
Online Stores
Others
Chapter 12. South America Contraceptive Sponges Analysis and Outlook
12.1. South America Contraceptive Sponges Revenue (USD Million), by Segments (2021-2032)
12.1.1. South America Contraceptive Sponges Revenue (USD Million) by Type (2021-2032)
12.1.2. South America Contraceptive Sponges Revenue (USD Million) by Application (2021-2032)
12.1.3. South America Contraceptive Sponges Revenue (USD Million) by Product (2021-2032)
By Type
Ultrathin
Ordinary
By Distribution Channel
Pharmacies
Online Stores
Others
Chapter 13. Middle East and Africa Contraceptive Sponges Analysis and Outlook
13.1. Middle East and Africa Contraceptive Sponges Revenue (USD Million), by Segments (2021-2032)
13.1.1. Middle East and Africa Contraceptive Sponges Revenue (USD Million) by Type (2021-2032)
13.1.2. Middle East and Africa Contraceptive Sponges Revenue (USD Million) by Application (2021-2032)
13.1.3. Middle East and Africa Contraceptive Sponges Revenue (USD Million) by Product (2021-2032)
By Type
Ultrathin
Ordinary
By Distribution Channel
Pharmacies
Online Stores
Others
Chapter 14. Contraceptive Sponges Company Profiles
14.1 Business Overview
14.2 Product Profiles
14.3 SWOT Profiles
14.5 Recent Developments
14.6 Financial Profile
List of Companies
Innothera
Mayer Laboratories Inc
Tree of Life Pharma Ltd
15. Methodology and Data Sources
15.1 Customization Offerings
15.2 Subscription Services
15.3 Related Reports
15.4 Publisher Expertise
LIST OF TABLES
Table 1 Market Segmentation Analysis
Table 2 Global Contraceptive Sponges Market Share of Leading Companies, 2023
Table 3 Product Offerings of Leading Companies
Table 4 Low Growth Scenario Forecasts
Table 5 Reference Case Growth Scenario
Table 6 High Growth Case Scenario
Table 7 Global Contraceptive Sponges Revenue (USD Million) And CAGR (%) By Type (2021-2032)
Table 8 Global Contraceptive Sponges Revenue (USD Million) And CAGR (%) By Application (2021-2032)
Table 9 Global Contraceptive Sponges Revenue (USD Million) And CAGR (%) By Product (2021-2032)
Table 10 Global Contraceptive Sponges Market Revenue (USD Million) By Regions (2021-2032)
Table 11 Global Contraceptive Sponges Market Share (%) By Regions (2021-2032)
Table 12 North America Contraceptive Sponges Revenue (USD Million) By Country (2021-2032)
Table 13 Europe Contraceptive Sponges Revenue (USD Million) By Country (2021-2032)
Table 14 Asia Pacific Contraceptive Sponges Revenue (USD Million) By Country (2021-2032)
Table 15 South America Contraceptive Sponges Revenue (USD Million) By Country (2021-2032)
Table 16 Middle East and Africa Contraceptive Sponges Revenue (USD Million) By Region (2021-2032)
Table 17 North America Contraceptive Sponges Revenue (USD Million) By Type (2021-2032)
Table 18 North America Contraceptive Sponges Revenue (USD Million) By Application (2021-2032)
Table 19 North America Contraceptive Sponges Revenue (USD Million) By Product (2021-2032)
Table 20 Europe Contraceptive Sponges Revenue (USD Million) By Type (2021-2032)
Table 21 Europe Contraceptive Sponges Revenue (USD Million) By Application (2021-2032)
Table 22 Europe Contraceptive Sponges Revenue (USD Million) By Product (2021-2032)
Table 23 Asia Pacific Contraceptive Sponges Revenue (USD Million) By Type (2021-2032)
Table 24 Asia Pacific Contraceptive Sponges Revenue (USD Million) By Application (2021-2032)
Table 25 Asia Pacific Contraceptive Sponges Revenue (USD Million) By Product (2021-2032)
Table 26 South America Contraceptive Sponges Revenue (USD Million) By Type (2021-2032)
Table 27 South America Contraceptive Sponges Revenue (USD Million) By Application (2021-2032)
Table 28 South America Contraceptive Sponges Revenue (USD Million) By Product (2021-2032)
Table 29 Middle East and Africa Contraceptive Sponges Revenue (USD Million) By Type (2021-2032)
Table 30 Middle East and Africa Contraceptive Sponges Revenue (USD Million) By Application (2021-2032)
Table 31 Middle East and Africa Contraceptive Sponges Revenue (USD Million) By Product (2021-2032)
LIST OF FIGURES
Figure 1. Market Scope
Figure 2. Pricing Forecasts Per Unit, 2023- 2032
Figure 3. Porter’s Five Forces
Figure 4. Global Contraceptive Sponges Market Revenue (USD Million) By Regions (2021-2032)
Figure 5. Global Contraceptive Sponges Market Share (%) By Regions (2023)
Figure 6. North America Contraceptive Sponges Revenue (USD Million) By Country (2021-2032)
Figure 7. United States Contraceptive Sponges Revenue (USD Million) By Country (2021-2032)
Figure 8. Canada Contraceptive Sponges Revenue (USD Million) By Country (2021-2032)
Figure 9. Mexico Contraceptive Sponges Revenue (USD Million) By Country (2021-2032)
Figure 10. Europe Contraceptive Sponges Revenue (USD Million) By Country (2021-2032)
Figure 11. Germany Contraceptive Sponges Revenue (USD Million) By Country (2021-2032)
Figure 12. France Contraceptive Sponges Revenue (USD Million) By Country (2021-2032)
Figure 13. United Kingdom Contraceptive Sponges Revenue (USD Million) By Country (2021-2032)
Figure 14. Spain Contraceptive Sponges Revenue (USD Million) By Country (2021-2032)
Figure 15. Italy Contraceptive Sponges Revenue (USD Million) By Country (2021-2032)
Figure 16. Russia Contraceptive Sponges Revenue (USD Million) By Country (2021-2032)
Figure 17. Rest of Europe Contraceptive Sponges Revenue (USD Million) By Country (2021-2032)
Figure 11. Asia Pacific Contraceptive Sponges Revenue (USD Million) By Country (2021-2032)
Figure 12. China Contraceptive Sponges Revenue (USD Million) By Country (2021-2032)
Figure 13. Japan Contraceptive Sponges Revenue (USD Million) By Country (2021-2032)
Figure 14. India Contraceptive Sponges Revenue (USD Million) By Country (2021-2032)
Figure 15. South Korea Contraceptive Sponges Revenue (USD Million) By Country (2021-2032)
Figure 16. Australia Contraceptive Sponges Revenue (USD Million) By Country (2021-2032)
Figure 17. South East Asia Contraceptive Sponges Revenue (USD Million) By Country (2021-2032)
Figure 18. South America Contraceptive Sponges Revenue (USD Million) By Country (2021-2032)
Figure 19. Brazil Contraceptive Sponges Revenue (USD Million) By Country (2021-2032)
Figure 20. Argentina Contraceptive Sponges Revenue (USD Million) By Country (2021-2032)
Figure 21. Rest of Asia Pacific Contraceptive Sponges Revenue (USD Million) By Country (2021-2032)
Figure 22. Middle East and Africa Contraceptive Sponges Revenue (USD Million) By Region (2021-2032)
Figure 23. Saudi Arabia Contraceptive Sponges Revenue (USD Million) By Region (2021-2032)
Figure 24. The UAE Contraceptive Sponges Revenue (USD Million) By Region (2021-2032)
Figure 25. Rest of Middle East Contraceptive Sponges Revenue (USD Million) By Region (2021-2032)
Figure 26. South Africa Contraceptive Sponges Revenue (USD Million) By Region (2021-2032)
Figure 27. Africa Contraceptive Sponges Revenue (USD Million) By Region (2021-2032)
Figure 28. North America Contraceptive Sponges Revenue (USD Million) By Type (2021-2032)
Figure 29. North America Contraceptive Sponges Revenue (USD Million) By Application (2021-2032)
Figure 30. North America Contraceptive Sponges Revenue (USD Million) By Product (2021-2032)
Figure 31. Europe Contraceptive Sponges Revenue (USD Million) By Type (2021-2032)
Figure 32. Europe Contraceptive Sponges Revenue (USD Million) By Application (2021-2032)
Figure 33. Europe Contraceptive Sponges Revenue (USD Million) By Product (2021-2032)
Figure 34. Asia Pacific Contraceptive Sponges Revenue (USD Million) By Type (2021-2032)
Figure 35. Asia Pacific Contraceptive Sponges Revenue (USD Million) By Application (2021-2032)
Figure 36. Asia Pacific Contraceptive Sponges Revenue (USD Million) By Product (2021-2032)
Figure 37. South America Contraceptive Sponges Revenue (USD Million) By Type (2021-2032)
Figure 38. South America Contraceptive Sponges Revenue (USD Million) By Application (2021-2032)
Figure 39. South America Contraceptive Sponges Revenue (USD Million) By Product (2021-2032)
Figure 40. Middle East and Africa Contraceptive Sponges Revenue (USD Million) By Type (2021-2032)
Figure 41. Middle East and Africa Contraceptive Sponges Revenue (USD Million) By Application (2021-2032)
Figure 42. Middle East and Africa Contraceptive Sponges Revenue (USD Million) By Product (2021-2032)
By Type
Ultrathin
Ordinary
By Distribution Channel
Pharmacies
Online Stores
Others
Countries Analyzed
North America (US, Canada, Mexico)
Europe (Germany, UK, France, Spain, Italy, Russia, Rest of Europe)
Asia Pacific (China, India, Japan, South Korea, Australia, South East Asia, Rest of Asia)
South America (Brazil, Argentina, Rest of South America)
Middle East and Africa (Saudi Arabia, UAE, Rest of Middle East, South Africa, Egypt, Rest of Africa)
