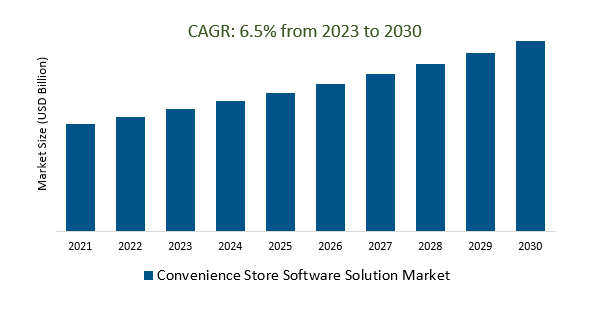
The Global Convenience Store Software Solution Market Size is estimated to register 6.5% growth over the forecast period from 2023 to 2030.
The market growth is driven by an increasing reliance on digital transactions and data storage, compliance with industry regulations and robust cybersecurity measures are becoming paramount. Convenience store software solutions need to address these concerns by implementing secure payment gateways, ensuring compliance with data protection regulations, and regularly updating security protocols to protect sensitive customer information. Leading Companies focusing on Blockchain Integration for Transparent Supply Chain, Artificial Intelligence (AI) for Predictive Analytics, Augmented Reality (AR) for Enhanced Customer Experience, Voice Commerce and Virtual Assistants, IoT (Internet of Things) for Smart Store Management, Subscription-Based Models and Membership Programs, and others to boost market shares in the industry.
Market Overview
The Convenience Store Software Solution Market encompasses software designed to optimize the operations of convenience stores, offering features such as advanced point-of-sale systems, inventory management, and integration with diverse payment methods. Key trends include the integration of e-commerce, mobile and contactless payments, and a focus on data analytics for informed decision-making. The future scope involves potential advancements in technology, such as blockchain, artificial intelligence, augmented reality, and IoT, to enhance transparency, predictive analytics, customer experiences, and smart store management. The market also addresses security and compliance concerns in response to the increasing reliance on digital transactions. For precise and up-to-date information, consulting recent market reports and industry analyses is recommended.
Market Dynamics
Market Trends- Integrated POS systems are the key to the future of convenience store software solutions.
The integration of advanced Point-of-Sale (POS) systems is pivotal for the future of convenience store software solutions. These integrated POS systems go beyond traditional functions, providing real-time transaction processing, streamlined inventory management, and enhanced customer relationship management. With features like personalized services and targeted marketing based on customer behavior, these systems optimize in-store operations and offer comprehensive analytics for informed decision-making. The integration also sets the stage for future advancements, including contactless payments, online ordering, and the incorporation of emerging technologies like blockchain and artificial intelligence, ensuring convenience stores stay competitive and technologically advanced.
Market Driver- The growing demand for mobile and contactless payments is driving the need for convenience store software solutions that can support these payment methods.
The surge in demand for mobile and contactless payments is a driving force behind the need for advanced convenience store software solutions. As consumers increasingly prefer quick and convenient transaction methods, modern software must adeptly support these payment options. Integration of robust mobile payment support and contactless features, including Near Field Communication (NFC), is becoming imperative for staying competitive in the convenience store market. This trend underscores the industry's commitment to meeting customer preferences for efficient and secure payment experiences, emphasizing the importance of software solutions that align with evolving payment technologies.
Market Opportunity- Convenience store software solutions are increasingly using data analytics to provide business intelligence.
Convenience store software solutions are increasingly incorporating data analytics to offer crucial business intelligence. By analyzing customer behavior, inventory turnover, and sales trends, these analytics tools enable store owners to make informed decisions, streamline inventory management, and implement targeted marketing strategies. This trend underscores the industry's recognition of the value of data-driven insights in optimizing business processes and enhancing customer experiences, positioning convenience store software as a key player in the evolving landscape of data analytics within the market.
Market Share Analysis- Web-based Convenience Store Software Solution Market will register the fastest growth
The Global Convenience Store Software Solution Market is analyzed across Web-based, Installed, and others. Web-based is poised to register the fastest growth. The web-based convenience store software solution market is witnessing growth, driven by the demand for flexible and accessible tools. These solutions, accessible through web browsers, eliminate the need for on-premises installations, offering real-time access to features like point-of-sale systems, inventory management, and analytics. The shift towards web-based solutions reflects a broader industry trend towards cloud-based technologies, providing convenience stores with mobility, scalability, and cost-effectiveness. This market evolution is expected to contribute to enhanced operational efficiency and better alignment with the dynamic needs of modern convenience store businesses.
Market Share Analysis- SMEs held a significant market share in 2023
The Global Convenience Store Software Solution Market is analyzed across various applications including SMEs, Large enterprises, and others. Of these, SMEs held a significant market share in 2023. Convenience store software solutions designed for Small and Medium Enterprises (SMEs) provide streamlined point-of-sale, inventory management, and analytics functionalities. Tailored for the specific needs of smaller businesses, these solutions offer automation, efficient inventory control, and insights into customer behavior. The affordability and scalability of such software make it a viable choice for SMEs, enabling them to compete effectively with larger counterparts. Cloud-based and subscription models further enhance cost-effectiveness, positioning these solutions as crucial tools supporting the growth and competitiveness of SMEs in the convenience store sector.
Convenience Store Software Solution Market Segmentation
By Type
By Application
By Region
- North America (United States, Canada, Mexico)
- Europe (Germany, France, United Kingdom, Spain, Italy, Others)
- Asia Pacific (China, India, Japan, South Korea, Australia, Others)
- Latin America (Brazil, Argentina, Others)
- Middle East and Africa (Saudi Arabia, UAE, Kuwait, Other Middle East, South Africa, Nigeria, Other Africa)
Convenience Store Software Solution Market Companies
- POS Nation
- DataMax
- ADD Systems
- AccuPOS
- SSCS
- PDI
- SHENZHEN KEMAI
- CStorePro Inc
- Petrosoft
- Paytronix
- Siss
- NCR
- Shopify
- Verifone
- Oracle
- Fujitsu
*List not exhaustive
Convenience Store Software Solution Market Outlook 2023
1 Market Overview
1.1 Introduction to the Convenience Store Software Solution Market
1.2 Scope of the Study
1.3 Research Objective
1.3.1 Key Market Scope and Segments
1.3.2 Players Covered
1.3.3 Years Considered
2 Executive Summary
2.1 2023 Convenience Store Software Solution Industry- Market Statistics
3 Market Dynamics
3.1 Market Drivers
3.2 Market Challenges
3.3 Market Opportunities
3.4 Market Trends
4 Market Factor Analysis
4.1 Porter’s Five Forces
4.2 Market Entropy
4.2.1 Global Convenience Store Software Solution Market Companies with Area Served
4.2.2 Products Offerings Global Convenience Store Software Solution Market
5 COVID-19 Impact Analysis and Outlook Scenarios
5.1.1 Covid-19 Impact Analysis
5.1.2 Post-COVID-19 Scenario- Low Growth Case
5.1.3 Post-COVID-19 Scenario- Reference Growth Case
5.1.4 Post-COVID-19 Scenario- Low Growth Case
6 Global Convenience Store Software Solution Market Trends
6.1 Global Convenience Store Software Solution Revenue (USD Million) and CAGR (%) by Type (2018-2030)
6.2 Global Convenience Store Software Solution Revenue (USD Million) and CAGR (%) by Applications (2018-2030)
6.3 Global Convenience Store Software Solution Revenue (USD Million) and CAGR (%) by Regions (2018-2030)
7 Global Convenience Store Software Solution Market Revenue (USD Million) by Type, and Applications (2018-2022)
7.1 Global Convenience Store Software Solution Revenue (USD Million) by Type (2018-2022)
7.1.1 Global Convenience Store Software Solution Revenue (USD Million), Market Share (%) by Type (2018-2022)
7.2 Global Convenience Store Software Solution Revenue (USD Million) by Applications (2018-2022)
7.2.1 Global Convenience Store Software Solution Revenue (USD Million), Market Share (%) by Applications (2018-2022)
8 Global Convenience Store Software Solution Development Regional Status and Outlook
8.1 Global Convenience Store Software Solution Revenue (USD Million) By Regions (2018-2022)
8.2 North America Convenience Store Software Solution Revenue (USD Million) by Type, and Application (2018-2022)
8.2.1 North America Convenience Store Software Solution Revenue (USD Million) by Country (2018-2022)
8.2.2 North America Convenience Store Software Solution Revenue (USD Million) by Type (2018-2022)
8.2.3 North America Convenience Store Software Solution Revenue (USD Million) by Applications (2018-2022)
8.3 Europe Convenience Store Software Solution Revenue (USD Million), by Type, and Applications (USD Million) (2018-2022)
8.3.1 Europe Convenience Store Software Solution Revenue (USD Million), by Country (2018-2022)
8.3.2 Europe Convenience Store Software Solution Revenue (USD Million) by Type (2018-2022)
8.3.3 Europe Convenience Store Software Solution Revenue (USD Million) by Applications (2018-2022)
8.4 Asia Pacific Convenience Store Software Solution Revenue (USD Million), and Revenue (USD Million) by Type, and Applications (2018-2022)
8.4.1 Asia Pacific Convenience Store Software Solution Revenue (USD Million) by Country (2018-2022)
8.4.2 Asia Pacific Convenience Store Software Solution Revenue (USD Million) by Type (2018-2022)
8.4.3 Asia Pacific Convenience Store Software Solution Revenue (USD Million) by Applications (2018-2022)
8.5 South America Convenience Store Software Solution Revenue (USD Million), by Type, and Applications (2018-2022)
8.5.1 South America Convenience Store Software Solution Revenue (USD Million), by Country (2018-2022)
8.5.2 South America Convenience Store Software Solution Revenue (USD Million) by Type (2018-2022)
8.5.3 South America Convenience Store Software Solution Revenue (USD Million) by Applications (2018-2022)
8.6 Middle East and Africa Convenience Store Software Solution Revenue (USD Million), by Type, Technology, Application, Thickness (2018-2022)
8.6.1 Middle East and Africa Convenience Store Software Solution Revenue (USD Million) by Country (2018-2022)
8.6.2 Middle East and Africa Convenience Store Software Solution Revenue (USD Million) by Type (2018-2022)
8.6.3 Middle East and Africa Convenience Store Software Solution Revenue (USD Million) by Applications (2018-2022)
9 Company Profiles
10 Global Convenience Store Software Solution Market Revenue (USD Million), by Type, and Applications (2023-2030)
10.1 Global Convenience Store Software Solution Revenue (USD Million) and Market Share (%) by Type (2023-2030)
10.1.1 Global Convenience Store Software Solution Revenue (USD Million), and Market Share (%) by Type (2023-2030)
10.2 Global Convenience Store Software Solution Revenue (USD Million) and Market Share (%) by Applications (2023-2030)
10.2.1 Global Convenience Store Software Solution Revenue (USD Million), and Market Share (%) by Applications (2023-2030)
11 Global Convenience Store Software Solution Development Regional Status and Outlook Forecast
11.1 Global Convenience Store Software Solution Revenue (USD Million) By Regions (2023-2030)
11.2 North America Convenience Store Software Solution Revenue (USD Million) by Type, and Applications (2023-2030)
11.2.1 North America Convenience Store Software Solution Revenue (USD) Million by Country (2023-2030)
11.2.2 North America Convenience Store Software Solution Revenue (USD Million), by Type (2023-2030)
11.2.3 North America Convenience Store Software Solution Revenue (USD Million), Market Share (%) by Applications (2023-2030)
11.3 Europe Convenience Store Software Solution Revenue (USD Million), by Type, and Applications (2023-2030)
11.3.1 Europe Convenience Store Software Solution Revenue (USD Million), by Country (2023-2030)
11.3.2 Europe Convenience Store Software Solution Revenue (USD Million), by Type (2023-2030)
11.3.3 Europe Convenience Store Software Solution Revenue (USD Million), by Applications (2023-2030)
11.4 Asia Pacific Convenience Store Software Solution Revenue (USD Million) by Type, and Applications (2023-2030)
11.4.1 Asia Pacific Convenience Store Software Solution Revenue (USD Million), by Country (2023-2030)
11.4.2 Asia Pacific Convenience Store Software Solution Revenue (USD Million), by Type (2023-2030)
11.4.3 Asia Pacific Convenience Store Software Solution Revenue (USD Million), by Applications (2023-2030)
11.5 South America Convenience Store Software Solution Revenue (USD Million), by Type, and Applications (2023-2030)
11.5.1 South America Convenience Store Software Solution Revenue (USD Million), by Country (2023-2030)
11.5.2 South America Convenience Store Software Solution Revenue (USD Million), by Type (2023-2030)
11.5.3 South America Convenience Store Software Solution Revenue (USD Million), by Applications (2023-2030)
11.6 Middle East and Africa Convenience Store Software Solution Revenue (USD Million), by Type, and Applications (2023-2030)
11.6.1 Middle East and Africa Convenience Store Software Solution Revenue (USD Million), by Region (2023-2030)
11.6.2 Middle East and Africa Convenience Store Software Solution Revenue (USD Million), by Type (2023-2030)
11.6.3 Middle East and Africa Convenience Store Software Solution Revenue (USD Million), by Applications (2023-2030)
12 Methodology and Data Sources
12.1 Methodology/Research Approach
12.1.1 Research Programs/Design
12.1.2 Market Size Estimation
12.1.3 Market Breakdown and Data Triangulation
12.2 Data Sources
12.2.1 Secondary Sources
12.2.2 Primary Sources
12.3 Disclaimer
List of Tables
Table 1 Market Segmentation Analysis
Table 2 Global Convenience Store Software Solution Market Companies with Areas Served
Table 3 Products Offerings Global Convenience Store Software Solution Market
Table 4 Low Growth Scenario Forecasts
Table 5 Reference Case Growth Scenario
Table 6 High Growth Case Scenario
Table 7 Global Convenience Store Software Solution Revenue (USD Million) And CAGR (%) By Type (2018-2030)
Table 8 Global Convenience Store Software Solution Revenue (USD Million) And CAGR (%) By Applications (2018-2030)
Table 9 Global Convenience Store Software Solution Revenue (USD Million) And CAGR (%) By Regions (2018-2030)
Table 10 Global Convenience Store Software Solution Revenue (USD Million) By Type (2018-2022)
Table 11 Global Convenience Store Software Solution Revenue Market Share (%) By Type (2018-2022)
Table 12 Global Convenience Store Software Solution Revenue (USD Million) By Applications (2018-2022)
Table 13 Global Convenience Store Software Solution Revenue Market Share (%) By Applications (2018-2022)
Table 14 Global Convenience Store Software Solution Market Revenue (USD Million) By Regions (2018-2022)
Table 15 Global Convenience Store Software Solution Market Share (%) By Regions (2018-2022)
Table 16 North America Convenience Store Software Solution Revenue (USD Million) By Country (2018-2022)
Table 17 North America Convenience Store Software Solution Revenue (USD Million) By Type (2018-2022)
Table 18 North America Convenience Store Software Solution Revenue (USD Million) By Applications (2018-2022)
Table 19 Europe Convenience Store Software Solution Revenue (USD Million) By Country (2018-2022)
Table 20 Europe Convenience Store Software Solution Revenue (USD Million) By Type (2018-2022)
Table 21 Europe Convenience Store Software Solution Revenue (USD Million) By Applications (2018-2022)
Table 22 Asia Pacific Convenience Store Software Solution Revenue (USD Million) By Country (2018-2022)
Table 23 Asia Pacific Convenience Store Software Solution Revenue (USD Million) By Type (2018-2022)
Table 24 Asia Pacific Convenience Store Software Solution Revenue (USD Million) By Applications (2018-2022)
Table 25 South America Convenience Store Software Solution Revenue (USD Million) By Country (2018-2022)
Table 26 South America Convenience Store Software Solution Revenue (USD Million) By Type (2018-2022)
Table 27 South America Convenience Store Software Solution Revenue (USD Million) By Applications (2018-2022)
Table 28 Middle East and Africa Convenience Store Software Solution Revenue (USD Million) By Region (2018-2022)
Table 29 Middle East and Africa Convenience Store Software Solution Revenue (USD Million) By Type (2018-2022)
Table 30 Middle East and Africa Convenience Store Software Solution Revenue (USD Million) By Applications (2018-2022)
Table 31 Financial Analysis
Table 32 Global Convenience Store Software Solution Revenue (USD Million) By Type (2023-2030)
Table 33 Global Convenience Store Software Solution Revenue Market Share (%) By Type (2023-2030)
Table 34 Global Convenience Store Software Solution Revenue (USD Million) By Applications (2023-2030)
Table 35 Global Convenience Store Software Solution Revenue Market Share (%) By Applications (2023-2030)
Table 36 Global Convenience Store Software Solution Market Revenue (USD Million), And Revenue (USD Million) By Regions (2023-2030)
Table 37 North America Convenience Store Software Solution Revenue (USD)By Country (2023-2030)
Table 38 North America Convenience Store Software Solution Revenue (USD Million) By Type (2023-2030)
Table 39 North America Convenience Store Software Solution Revenue (USD Million) By Applications (2023-2030)
Table 40 Europe Convenience Store Software Solution Revenue (USD Million) By Country (2023-2030)
Table 41 Europe Convenience Store Software Solution Revenue (USD Million) By Type (2023-2030)
Table 42 Europe Convenience Store Software Solution Revenue (USD Million) By Applications (2023-2030)
Table 43 Asia Pacific Convenience Store Software Solution Revenue (USD Million) By Country (2023-2030)
Table 44 Asia Pacific Convenience Store Software Solution Revenue (USD Million) By Type (2023-2030)
Table 45 Asia Pacific Convenience Store Software Solution Revenue (USD Million) By Applications (2023-2030)
Table 46 South America Convenience Store Software Solution Revenue (USD Million) By Country (2023-2030)
Table 47 South America Convenience Store Software Solution Revenue (USD Million) By Type (2023-2030)
Table 48 South America Convenience Store Software Solution Revenue (USD Million) By Applications (2023-2030)
Table 49 Middle East and Africa Convenience Store Software Solution Revenue (USD Million) By Region (2023-2030)
Table 50 Middle East and Africa Convenience Store Software Solution Revenue (USD Million) By Region (2023-2030)
Table 51 Middle East and Africa Convenience Store Software Solution Revenue (USD Million) By Type (2023-2030)
Table 52 Middle East and Africa Convenience Store Software Solution Revenue (USD Million) By Applications (2023-2030)
Table 53 Research Programs/Design for This Report
Table 54 Key Data Information from Secondary Sources
Table 55 Key Data Information from Primary Sources
List of Figures
Figure 1 Market Scope
Figure 2 Porter’s Five Forces
Figure 3 Global Convenience Store Software Solution Revenue (USD Million) By Type (2018-2022)
Figure 4 Global Convenience Store Software Solution Revenue Market Share (%) By Type (2022)
Figure 5 Global Convenience Store Software Solution Revenue (USD Million) By Applications (2018-2022)
Figure 6 Global Convenience Store Software Solution Revenue Market Share (%) By Applications (2022)
Figure 7 Global Convenience Store Software Solution Market Revenue (USD Million) By Regions (2018-2022)
Figure 8 Global Convenience Store Software Solution Market Share (%) By Regions (2022)
Figure 9 North America Convenience Store Software Solution Revenue (USD Million) By Country (2018-2022)
Figure 10 North America Convenience Store Software Solution Revenue (USD Million) By Type (2018-2022)
Figure 11 North America Convenience Store Software Solution Revenue (USD Million) By Applications (2018-2022)
Figure 12 Europe Convenience Store Software Solution Revenue (USD Million) By Country (2018-2022)
Figure 13 Europe Convenience Store Software Solution Revenue (USD Million) By Type (2018-2022)
Figure 14 Europe Convenience Store Software Solution Revenue (USD Million) By Applications (2018-2022)
Figure 15 Asia Pacific Convenience Store Software Solution Revenue (USD Million) By Country (2018-2022)
Figure 16 Asia Pacific Convenience Store Software Solution Revenue (USD Million) By Type (2018-2022)
Figure 17 Asia Pacific Convenience Store Software Solution Revenue (USD Million) By Applications (2018-2022)
Figure 18 South America Convenience Store Software Solution Revenue (USD Million) By Country (2018-2022)
Figure 19 South America Convenience Store Software Solution Revenue (USD Million) By Type (2018-2022)
Figure 20 South America Convenience Store Software Solution Revenue (USD Million) By Applications (2018-2022)
Figure 21 Middle East and Africa Convenience Store Software Solution Revenue (USD Million) By Region (2018-2022)
Figure 22 Middle East and Africa Convenience Store Software Solution Revenue (USD Million) By Type (2018-2022)
Figure 23 Middle East and Africa Convenience Store Software Solution Revenue (USD Million) By Applications (2018-2022)
Figure 24 Global Convenience Store Software Solution Revenue (USD Million) By Type (2023-2030)
Figure 25 Global Convenience Store Software Solution Revenue Market Share (%) By Type (2030)
Figure 26 Global Convenience Store Software Solution Revenue (USD Million) By Applications (2023-2030)
Figure 27 Global Convenience Store Software Solution Revenue Market Share (%) By Applications (2030)
Figure 28 Global Convenience Store Software Solution Market Revenue (USD Million) By Regions (2023-2030)
Figure 29 North America Convenience Store Software Solution Revenue (USD Million) By Country (2023-2030)
Figure 30 North America Convenience Store Software Solution Revenue (USD Million) By Type (2023-2030)
Figure 31 North America Convenience Store Software Solution Revenue (USD Million) By Applications (2023-2030)
Figure 32 Europe Convenience Store Software Solution Revenue (USD Million) By Country (2023-2030)
Figure 33 Europe Convenience Store Software Solution Revenue (USD Million) By Type (2023-2030)
Figure 34 Europe Convenience Store Software Solution Revenue (USD Million) By Applications (2023-2030)
Figure 35 Asia Pacific Convenience Store Software Solution Revenue (USD Million) By Country (2023-2030)
Figure 36 Asia Pacific Convenience Store Software Solution Revenue (USD Million) By Type (2023-2030)
Figure 37 Asia Pacific Convenience Store Software Solution Revenue (USD Million) By Applications (2023-2030)
Figure 38 South America Convenience Store Software Solution Revenue (USD Million) By Country (2023-2030)
Figure 39 South America Convenience Store Software Solution Revenue (USD Million) By Type (2023-2030)
Figure 40 South America Convenience Store Software Solution Revenue (USD Million) By Applications (2023-2030)
Figure 41 Middle East and Africa Convenience Store Software Solution Revenue (USD Million) By Region (2023-2030)
Figure 42 Middle East and Africa Convenience Store Software Solution Revenue (USD Million) By Region (2023-2030)
Figure 43 Middle East and Africa Convenience Store Software Solution Revenue (USD Million) By Type (2023-2030)
Figure 44 Middle East and Africa Convenience Store Software Solution Revenue (USD Million) By Applications (2023-2030)
Figure 45 Bottom-Up and Top-Down Approaches For This Report
Figure 46 Data Triangulation
