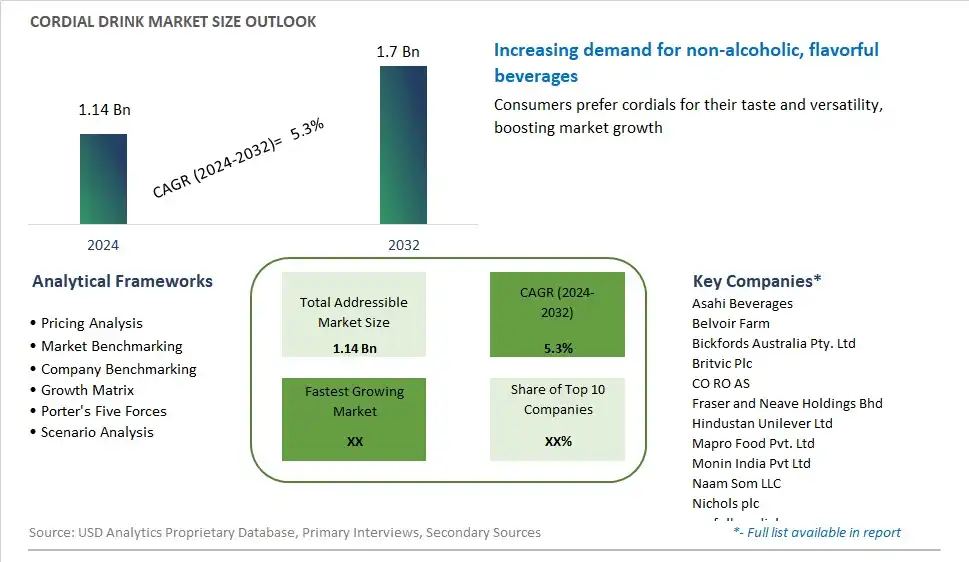
Global Cordial Drink Market Size is valued at $1.14 Billion in 2024 and is forecast to register a growth rate (CAGR) of 5.3% to reach $1.7 Billion by 2032.
The global Cordial Drink Market Comprehensive Study analyzes and forecasts the market size across 6 regions and 24 countries for diverse segments -By Type (Fruit Cordials, Vegetable Cordials, Herbs and Spices Cordials), By Distribution Channel (Supermarkets / Hypermarkets, Departmental Stores, Online Retail), By Source (Organic, Conventional)
An Introduction to Cordial Drink Market
In 2024, the cordial drink market remains a staple in the beverage industry, offering a versatile and flavorful option for consumers seeking refreshing and customizable drink experiences. Cordial drinks, also known as fruit syrups or flavored concentrates, are concentrated liquid extracts made from fruits, herbs, spices, and sweeteners, which are diluted with water or other beverages to create a wide range of flavorful drinks. They are popular for their convenience, affordability, and ability to be mixed with various base ingredients such as water, soda, cocktails, or even desserts to create custom beverages tailored to individual tastes and preferences. The market for cordial drinks is driven by factors such as changing consumer lifestyles, the demand for natural and artisanal products, and the growing popularity of DIY mixology and home bartending. Manufacturers are innovating to introduce new flavors, organic options, and healthier formulations with reduced sugar content and natural ingredients, catering to the preferences of health-conscious consumers. Additionally, cordial drinks are increasingly used in culinary applications such as marinades, sauces, and desserts, expanding their versatility and market reach. As consumers continue to seek out unique and customizable beverage experiences, the cordial drink market presents opportunities for manufacturers to innovate, diversify, and capture market share in a competitive and dynamic industry landscape.
Cordial Drink Competitive Landscape
The market report analyses the leading companies in the industry including Asahi Beverages, Belvoir Farm, Bickfords Australia Pty. Ltd, Britvic Plc, CO RO AS, Fraser and Neave Holdings Bhd, Hindustan Unilever Ltd, Mapro Food Pvt. Ltd, Monin India Pvt Ltd, Naam Som LLC, Nichols plc, norfolkcordial, Orange Crush (M) Sdn. Bhd., RASNA PRIVATE Ltd, Red Horse Fruit Juice Manufacturers Sdn. Bhd., Sainsburys Group, Suntory Holdings Ltd, The Coca Cola Co., The Urban Cordial Co. Ltd, Tovali Ltd, and Others.
Cordial Drink Market Dynamics
Cordial Drink Market Trend: Rising Demand for Natural and Artisanal Beverages
The most prominent market trend for Cordial Drinks is the rising demand for natural and artisanal beverages, driven by consumer preferences for healthier, premium-quality drink options. As consumers become more health-conscious and seek alternatives to sugary sodas and artificial drinks, there is a growing interest in cordials made from natural ingredients, such as fruits, herbs, and botanicals. This trend aligns with the broader movement towards clean-label products and transparent sourcing, as consumers prioritize beverages that are free from artificial flavors, colors, and preservatives. Additionally, the artisanal appeal of cordial drinks, with their unique flavors and handcrafted production methods, resonates with consumers seeking authentic and indulgent beverage experiences.
Market Driver: Shift Towards At-Home Mixology and Cocktail Culture
A significant market driver for Cordial Drinks is the shift towards at-home mixology and cocktail culture, driven by changing consumer behaviors, including increased socializing at home and the rise of do-it-yourself (DIY) cocktail enthusiasts. Cordial drinks, with their versatility and flavor profiles, serve as essential ingredients in crafting cocktails and mocktails, offering consumers the opportunity to experiment and create customized beverages from the comfort of their homes. This driver is further fueled by the desire for unique and Instagram-worthy drink experiences, as consumers seek to elevate their home entertaining and social gatherings with creative and visually appealing beverages.
Market Opportunity: Innovation in Flavor Profiles and Packaging
An opportunity in the Cordial Drink market lies in innovation in flavor profiles and packaging to cater to evolving consumer tastes and preferences. Companies can capitalize on the demand for novel and exotic flavor combinations by introducing innovative cordial flavors inspired by global culinary trends, seasonal ingredients, and functional benefits such as wellness-enhancing botanicals. Furthermore, there's potential to differentiate cordial drinks through eye-catching and sustainable packaging solutions, such as eco-friendly bottles or convenient single-serve formats for on-the-go consumption. By staying abreast of consumer trends, investing in product development, and leveraging creative marketing strategies, brands can position cordial drinks as must-have additions to consumers' beverage repertoire and capitalize on the growing market opportunity.
Cordial Drink Market Share Analysis: Fruit Cordials held the dominant market share in 2024
Among the segments delineated within the Cordial Drink market, Fruit Cordials stand out as the largest segment, commanding a substantial share of the market. This dominance can be attributed to several factors, chief among them being the widespread consumer appeal for fruit-based beverages owing to their refreshing taste profiles and natural goodness. Within the Fruit Cordials segment, flavors like Mango, Orange, and Strawberry emerge as frontrunners, resonating strongly with consumer preferences for familiar and beloved fruit flavors. Additionally, the versatility of fruit cordials, whether enjoyed as standalone beverages or mixed into cocktails, further enhances their popularity across diverse consumer demographics. Furthermore, the growing trend towards health-conscious consumption habits drives the demand for fruit-based beverages perceived as healthier alternatives to sugary sodas and artificially flavored drinks. As a result, Fruit Cordials assert their position as the largest segment within the Cordial Drink market, propelled by their inherent appeal and versatility.
Cordial Drink Market Share Analysis: Online Retail market is poised to register the fastest growth rae over the forecast period to 2032
In the Cordial Drink market's distribution channels, the online retail segment is the fastest-growing, driven by the paradigm shift in consumer shopping behaviors towards digital platforms. The convenience and accessibility offered by online retail platforms have revolutionized the way consumers purchase beverages, including cordials. The proliferation of e-commerce platforms has widened the reach of cordial drinks to consumers in geographically diverse regions, thereby facilitating market expansion. Further, the COVID-19 pandemic has accelerated the adoption of online shopping habits, with consumers increasingly preferring the safety and convenience of shopping from the comfort of their homes. Additionally, online retail channels provide a platform for smaller, niche brands to reach a wider audience, fostering innovation and competition within the market. As a result, the online retail segment of the Cordial Drink market experiences robust growth, fueled by evolving consumer preferences and technological advancements in the retail landscape.
Cordial Drink Market Share Analysis: Conventional held the dominant market share in 2024
Within the Cordial Drink market's segmentation based on source, the conventional segment is the largest, owing to several key factors. Firstly, conventional cordial drinks have historically dominated the market due to their widespread availability and affordability. Mass production methods and conventional farming practices contribute to lower production costs, enabling manufacturers to offer these products at competitive prices, thus appealing to a broader consumer base. Additionally, conventional cordials often boast a diverse range of flavors and formulations, catering to varying taste preferences and consumer demands. While organic cordials gain traction among health-conscious consumers seeking natural and sustainable options, the conventional segment maintains its dominance due to its established market presence, extensive distribution networks, and cost-effectiveness, making it the largest segment within the Cordial Drink market by source.
Cordial Drink Market Segmentation
By Type
Fruit Cordials
-Mango
-Orange
-Strawberry
-Others
Vegetable Cordials
Herbs and Spices Cordials
By Distribution Channel
Supermarkets / Hypermarkets
Departmental Stores
Online Retail
By Source
Organic
Conventional
Countries Analyzed
North America (US, Canada, Mexico)
Europe (Germany, UK, France, Spain, Italy, Russia, Rest of Europe)
Asia Pacific (China, India, Japan, South Korea, Australia, South East Asia, Rest of Asia)
South America (Brazil, Argentina, Rest of South America)
Middle East and Africa (Saudi Arabia, UAE, Rest of Middle East, South Africa, Egypt, Rest of Africa)
Cordial Drink Companies Profiled in the Study
Asahi Beverages
Belvoir Farm
Bickfords Australia Pty. Ltd
Britvic Plc
CO RO AS
Fraser and Neave Holdings Bhd
Hindustan Unilever Ltd
Mapro Food Pvt. Ltd
Monin India Pvt Ltd
Naam Som LLC
Nichols plc
norfolkcordial
Orange Crush (M) Sdn. Bhd.
RASNA PRIVATE Ltd
Red Horse Fruit Juice Manufacturers Sdn. Bhd.
Sainsburys Group
Suntory Holdings Ltd
The Coca Cola Co.
The Urban Cordial Co. Ltd
Tovali Ltd
*- List Not Exhaustive
Chapter 1. TABLE OF CONTENTS
Chapter 2. Introduction to Cordial Drink Market
2.1. Market Overview
2.2. Key Statistics and Report Highlights
2.3. Scope of the Comprehensive Study
2.3.1. Market Definition
2.3.2 Countries and Regions Covered
2.3.3 Research Objective
2.3.4 Units, Currency, and Conversions
2.3.5 Industry Value Chain
2.4. Key Market Segments
2.5. Key Companies
2.6. Study Period
Chapter 3. Strategic Analysis Review
3.1. Cordial Drink Pricing Analysis and Forecast
3.2. Porter’s Five Forces
3.3. Market Ecosystem
3.4. SWOT Analysis
3.5. Regulatory Scenario
3.3. Effects of Inflation, Russia-Ukraine War, moderating economic growth, and other macroeconomic factors
Chapter 4. Competitive Landscape
4.1. Market Share Analysis
4.1.1. Global Cordial Drink Market Share by Company, 2023
4.1.2. Product Offerings of Leading Cordial Drink Companies
4.2. Market Entropy
4.2.1. New Product Launches in the Industry
4.2.2. Mergers, Acquisitions, Joint ventures, and Partnerships
4.3. Key Strategies and Best Practices
Chapter 5. Global Market Projections: Best, Reference, and Low Case Scenarios
5.1. Growth Analysis- Case Scenario Definitions
5.2. Low Growth Case Scenario Forecasts
5.3. Reference Growth Case Scenario Forecasts
5.4. High Growth Case Scenario Forecasts
Chapter 6. Market Dynamics
6.1. Cordial Drink Market Drivers
6.2. Cordial Drink Market Challenges
6.6. Cordial Drink Market Opportunities
6.4. Cordial Drink Market Trends
Chapter 7. Global Cordial Drink Market Outlook Trends
7.1. Global Cordial Drink Revenue (USD Million) and CAGR (%) by Type (2021-2032)
7.2. Global Cordial Drink Revenue (USD Million) and CAGR (%) by Application (2021-2032)
7.3. Global Cordial Drink Revenue (USD Million) and CAGR (%) by Product (2021-2032)
By Type
Fruit Cordials
-Mango
-Orange
-Strawberry
-Others
Vegetable Cordials
Herbs and Spices Cordials
By Distribution Channel
Supermarkets / Hypermarkets
Departmental Stores
Online Retail
By Source
Organic
Conventional
Chapter 8. Global Cordial Drink Regional Analysis and Outlook
8.1. Global Cordial Drink Revenue (USD Million) By Regions (2021- 2032)
8.2. North America Cordial Drink Revenue (USD Million) by Country (2021-2032)
8.2.1. United States Cordial Drink Regional Analysis and Outlook
8.2.2. Canada Cordial Drink Regional Analysis and Outlook
8.2.3. Mexico Cordial Drink Regional Analysis and Outlook
8.3. Europe Cordial Drink Revenue (USD Million), by Country (2021-2032)
8.3.1. Germany Cordial Drink Regional Analysis and Outlook
8.3.2. France Cordial Drink Regional Analysis and Outlook
8.3.3. United Kingdom Cordial Drink Regional Analysis and Outlook
8.3.4. Spain Cordial Drink Regional Analysis and Outlook
8.3.5. Italy Cordial Drink Regional Analysis and Outlook
8.3.6. Russia Cordial Drink Regional Analysis and Outlook
8.3.7. Rest of Europe Cordial Drink Regional Analysis and Outlook
8.4. Asia Pacific Cordial Drink Revenue (USD Million) by Country (2021-2032)
8.4.1. China Cordial Drink Regional Analysis and Outlook
8.4.2. Japan Cordial Drink Regional Analysis and Outlook
8.4.3. India Cordial Drink Regional Analysis and Outlook
8.4.4. South Korea Cordial Drink Regional Analysis and Outlook
8.4.5. Australia Cordial Drink Regional Analysis and Outlook
8.4.6. South East Asia Cordial Drink Regional Analysis and Outlook
8.4.7. Rest of Asia Pacific Cordial Drink Regional Analysis and Outlook
8.5. South America Cordial Drink Revenue (USD Million), by Country (2021-2032)
8.5.1. Brazil Cordial Drink Regional Analysis and Outlook
8.5.2. Argentina Cordial Drink Regional Analysis and Outlook
8.5.3. Rest of South America Cordial Drink Regional Analysis and Outlook
8.6. Middle East and Africa Cordial Drink Revenue (USD Million) by Country (2021-2032)
8.6.1. Middle East Cordial Drink Regional Analysis and Outlook
8.6.2. Africa Cordial Drink Regional Analysis and Outlook
Chapter 9. North America Cordial Drink Analysis and Outlook
9.1. North America Cordial Drink Revenue (USD Million) by Segments (2021-2032)
9.1.1. North America Cordial Drink Revenue (USD Million) by Type (2021-2032)
9.1.2. North America Cordial Drink Revenue (USD Million) by Application (2021-2032)
9.1.3. North America Cordial Drink Revenue (USD Million) by Product (2021-2032)
By Type
Fruit Cordials
-Mango
-Orange
-Strawberry
-Others
Vegetable Cordials
Herbs and Spices Cordials
By Distribution Channel
Supermarkets / Hypermarkets
Departmental Stores
Online Retail
By Source
Organic
Conventional
Chapter 10. Europe Cordial Drink Analysis and Outlook
10.1. Europe Cordial Drink Revenue (USD Million), by Segments (USD Million) (2021-2032)
10.1.1. Europe Cordial Drink Revenue (USD Million) by Type (2021-2032)
10.1.2. Europe Cordial Drink Revenue (USD Million) by Application (2021-2032)
10.1.3. Europe Cordial Drink Revenue (USD Million) by Product (2021-2032)
By Type
Fruit Cordials
-Mango
-Orange
-Strawberry
-Others
Vegetable Cordials
Herbs and Spices Cordials
By Distribution Channel
Supermarkets / Hypermarkets
Departmental Stores
Online Retail
By Source
Organic
Conventional
Chapter 11. Asia Pacific Cordial Drink Analysis and Outlook
11.1. Asia Pacific Cordial Drink Revenue (USD Million), and Revenue (USD Million) by Segments (2021-2032)
11.1.1. Asia Pacific Cordial Drink Revenue (USD Million) by Type (2021-2032)
11.1.2. Asia Pacific Cordial Drink Revenue (USD Million) by Application (2021-2032)
11.1.3. Asia Pacific Cordial Drink Revenue (USD Million) by Product (2021-2032)
By Type
Fruit Cordials
-Mango
-Orange
-Strawberry
-Others
Vegetable Cordials
Herbs and Spices Cordials
By Distribution Channel
Supermarkets / Hypermarkets
Departmental Stores
Online Retail
By Source
Organic
Conventional
Chapter 12. South America Cordial Drink Analysis and Outlook
12.1. South America Cordial Drink Revenue (USD Million), by Segments (2021-2032)
12.1.1. South America Cordial Drink Revenue (USD Million) by Type (2021-2032)
12.1.2. South America Cordial Drink Revenue (USD Million) by Application (2021-2032)
12.1.3. South America Cordial Drink Revenue (USD Million) by Product (2021-2032)
By Type
Fruit Cordials
-Mango
-Orange
-Strawberry
-Others
Vegetable Cordials
Herbs and Spices Cordials
By Distribution Channel
Supermarkets / Hypermarkets
Departmental Stores
Online Retail
By Source
Organic
Conventional
Chapter 13. Middle East and Africa Cordial Drink Analysis and Outlook
13.1. Middle East and Africa Cordial Drink Revenue (USD Million), by Segments (2021-2032)
13.1.1. Middle East and Africa Cordial Drink Revenue (USD Million) by Type (2021-2032)
13.1.2. Middle East and Africa Cordial Drink Revenue (USD Million) by Application (2021-2032)
13.1.3. Middle East and Africa Cordial Drink Revenue (USD Million) by Product (2021-2032)
By Type
Fruit Cordials
-Mango
-Orange
-Strawberry
-Others
Vegetable Cordials
Herbs and Spices Cordials
By Distribution Channel
Supermarkets / Hypermarkets
Departmental Stores
Online Retail
By Source
Organic
Conventional
Chapter 14. Cordial Drink Company Profiles
14.1 Business Overview
14.2 Product Profiles
14.3 SWOT Profiles
14.5 Recent Developments
14.6 Financial Profile
List of Companies
Asahi Beverages
Belvoir Farm
Bickfords Australia Pty. Ltd
Britvic Plc
CO RO AS
Fraser and Neave Holdings Bhd
Hindustan Unilever Ltd
Mapro Food Pvt. Ltd
Monin India Pvt Ltd
Naam Som LLC
Nichols plc
norfolkcordial
Orange Crush (M) Sdn. Bhd.
RASNA PRIVATE Ltd
Red Horse Fruit Juice Manufacturers Sdn. Bhd.
Sainsburys Group
Suntory Holdings Ltd
The Coca Cola Co.
The Urban Cordial Co. Ltd
Tovali Ltd
15. Methodology and Data Sources
15.1 Customization Offerings
15.2 Subscription Services
15.3 Related Reports
15.4 Publisher Expertise
LIST OF TABLES
Table 1 Market Segmentation Analysis
Table 2 Global Cordial Drink Market Share of Leading Companies, 2023
Table 3 Product Offerings of Leading Companies
Table 4 Low Growth Scenario Forecasts
Table 5 Reference Case Growth Scenario
Table 6 High Growth Case Scenario
Table 7 Global Cordial Drink Revenue (USD Million) And CAGR (%) By Type (2021-2032)
Table 8 Global Cordial Drink Revenue (USD Million) And CAGR (%) By Application (2021-2032)
Table 9 Global Cordial Drink Revenue (USD Million) And CAGR (%) By Product (2021-2032)
Table 10 Global Cordial Drink Market Revenue (USD Million) By Regions (2021-2032)
Table 11 Global Cordial Drink Market Share (%) By Regions (2021-2032)
Table 12 North America Cordial Drink Revenue (USD Million) By Country (2021-2032)
Table 13 Europe Cordial Drink Revenue (USD Million) By Country (2021-2032)
Table 14 Asia Pacific Cordial Drink Revenue (USD Million) By Country (2021-2032)
Table 15 South America Cordial Drink Revenue (USD Million) By Country (2021-2032)
Table 16 Middle East and Africa Cordial Drink Revenue (USD Million) By Region (2021-2032)
Table 17 North America Cordial Drink Revenue (USD Million) By Type (2021-2032)
Table 18 North America Cordial Drink Revenue (USD Million) By Application (2021-2032)
Table 19 North America Cordial Drink Revenue (USD Million) By Product (2021-2032)
Table 20 Europe Cordial Drink Revenue (USD Million) By Type (2021-2032)
Table 21 Europe Cordial Drink Revenue (USD Million) By Application (2021-2032)
Table 22 Europe Cordial Drink Revenue (USD Million) By Product (2021-2032)
Table 23 Asia Pacific Cordial Drink Revenue (USD Million) By Type (2021-2032)
Table 24 Asia Pacific Cordial Drink Revenue (USD Million) By Application (2021-2032)
Table 25 Asia Pacific Cordial Drink Revenue (USD Million) By Product (2021-2032)
Table 26 South America Cordial Drink Revenue (USD Million) By Type (2021-2032)
Table 27 South America Cordial Drink Revenue (USD Million) By Application (2021-2032)
Table 28 South America Cordial Drink Revenue (USD Million) By Product (2021-2032)
Table 29 Middle East and Africa Cordial Drink Revenue (USD Million) By Type (2021-2032)
Table 30 Middle East and Africa Cordial Drink Revenue (USD Million) By Application (2021-2032)
Table 31 Middle East and Africa Cordial Drink Revenue (USD Million) By Product (2021-2032)
LIST OF FIGURES
Figure 1. Market Scope
Figure 2. Pricing Forecasts Per Unit, 2023- 2032
Figure 3. Porter’s Five Forces
Figure 4. Global Cordial Drink Market Revenue (USD Million) By Regions (2021-2032)
Figure 5. Global Cordial Drink Market Share (%) By Regions (2023)
Figure 6. North America Cordial Drink Revenue (USD Million) By Country (2021-2032)
Figure 7. United States Cordial Drink Revenue (USD Million) By Country (2021-2032)
Figure 8. Canada Cordial Drink Revenue (USD Million) By Country (2021-2032)
Figure 9. Mexico Cordial Drink Revenue (USD Million) By Country (2021-2032)
Figure 10. Europe Cordial Drink Revenue (USD Million) By Country (2021-2032)
Figure 11. Germany Cordial Drink Revenue (USD Million) By Country (2021-2032)
Figure 12. France Cordial Drink Revenue (USD Million) By Country (2021-2032)
Figure 13. United Kingdom Cordial Drink Revenue (USD Million) By Country (2021-2032)
Figure 14. Spain Cordial Drink Revenue (USD Million) By Country (2021-2032)
Figure 15. Italy Cordial Drink Revenue (USD Million) By Country (2021-2032)
Figure 16. Russia Cordial Drink Revenue (USD Million) By Country (2021-2032)
Figure 17. Rest of Europe Cordial Drink Revenue (USD Million) By Country (2021-2032)
Figure 11. Asia Pacific Cordial Drink Revenue (USD Million) By Country (2021-2032)
Figure 12. China Cordial Drink Revenue (USD Million) By Country (2021-2032)
Figure 13. Japan Cordial Drink Revenue (USD Million) By Country (2021-2032)
Figure 14. India Cordial Drink Revenue (USD Million) By Country (2021-2032)
Figure 15. South Korea Cordial Drink Revenue (USD Million) By Country (2021-2032)
Figure 16. Australia Cordial Drink Revenue (USD Million) By Country (2021-2032)
Figure 17. South East Asia Cordial Drink Revenue (USD Million) By Country (2021-2032)
Figure 18. South America Cordial Drink Revenue (USD Million) By Country (2021-2032)
Figure 19. Brazil Cordial Drink Revenue (USD Million) By Country (2021-2032)
Figure 20. Argentina Cordial Drink Revenue (USD Million) By Country (2021-2032)
Figure 21. Rest of Asia Pacific Cordial Drink Revenue (USD Million) By Country (2021-2032)
Figure 22. Middle East and Africa Cordial Drink Revenue (USD Million) By Region (2021-2032)
Figure 23. Saudi Arabia Cordial Drink Revenue (USD Million) By Region (2021-2032)
Figure 24. The UAE Cordial Drink Revenue (USD Million) By Region (2021-2032)
Figure 25. Rest of Middle East Cordial Drink Revenue (USD Million) By Region (2021-2032)
Figure 26. South Africa Cordial Drink Revenue (USD Million) By Region (2021-2032)
Figure 27. Africa Cordial Drink Revenue (USD Million) By Region (2021-2032)
Figure 28. North America Cordial Drink Revenue (USD Million) By Type (2021-2032)
Figure 29. North America Cordial Drink Revenue (USD Million) By Application (2021-2032)
Figure 30. North America Cordial Drink Revenue (USD Million) By Product (2021-2032)
Figure 31. Europe Cordial Drink Revenue (USD Million) By Type (2021-2032)
Figure 32. Europe Cordial Drink Revenue (USD Million) By Application (2021-2032)
Figure 33. Europe Cordial Drink Revenue (USD Million) By Product (2021-2032)
Figure 34. Asia Pacific Cordial Drink Revenue (USD Million) By Type (2021-2032)
Figure 35. Asia Pacific Cordial Drink Revenue (USD Million) By Application (2021-2032)
Figure 36. Asia Pacific Cordial Drink Revenue (USD Million) By Product (2021-2032)
Figure 37. South America Cordial Drink Revenue (USD Million) By Type (2021-2032)
Figure 38. South America Cordial Drink Revenue (USD Million) By Application (2021-2032)
Figure 39. South America Cordial Drink Revenue (USD Million) By Product (2021-2032)
Figure 40. Middle East and Africa Cordial Drink Revenue (USD Million) By Type (2021-2032)
Figure 41. Middle East and Africa Cordial Drink Revenue (USD Million) By Application (2021-2032)
Figure 42. Middle East and Africa Cordial Drink Revenue (USD Million) By Product (2021-2032)
By Type
Fruit Cordials
-Mango
-Orange
-Strawberry
-Others
Vegetable Cordials
Herbs and Spices Cordials
By Distribution Channel
Supermarkets / Hypermarkets
Departmental Stores
Online Retail
By Source
Organic
Conventional
Countries Analyzed
North America (US, Canada, Mexico)
Europe (Germany, UK, France, Spain, Italy, Russia, Rest of Europe)
Asia Pacific (China, India, Japan, South Korea, Australia, South East Asia, Rest of Asia)
South America (Brazil, Argentina, Rest of South America)
Middle East and Africa (Saudi Arabia, UAE, Rest of Middle East, South Africa, Egypt, Rest of Africa)
