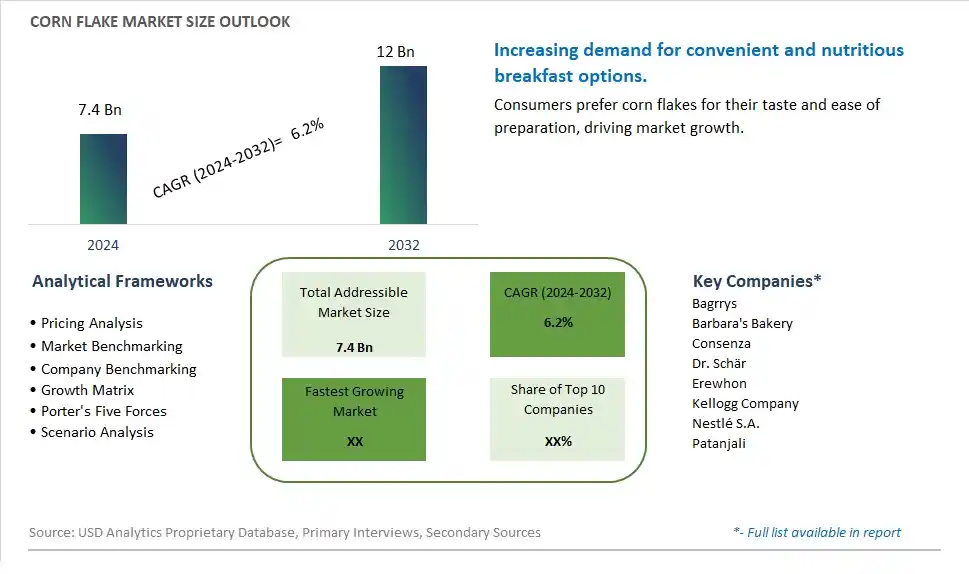
Global Corn Flake Market Size is valued at $7.4 Billion in 2024 and is forecast to register a growth rate (CAGR) of 6.2% to reach $12 Billion by 2032.
The global Corn Flake Market Comprehensive Study analyzes and forecasts the market size across 6 regions and 24 countries for diverse segments -By Type (Organic, Conventional), By Application (Breakfast Cereal, Snack), By Distribution Channel (Online, Offline)
An Introduction to Corn Flake Market
In 2024, the Corn Flake market is witnessing robust growth, driven by the increasing demand for convenient, nutritious, and ready-to-eat breakfast options. Corn flakes, made from toasted corn, are popular for their crunchy texture and versatility in various breakfast recipes. The market is supported by the growing trend towards healthy eating and the demand for high-quality, minimally processed breakfast foods. Advances in cereal production and fortification technologies are enhancing the flavor, nutritional content, and shelf life of corn flakes. The market is also benefiting from the trend towards clean-label, non-GMO, and fortified products, appealing to health-conscious consumers seeking nutritious and convenient breakfast options.
Corn Flake Competitive Landscape
The market report analyses the leading companies in the industry including Bagrrys, Barbara's Bakery, Consenza, Dr. Schär, Erewhon, Kellogg Company, Nestlé S.A., Patanjali, and Others.
Corn Flake Market Dynamics
Corn Flake Market Trend: Growing Demand for Healthy Breakfast Options
A prominent market trend in the Corn Flake market is the growing demand for healthy breakfast options. Consumers are increasingly seeking convenient and nutritious breakfast choices, driving the popularity of corn flakes as a breakfast cereal. The trend towards health-conscious eating habits, including preferences for low-sugar, whole grain, and fortified products, is fueling the demand for corn flakes with added nutritional benefits.
Corn Flake Market Driver: Innovation in Flavors and Varieties
The market driver for Corn Flakes is the ongoing innovation in flavors and varieties. Manufacturers are introducing new and unique flavors of corn flakes to cater to diverse consumer preferences and tastes. Additionally, the development of specialized variants such as gluten-free, organic, and non-GMO corn flakes is expanding the market reach and attracting a wider consumer base, driving growth in the Corn Flake market.
Corn Flake Market Opportunity: Expansion into Snack and Ingredient Applications
An opportunity within the Corn Flake market lies in expanding into snack and ingredient applications. Corn flakes can be utilized as versatile ingredients in snack bars, granola mixes, and baked goods, offering a crunchy texture and mild flavor profile. Manufacturers can capitalize on this opportunity by promoting corn flakes as a healthy and wholesome ingredient for snack formulations, as well as exploring collaborations with foodservice providers and bakeries to incorporate corn flakes into a variety of culinary creations, thereby expanding the market potential for Corn Flakes.
Corn Flake Market Share Analysis: Conventional Corn Flakes segment generated the highest revenue share in the industry
The Conventional Corn Flakes segment is the largest in the Corn Flake Market by type. This segment's dominance is attributed to the widespread popularity and consumption of conventional corn flakes worldwide. Conventional corn flakes are a staple breakfast cereal known for their crispy texture, light flavor, and nutritional content. They are made from milled corn, fortified with vitamins and minerals, and toasted to achieve the characteristic crunchiness that consumers enjoy. The affordability, convenience, and familiar taste of conventional corn flakes make them a preferred choice for consumers of all age groups. Additionally, the convenience of ready-to-eat cereals aligns with modern lifestyles, where consumers seek quick and nutritious breakfast options. While organic corn flakes appeal to health-conscious consumers looking for natural and environmentally friendly products, the larger market share of conventional corn flakes is driven by their widespread availability, affordability, and established brand recognition. As a result, the Conventional Corn Flakes segment maintains its leading position in the Corn Flake Market, catering to a diverse consumer base and meeting their breakfast cereal preferences.
Corn Flake Market Share Analysis: Snack is the fastest growing segment over the forecast period to 2032
The Snack segment is projected to be the fastest-growing application in the Corn Flake Market by 2032. This rapid growth is driven by several key factors that highlight the increasing popularity of corn flakes as a versatile snack option. Corn flakes are not limited to breakfast cereals but are also widely used as an ingredient in snack bars, trail mixes, and savory snack coatings. The crispy texture, mild flavor, and nutritional benefits of corn flakes make them an attractive choice for snack manufacturers seeking healthier and convenient snack alternatives. Further, the growing consumer demand for on-the-go snacks, particularly those with natural ingredients and added nutrients, contributes to the rising adoption of corn flakes in snack formulations. The versatility of corn flakes allows for creative product innovation in the snack industry, catering to diverse taste preferences and dietary requirements. As a result, the Snack segment is poised for significant growth, driven by its versatility, health benefits, and appeal as a convenient snack option for consumers.
Corn Flake Market Share Analysis: Offline segment generated the highest revenue share in the industry
The Offline segment is the largest in the Corn Flake Market by distribution channel. This segment's dominance is attributed to the long-standing tradition of purchasing breakfast cereals like corn flakes from physical retail outlets such as supermarkets, grocery stores, convenience stores, and specialty food stores. Offline distribution channels offer consumers the convenience of physically browsing and selecting products, immediate availability, and personalized customer service. These channels also facilitate impulse purchases and allow brands to showcase their products through attractive displays and promotions. While online retail for corn flakes is growing steadily, especially with the rise of e-commerce platforms and direct-to-consumer sales, the larger market share of the Offline segment is driven by established retail networks, consumer preferences for in-store shopping experiences, and the accessibility of offline stores in both urban and rural areas. As a result, the Offline segment maintains its leading position in the Corn Flake Market, providing consumers with convenient access to a wide range of breakfast cereal options.
Corn Flake Market Segmentation
By Type
Organic
Conventional
By Application
Breakfast Cereal
Snack
By Distribution Channel
Online
Offline
Countries Analyzed
North America (US, Canada, Mexico)
Europe (Germany, UK, France, Spain, Italy, Russia, Rest of Europe)
Asia Pacific (China, India, Japan, South Korea, Australia, South East Asia, Rest of Asia)
South America (Brazil, Argentina, Rest of South America)
Middle East and Africa (Saudi Arabia, UAE, Rest of Middle East, South Africa, Egypt, Rest of Africa)
Corn Flake Companies Profiled in the Study
Bagrrys
Barbara's Bakery
Consenza
Dr. Schär
Erewhon
Kellogg Company
Nestlé S.A.
Patanjali
*- List Not Exhaustive
Chapter 1. TABLE OF CONTENTS
Chapter 2. Introduction to Corn Flake Market
2.1. Market Overview
2.2. Key Statistics and Report Highlights
2.3. Scope of the Comprehensive Study
2.3.1. Market Definition
2.3.2 Countries and Regions Covered
2.3.3 Research Objective
2.3.4 Units, Currency, and Conversions
2.3.5 Industry Value Chain
2.4. Key Market Segments
2.5. Key Companies
2.6. Study Period
Chapter 3. Strategic Analysis Review
3.1. Corn Flake Pricing Analysis and Forecast
3.2. Porter’s Five Forces
3.3. Market Ecosystem
3.4. SWOT Analysis
3.5. Regulatory Scenario
3.3. Effects of Inflation, Russia-Ukraine War, moderating economic growth, and other macroeconomic factors
Chapter 4. Competitive Landscape
4.1. Market Share Analysis
4.1.1. Global Corn Flake Market Share by Company, 2023
4.1.2. Product Offerings of Leading Corn Flake Companies
4.2. Market Entropy
4.2.1. New Product Launches in the Industry
4.2.2. Mergers, Acquisitions, Joint ventures, and Partnerships
4.3. Key Strategies and Best Practices
Chapter 5. Global Market Projections: Best, Reference, and Low Case Scenarios
5.1. Growth Analysis- Case Scenario Definitions
5.2. Low Growth Case Scenario Forecasts
5.3. Reference Growth Case Scenario Forecasts
5.4. High Growth Case Scenario Forecasts
Chapter 6. Market Dynamics
6.1. Corn Flake Market Drivers
6.2. Corn Flake Market Challenges
6.6. Corn Flake Market Opportunities
6.4. Corn Flake Market Trends
Chapter 7. Global Corn Flake Market Outlook Trends
7.1. Global Corn Flake Revenue (USD Million) and CAGR (%) by Type (2021-2032)
7.2. Global Corn Flake Revenue (USD Million) and CAGR (%) by Application (2021-2032)
7.3. Global Corn Flake Revenue (USD Million) and CAGR (%) by Product (2021-2032)
By Type
Organic
Conventional
By Application
Breakfast Cereal
Snack
By Distribution Channel
Online
Offline
Chapter 8. Global Corn Flake Regional Analysis and Outlook
8.1. Global Corn Flake Revenue (USD Million) By Regions (2021- 2032)
8.2. North America Corn Flake Revenue (USD Million) by Country (2021-2032)
8.2.1. United States Corn Flake Regional Analysis and Outlook
8.2.2. Canada Corn Flake Regional Analysis and Outlook
8.2.3. Mexico Corn Flake Regional Analysis and Outlook
8.3. Europe Corn Flake Revenue (USD Million), by Country (2021-2032)
8.3.1. Germany Corn Flake Regional Analysis and Outlook
8.3.2. France Corn Flake Regional Analysis and Outlook
8.3.3. United Kingdom Corn Flake Regional Analysis and Outlook
8.3.4. Spain Corn Flake Regional Analysis and Outlook
8.3.5. Italy Corn Flake Regional Analysis and Outlook
8.3.6. Russia Corn Flake Regional Analysis and Outlook
8.3.7. Rest of Europe Corn Flake Regional Analysis and Outlook
8.4. Asia Pacific Corn Flake Revenue (USD Million) by Country (2021-2032)
8.4.1. China Corn Flake Regional Analysis and Outlook
8.4.2. Japan Corn Flake Regional Analysis and Outlook
8.4.3. India Corn Flake Regional Analysis and Outlook
8.4.4. South Korea Corn Flake Regional Analysis and Outlook
8.4.5. Australia Corn Flake Regional Analysis and Outlook
8.4.6. South East Asia Corn Flake Regional Analysis and Outlook
8.4.7. Rest of Asia Pacific Corn Flake Regional Analysis and Outlook
8.5. South America Corn Flake Revenue (USD Million), by Country (2021-2032)
8.5.1. Brazil Corn Flake Regional Analysis and Outlook
8.5.2. Argentina Corn Flake Regional Analysis and Outlook
8.5.3. Rest of South America Corn Flake Regional Analysis and Outlook
8.6. Middle East and Africa Corn Flake Revenue (USD Million) by Country (2021-2032)
8.6.1. Middle East Corn Flake Regional Analysis and Outlook
8.6.2. Africa Corn Flake Regional Analysis and Outlook
Chapter 9. North America Corn Flake Analysis and Outlook
9.1. North America Corn Flake Revenue (USD Million) by Segments (2021-2032)
9.1.1. North America Corn Flake Revenue (USD Million) by Type (2021-2032)
9.1.2. North America Corn Flake Revenue (USD Million) by Application (2021-2032)
9.1.3. North America Corn Flake Revenue (USD Million) by Product (2021-2032)
By Type
Organic
Conventional
By Application
Breakfast Cereal
Snack
By Distribution Channel
Online
Offline
Chapter 10. Europe Corn Flake Analysis and Outlook
10.1. Europe Corn Flake Revenue (USD Million), by Segments (USD Million) (2021-2032)
10.1.1. Europe Corn Flake Revenue (USD Million) by Type (2021-2032)
10.1.2. Europe Corn Flake Revenue (USD Million) by Application (2021-2032)
10.1.3. Europe Corn Flake Revenue (USD Million) by Product (2021-2032)
By Type
Organic
Conventional
By Application
Breakfast Cereal
Snack
By Distribution Channel
Online
Offline
Chapter 11. Asia Pacific Corn Flake Analysis and Outlook
11.1. Asia Pacific Corn Flake Revenue (USD Million), and Revenue (USD Million) by Segments (2021-2032)
11.1.1. Asia Pacific Corn Flake Revenue (USD Million) by Type (2021-2032)
11.1.2. Asia Pacific Corn Flake Revenue (USD Million) by Application (2021-2032)
11.1.3. Asia Pacific Corn Flake Revenue (USD Million) by Product (2021-2032)
By Type
Organic
Conventional
By Application
Breakfast Cereal
Snack
By Distribution Channel
Online
Offline
Chapter 12. South America Corn Flake Analysis and Outlook
12.1. South America Corn Flake Revenue (USD Million), by Segments (2021-2032)
12.1.1. South America Corn Flake Revenue (USD Million) by Type (2021-2032)
12.1.2. South America Corn Flake Revenue (USD Million) by Application (2021-2032)
12.1.3. South America Corn Flake Revenue (USD Million) by Product (2021-2032)
By Type
Organic
Conventional
By Application
Breakfast Cereal
Snack
By Distribution Channel
Online
Offline
Chapter 13. Middle East and Africa Corn Flake Analysis and Outlook
13.1. Middle East and Africa Corn Flake Revenue (USD Million), by Segments (2021-2032)
13.1.1. Middle East and Africa Corn Flake Revenue (USD Million) by Type (2021-2032)
13.1.2. Middle East and Africa Corn Flake Revenue (USD Million) by Application (2021-2032)
13.1.3. Middle East and Africa Corn Flake Revenue (USD Million) by Product (2021-2032)
By Type
Organic
Conventional
By Application
Breakfast Cereal
Snack
By Distribution Channel
Online
Offline
Chapter 14. Corn Flake Company Profiles
14.1 Business Overview
14.2 Product Profiles
14.3 SWOT Profiles
14.5 Recent Developments
14.6 Financial Profile
List of Companies
Bagrrys
Barbara's Bakery
Consenza
Dr. Schär
Erewhon
Kellogg Company
Nestlé S.A.
Patanjali
15. Methodology and Data Sources
15.1 Customization Offerings
15.2 Subscription Services
15.3 Related Reports
15.4 Publisher Expertise
LIST OF TABLES
Table 1 Market Segmentation Analysis
Table 2 Global Corn Flake Market Share of Leading Companies, 2023
Table 3 Product Offerings of Leading Companies
Table 4 Low Growth Scenario Forecasts
Table 5 Reference Case Growth Scenario
Table 6 High Growth Case Scenario
Table 7 Global Corn Flake Revenue (USD Million) And CAGR (%) By Type (2021-2032)
Table 8 Global Corn Flake Revenue (USD Million) And CAGR (%) By Application (2021-2032)
Table 9 Global Corn Flake Revenue (USD Million) And CAGR (%) By Product (2021-2032)
Table 10 Global Corn Flake Market Revenue (USD Million) By Regions (2021-2032)
Table 11 Global Corn Flake Market Share (%) By Regions (2021-2032)
Table 12 North America Corn Flake Revenue (USD Million) By Country (2021-2032)
Table 13 Europe Corn Flake Revenue (USD Million) By Country (2021-2032)
Table 14 Asia Pacific Corn Flake Revenue (USD Million) By Country (2021-2032)
Table 15 South America Corn Flake Revenue (USD Million) By Country (2021-2032)
Table 16 Middle East and Africa Corn Flake Revenue (USD Million) By Region (2021-2032)
Table 17 North America Corn Flake Revenue (USD Million) By Type (2021-2032)
Table 18 North America Corn Flake Revenue (USD Million) By Application (2021-2032)
Table 19 North America Corn Flake Revenue (USD Million) By Product (2021-2032)
Table 20 Europe Corn Flake Revenue (USD Million) By Type (2021-2032)
Table 21 Europe Corn Flake Revenue (USD Million) By Application (2021-2032)
Table 22 Europe Corn Flake Revenue (USD Million) By Product (2021-2032)
Table 23 Asia Pacific Corn Flake Revenue (USD Million) By Type (2021-2032)
Table 24 Asia Pacific Corn Flake Revenue (USD Million) By Application (2021-2032)
Table 25 Asia Pacific Corn Flake Revenue (USD Million) By Product (2021-2032)
Table 26 South America Corn Flake Revenue (USD Million) By Type (2021-2032)
Table 27 South America Corn Flake Revenue (USD Million) By Application (2021-2032)
Table 28 South America Corn Flake Revenue (USD Million) By Product (2021-2032)
Table 29 Middle East and Africa Corn Flake Revenue (USD Million) By Type (2021-2032)
Table 30 Middle East and Africa Corn Flake Revenue (USD Million) By Application (2021-2032)
Table 31 Middle East and Africa Corn Flake Revenue (USD Million) By Product (2021-2032)
LIST OF FIGURES
Figure 1. Market Scope
Figure 2. Pricing Forecasts Per Unit, 2023- 2032
Figure 3. Porter’s Five Forces
Figure 4. Global Corn Flake Market Revenue (USD Million) By Regions (2021-2032)
Figure 5. Global Corn Flake Market Share (%) By Regions (2023)
Figure 6. North America Corn Flake Revenue (USD Million) By Country (2021-2032)
Figure 7. United States Corn Flake Revenue (USD Million) By Country (2021-2032)
Figure 8. Canada Corn Flake Revenue (USD Million) By Country (2021-2032)
Figure 9. Mexico Corn Flake Revenue (USD Million) By Country (2021-2032)
Figure 10. Europe Corn Flake Revenue (USD Million) By Country (2021-2032)
Figure 11. Germany Corn Flake Revenue (USD Million) By Country (2021-2032)
Figure 12. France Corn Flake Revenue (USD Million) By Country (2021-2032)
Figure 13. United Kingdom Corn Flake Revenue (USD Million) By Country (2021-2032)
Figure 14. Spain Corn Flake Revenue (USD Million) By Country (2021-2032)
Figure 15. Italy Corn Flake Revenue (USD Million) By Country (2021-2032)
Figure 16. Russia Corn Flake Revenue (USD Million) By Country (2021-2032)
Figure 17. Rest of Europe Corn Flake Revenue (USD Million) By Country (2021-2032)
Figure 11. Asia Pacific Corn Flake Revenue (USD Million) By Country (2021-2032)
Figure 12. China Corn Flake Revenue (USD Million) By Country (2021-2032)
Figure 13. Japan Corn Flake Revenue (USD Million) By Country (2021-2032)
Figure 14. India Corn Flake Revenue (USD Million) By Country (2021-2032)
Figure 15. South Korea Corn Flake Revenue (USD Million) By Country (2021-2032)
Figure 16. Australia Corn Flake Revenue (USD Million) By Country (2021-2032)
Figure 17. South East Asia Corn Flake Revenue (USD Million) By Country (2021-2032)
Figure 18. South America Corn Flake Revenue (USD Million) By Country (2021-2032)
Figure 19. Brazil Corn Flake Revenue (USD Million) By Country (2021-2032)
Figure 20. Argentina Corn Flake Revenue (USD Million) By Country (2021-2032)
Figure 21. Rest of Asia Pacific Corn Flake Revenue (USD Million) By Country (2021-2032)
Figure 22. Middle East and Africa Corn Flake Revenue (USD Million) By Region (2021-2032)
Figure 23. Saudi Arabia Corn Flake Revenue (USD Million) By Region (2021-2032)
Figure 24. The UAE Corn Flake Revenue (USD Million) By Region (2021-2032)
Figure 25. Rest of Middle East Corn Flake Revenue (USD Million) By Region (2021-2032)
Figure 26. South Africa Corn Flake Revenue (USD Million) By Region (2021-2032)
Figure 27. Africa Corn Flake Revenue (USD Million) By Region (2021-2032)
Figure 28. North America Corn Flake Revenue (USD Million) By Type (2021-2032)
Figure 29. North America Corn Flake Revenue (USD Million) By Application (2021-2032)
Figure 30. North America Corn Flake Revenue (USD Million) By Product (2021-2032)
Figure 31. Europe Corn Flake Revenue (USD Million) By Type (2021-2032)
Figure 32. Europe Corn Flake Revenue (USD Million) By Application (2021-2032)
Figure 33. Europe Corn Flake Revenue (USD Million) By Product (2021-2032)
Figure 34. Asia Pacific Corn Flake Revenue (USD Million) By Type (2021-2032)
Figure 35. Asia Pacific Corn Flake Revenue (USD Million) By Application (2021-2032)
Figure 36. Asia Pacific Corn Flake Revenue (USD Million) By Product (2021-2032)
Figure 37. South America Corn Flake Revenue (USD Million) By Type (2021-2032)
Figure 38. South America Corn Flake Revenue (USD Million) By Application (2021-2032)
Figure 39. South America Corn Flake Revenue (USD Million) By Product (2021-2032)
Figure 40. Middle East and Africa Corn Flake Revenue (USD Million) By Type (2021-2032)
Figure 41. Middle East and Africa Corn Flake Revenue (USD Million) By Application (2021-2032)
Figure 42. Middle East and Africa Corn Flake Revenue (USD Million) By Product (2021-2032)
By Type
Organic
Conventional
By Application
Breakfast Cereal
Snack
By Distribution Channel
Online
Offline
Countries Analyzed
North America (US, Canada, Mexico)
Europe (Germany, UK, France, Spain, Italy, Russia, Rest of Europe)
Asia Pacific (China, India, Japan, South Korea, Australia, South East Asia, Rest of Asia)
South America (Brazil, Argentina, Rest of South America)
Middle East and Africa (Saudi Arabia, UAE, Rest of Middle East, South Africa, Egypt, Rest of Africa)
