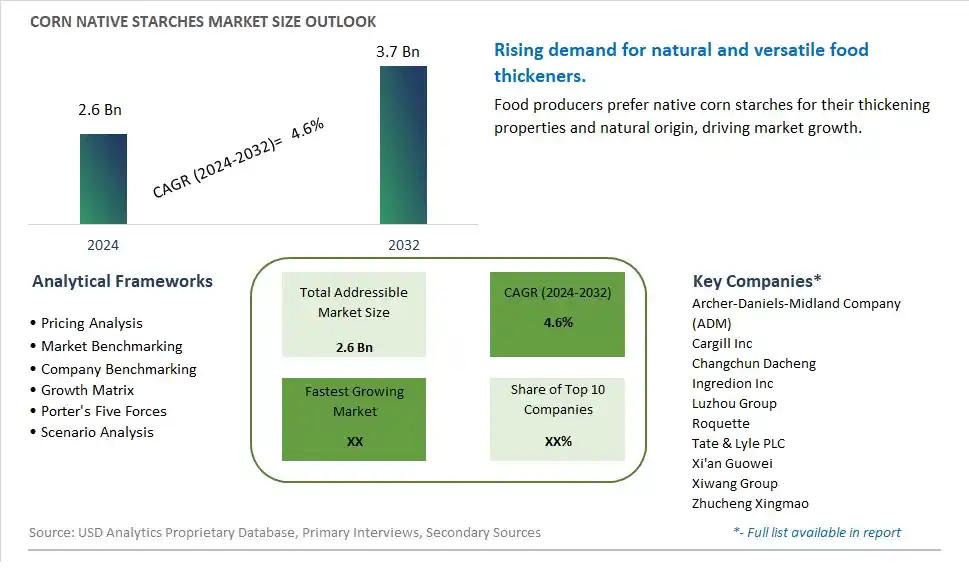
Global Corn Native Starches Market Size is valued at $2.6 Billion in 2024 and is forecast to register a growth rate (CAGR) of 4.6% to reach $3.7 Billion by 2032.
The global Corn Native Starches Market Comprehensive Study analyzes and forecasts the market size across 6 regions and 24 countries for diverse segments -By Type (Food Grade, Industrial Grade), By Application (Food, Medicine, Personal Care, Textile, Others)
An Introduction to Corn Native Starches Market
In 2024, the Corn Native Starches market is witnessing significant growth, driven by the increasing demand for natural and functional ingredients in the food, beverage, and industrial sectors. Corn native starches, derived directly from corn without chemical modification, are valued for their thickening, gelling, and stabilizing properties. The market is supported by the growing trend towards clean-label and natural ingredients. Advances in corn processing and starch extraction technologies are enhancing the quality, functionality, and application versatility of corn native starches. The market is also benefiting from the trend towards sustainable and eco-friendly products, appealing to manufacturers and consumers seeking high-quality and natural starch solutions.
Corn Native Starches Competitive Landscape
The market report analyses the leading companies in the industry including Archer-Daniels-Midland Company (ADM), Cargill Inc, Changchun Dacheng, Ingredion Inc, Luzhou Group, Roquette, Tate & Lyle PLC, Xi'an Guowei, Xiwang Group, Zhucheng Xingmao, and Others.
Corn Native Starches Market Dynamics
Corn Native Starches Market Trend: Growing Demand for Clean Label Ingredients
A significant market trend in the Corn Native Starches sector is the increasing demand for clean label ingredients. Consumers are becoming more conscious about their food choices, preferring products with simple, natural, and easily recognizable ingredients. Corn native starches, being derived from corn and free from additives or modifications, align well with the clean label trend. This trend is driving manufacturers to use corn native starches as key ingredients in various food and beverage products.
Corn Native Starches Market Driver: Expansion in Food and Beverage Industry
The market driver for Corn Native Starches is the expansion of the food and beverage industry. With the rising demand for processed foods, convenience products, and functional ingredients, there is a growing need for versatile and functional starches like corn native starches. These starches offer excellent thickening, gelling, and binding properties, making them essential in a wide range of food applications, from soups and sauces to bakery and dairy products.
Corn Native Starches Market Opportunity: Innovation in Clean Label Product Development
An opportunity within the Corn Native Starches market lies in innovation and product development focused on clean label solutions. Manufacturers can leverage the clean label trend by developing new formulations and applications for corn native starches that meet clean label criteria while delivering superior functionality and performance. This can involve creating clean label alternatives to modified starches, emulsifiers, and stabilizers, catering to the growing demand for natural and minimally processed ingredients in the food industry. By tapping into this opportunity, companies can differentiate their offerings, attract health-conscious consumers, and capitalize on the clean label movement's momentum.
Corn Native Starches Market Share Analysis: Food Grade segment generated the highest revenue share in the industry
The Food Grade segment is the largest in the Corn Native Starches Market by type. This segment's dominance is attributed to the extensive use of food-grade corn native starches in the food and beverage industry. Food-grade corn native starches are derived from corn kernels and are utilized as key ingredients in a wide range of food products such as sauces, soups, dressings, dairy products, baked goods, snacks, and confectionery items. They serve as thickeners, stabilizers, emulsifiers, texture enhancers, and binding agents, contributing to the desired taste, texture, and mouthfeel of food formulations. The natural properties of food-grade corn native starches, such as their neutral flavor, opacity, and ability to withstand various processing conditions, make them versatile and indispensable in food manufacturing processes. Additionally, the increasing demand for clean-label, natural, and gluten-free food products drives the consumption of food-grade corn native starches as preferred alternatives to synthetic additives and thickeners. The Food Grade segment's market leadership is further supported by ongoing product innovations, technological advancements in starch extraction and processing, and their regulatory approval for food use. As a result, food-grade corn native starches continue to dominate the Corn Native Starches Market, serving as essential ingredients in a diverse array of food applications.
Corn Native Starches Market Share Analysis: Food is the fastest growing segment over the forecast period to 2032
The Food segment is projected to be the fastest-growing application in the Corn Native Starches Market by 2032. This rapid growth is driven by several key factors that highlight the increasing demand for food-grade corn native starches in the food and beverage industry. Food-grade corn native starches serve as essential ingredients in a wide range of food products, including sauces, soups, dressings, dairy products, baked goods, snacks, and confectionery items. Their functional properties as thickeners, stabilizers, emulsifiers, and texture enhancers contribute to the desired taste, texture, and shelf stability of food formulations. Additionally, the growing consumer preference for natural, clean-label, and gluten-free food products fuels the adoption of food-grade corn native starches as alternatives to synthetic additives and thickeners. The versatility, functionality, and regulatory approval of food-grade corn native starches for food use drive their rapid growth in the Food segment. Further, technological advancements in starch extraction, processing, and application techniques further support the expansion of this segment. As a result, the Food segment is poised for significant growth, driven by its pivotal role in meeting the evolving consumer preferences and industry demands for high-quality, natural food ingredients.
Corn Native Starches Market Segmentation
By Type
Food Grade
Industrial Grade
By Application
Food
Medicine
Personal Care
Textile
Others
Countries Analyzed
North America (US, Canada, Mexico)
Europe (Germany, UK, France, Spain, Italy, Russia, Rest of Europe)
Asia Pacific (China, India, Japan, South Korea, Australia, South East Asia, Rest of Asia)
South America (Brazil, Argentina, Rest of South America)
Middle East and Africa (Saudi Arabia, UAE, Rest of Middle East, South Africa, Egypt, Rest of Africa)
Corn Native Starches Companies Profiled in the Study
Archer-Daniels-Midland Company (ADM)
Cargill Inc
Changchun Dacheng
Ingredion Inc
Luzhou Group
Roquette
Tate & Lyle PLC
Xi'an Guowei
Xiwang Group
Zhucheng Xingmao
*- List Not Exhaustive
Chapter 1. TABLE OF CONTENTS
Chapter 2. Introduction to Corn Native Starches Market
2.1. Market Overview
2.2. Key Statistics and Report Highlights
2.3. Scope of the Comprehensive Study
2.3.1. Market Definition
2.3.2 Countries and Regions Covered
2.3.3 Research Objective
2.3.4 Units, Currency, and Conversions
2.3.5 Industry Value Chain
2.4. Key Market Segments
2.5. Key Companies
2.6. Study Period
Chapter 3. Strategic Analysis Review
3.1. Corn Native Starches Pricing Analysis and Forecast
3.2. Porter’s Five Forces
3.3. Market Ecosystem
3.4. SWOT Analysis
3.5. Regulatory Scenario
3.3. Effects of Inflation, Russia-Ukraine War, moderating economic growth, and other macroeconomic factors
Chapter 4. Competitive Landscape
4.1. Market Share Analysis
4.1.1. Global Corn Native Starches Market Share by Company, 2023
4.1.2. Product Offerings of Leading Corn Native Starches Companies
4.2. Market Entropy
4.2.1. New Product Launches in the Industry
4.2.2. Mergers, Acquisitions, Joint ventures, and Partnerships
4.3. Key Strategies and Best Practices
Chapter 5. Global Market Projections: Best, Reference, and Low Case Scenarios
5.1. Growth Analysis- Case Scenario Definitions
5.2. Low Growth Case Scenario Forecasts
5.3. Reference Growth Case Scenario Forecasts
5.4. High Growth Case Scenario Forecasts
Chapter 6. Market Dynamics
6.1. Corn Native Starches Market Drivers
6.2. Corn Native Starches Market Challenges
6.6. Corn Native Starches Market Opportunities
6.4. Corn Native Starches Market Trends
Chapter 7. Global Corn Native Starches Market Outlook Trends
7.1. Global Corn Native Starches Revenue (USD Million) and CAGR (%) by Type (2021-2032)
7.2. Global Corn Native Starches Revenue (USD Million) and CAGR (%) by Application (2021-2032)
7.3. Global Corn Native Starches Revenue (USD Million) and CAGR (%) by Product (2021-2032)
By Type
Food Grade
Industrial Grade
By Application
Food
Medicine
Personal Care
Textile
Others
Chapter 8. Global Corn Native Starches Regional Analysis and Outlook
8.1. Global Corn Native Starches Revenue (USD Million) By Regions (2021- 2032)
8.2. North America Corn Native Starches Revenue (USD Million) by Country (2021-2032)
8.2.1. United States Corn Native Starches Regional Analysis and Outlook
8.2.2. Canada Corn Native Starches Regional Analysis and Outlook
8.2.3. Mexico Corn Native Starches Regional Analysis and Outlook
8.3. Europe Corn Native Starches Revenue (USD Million), by Country (2021-2032)
8.3.1. Germany Corn Native Starches Regional Analysis and Outlook
8.3.2. France Corn Native Starches Regional Analysis and Outlook
8.3.3. United Kingdom Corn Native Starches Regional Analysis and Outlook
8.3.4. Spain Corn Native Starches Regional Analysis and Outlook
8.3.5. Italy Corn Native Starches Regional Analysis and Outlook
8.3.6. Russia Corn Native Starches Regional Analysis and Outlook
8.3.7. Rest of Europe Corn Native Starches Regional Analysis and Outlook
8.4. Asia Pacific Corn Native Starches Revenue (USD Million) by Country (2021-2032)
8.4.1. China Corn Native Starches Regional Analysis and Outlook
8.4.2. Japan Corn Native Starches Regional Analysis and Outlook
8.4.3. India Corn Native Starches Regional Analysis and Outlook
8.4.4. South Korea Corn Native Starches Regional Analysis and Outlook
8.4.5. Australia Corn Native Starches Regional Analysis and Outlook
8.4.6. South East Asia Corn Native Starches Regional Analysis and Outlook
8.4.7. Rest of Asia Pacific Corn Native Starches Regional Analysis and Outlook
8.5. South America Corn Native Starches Revenue (USD Million), by Country (2021-2032)
8.5.1. Brazil Corn Native Starches Regional Analysis and Outlook
8.5.2. Argentina Corn Native Starches Regional Analysis and Outlook
8.5.3. Rest of South America Corn Native Starches Regional Analysis and Outlook
8.6. Middle East and Africa Corn Native Starches Revenue (USD Million) by Country (2021-2032)
8.6.1. Middle East Corn Native Starches Regional Analysis and Outlook
8.6.2. Africa Corn Native Starches Regional Analysis and Outlook
Chapter 9. North America Corn Native Starches Analysis and Outlook
9.1. North America Corn Native Starches Revenue (USD Million) by Segments (2021-2032)
9.1.1. North America Corn Native Starches Revenue (USD Million) by Type (2021-2032)
9.1.2. North America Corn Native Starches Revenue (USD Million) by Application (2021-2032)
9.1.3. North America Corn Native Starches Revenue (USD Million) by Product (2021-2032)
By Type
Food Grade
Industrial Grade
By Application
Food
Medicine
Personal Care
Textile
Others
Chapter 10. Europe Corn Native Starches Analysis and Outlook
10.1. Europe Corn Native Starches Revenue (USD Million), by Segments (USD Million) (2021-2032)
10.1.1. Europe Corn Native Starches Revenue (USD Million) by Type (2021-2032)
10.1.2. Europe Corn Native Starches Revenue (USD Million) by Application (2021-2032)
10.1.3. Europe Corn Native Starches Revenue (USD Million) by Product (2021-2032)
By Type
Food Grade
Industrial Grade
By Application
Food
Medicine
Personal Care
Textile
Others
Chapter 11. Asia Pacific Corn Native Starches Analysis and Outlook
11.1. Asia Pacific Corn Native Starches Revenue (USD Million), and Revenue (USD Million) by Segments (2021-2032)
11.1.1. Asia Pacific Corn Native Starches Revenue (USD Million) by Type (2021-2032)
11.1.2. Asia Pacific Corn Native Starches Revenue (USD Million) by Application (2021-2032)
11.1.3. Asia Pacific Corn Native Starches Revenue (USD Million) by Product (2021-2032)
By Type
Food Grade
Industrial Grade
By Application
Food
Medicine
Personal Care
Textile
Others
Chapter 12. South America Corn Native Starches Analysis and Outlook
12.1. South America Corn Native Starches Revenue (USD Million), by Segments (2021-2032)
12.1.1. South America Corn Native Starches Revenue (USD Million) by Type (2021-2032)
12.1.2. South America Corn Native Starches Revenue (USD Million) by Application (2021-2032)
12.1.3. South America Corn Native Starches Revenue (USD Million) by Product (2021-2032)
By Type
Food Grade
Industrial Grade
By Application
Food
Medicine
Personal Care
Textile
Others
Chapter 13. Middle East and Africa Corn Native Starches Analysis and Outlook
13.1. Middle East and Africa Corn Native Starches Revenue (USD Million), by Segments (2021-2032)
13.1.1. Middle East and Africa Corn Native Starches Revenue (USD Million) by Type (2021-2032)
13.1.2. Middle East and Africa Corn Native Starches Revenue (USD Million) by Application (2021-2032)
13.1.3. Middle East and Africa Corn Native Starches Revenue (USD Million) by Product (2021-2032)
By Type
Food Grade
Industrial Grade
By Application
Food
Medicine
Personal Care
Textile
Others
Chapter 14. Corn Native Starches Company Profiles
14.1 Business Overview
14.2 Product Profiles
14.3 SWOT Profiles
14.5 Recent Developments
14.6 Financial Profile
List of Companies
Archer-Daniels-Midland Company (ADM)
Cargill Inc
Changchun Dacheng
Ingredion Inc
Luzhou Group
Roquette
Tate & Lyle PLC
Xi'an Guowei
Xiwang Group
Zhucheng Xingmao
15. Methodology and Data Sources
15.1 Customization Offerings
15.2 Subscription Services
15.3 Related Reports
15.4 Publisher Expertise
LIST OF TABLES
Table 1 Market Segmentation Analysis
Table 2 Global Corn Native Starches Market Share of Leading Companies, 2023
Table 3 Product Offerings of Leading Companies
Table 4 Low Growth Scenario Forecasts
Table 5 Reference Case Growth Scenario
Table 6 High Growth Case Scenario
Table 7 Global Corn Native Starches Revenue (USD Million) And CAGR (%) By Type (2021-2032)
Table 8 Global Corn Native Starches Revenue (USD Million) And CAGR (%) By Application (2021-2032)
Table 9 Global Corn Native Starches Revenue (USD Million) And CAGR (%) By Product (2021-2032)
Table 10 Global Corn Native Starches Market Revenue (USD Million) By Regions (2021-2032)
Table 11 Global Corn Native Starches Market Share (%) By Regions (2021-2032)
Table 12 North America Corn Native Starches Revenue (USD Million) By Country (2021-2032)
Table 13 Europe Corn Native Starches Revenue (USD Million) By Country (2021-2032)
Table 14 Asia Pacific Corn Native Starches Revenue (USD Million) By Country (2021-2032)
Table 15 South America Corn Native Starches Revenue (USD Million) By Country (2021-2032)
Table 16 Middle East and Africa Corn Native Starches Revenue (USD Million) By Region (2021-2032)
Table 17 North America Corn Native Starches Revenue (USD Million) By Type (2021-2032)
Table 18 North America Corn Native Starches Revenue (USD Million) By Application (2021-2032)
Table 19 North America Corn Native Starches Revenue (USD Million) By Product (2021-2032)
Table 20 Europe Corn Native Starches Revenue (USD Million) By Type (2021-2032)
Table 21 Europe Corn Native Starches Revenue (USD Million) By Application (2021-2032)
Table 22 Europe Corn Native Starches Revenue (USD Million) By Product (2021-2032)
Table 23 Asia Pacific Corn Native Starches Revenue (USD Million) By Type (2021-2032)
Table 24 Asia Pacific Corn Native Starches Revenue (USD Million) By Application (2021-2032)
Table 25 Asia Pacific Corn Native Starches Revenue (USD Million) By Product (2021-2032)
Table 26 South America Corn Native Starches Revenue (USD Million) By Type (2021-2032)
Table 27 South America Corn Native Starches Revenue (USD Million) By Application (2021-2032)
Table 28 South America Corn Native Starches Revenue (USD Million) By Product (2021-2032)
Table 29 Middle East and Africa Corn Native Starches Revenue (USD Million) By Type (2021-2032)
Table 30 Middle East and Africa Corn Native Starches Revenue (USD Million) By Application (2021-2032)
Table 31 Middle East and Africa Corn Native Starches Revenue (USD Million) By Product (2021-2032)
LIST OF FIGURES
Figure 1. Market Scope
Figure 2. Pricing Forecasts Per Unit, 2023- 2032
Figure 3. Porter’s Five Forces
Figure 4. Global Corn Native Starches Market Revenue (USD Million) By Regions (2021-2032)
Figure 5. Global Corn Native Starches Market Share (%) By Regions (2023)
Figure 6. North America Corn Native Starches Revenue (USD Million) By Country (2021-2032)
Figure 7. United States Corn Native Starches Revenue (USD Million) By Country (2021-2032)
Figure 8. Canada Corn Native Starches Revenue (USD Million) By Country (2021-2032)
Figure 9. Mexico Corn Native Starches Revenue (USD Million) By Country (2021-2032)
Figure 10. Europe Corn Native Starches Revenue (USD Million) By Country (2021-2032)
Figure 11. Germany Corn Native Starches Revenue (USD Million) By Country (2021-2032)
Figure 12. France Corn Native Starches Revenue (USD Million) By Country (2021-2032)
Figure 13. United Kingdom Corn Native Starches Revenue (USD Million) By Country (2021-2032)
Figure 14. Spain Corn Native Starches Revenue (USD Million) By Country (2021-2032)
Figure 15. Italy Corn Native Starches Revenue (USD Million) By Country (2021-2032)
Figure 16. Russia Corn Native Starches Revenue (USD Million) By Country (2021-2032)
Figure 17. Rest of Europe Corn Native Starches Revenue (USD Million) By Country (2021-2032)
Figure 11. Asia Pacific Corn Native Starches Revenue (USD Million) By Country (2021-2032)
Figure 12. China Corn Native Starches Revenue (USD Million) By Country (2021-2032)
Figure 13. Japan Corn Native Starches Revenue (USD Million) By Country (2021-2032)
Figure 14. India Corn Native Starches Revenue (USD Million) By Country (2021-2032)
Figure 15. South Korea Corn Native Starches Revenue (USD Million) By Country (2021-2032)
Figure 16. Australia Corn Native Starches Revenue (USD Million) By Country (2021-2032)
Figure 17. South East Asia Corn Native Starches Revenue (USD Million) By Country (2021-2032)
Figure 18. South America Corn Native Starches Revenue (USD Million) By Country (2021-2032)
Figure 19. Brazil Corn Native Starches Revenue (USD Million) By Country (2021-2032)
Figure 20. Argentina Corn Native Starches Revenue (USD Million) By Country (2021-2032)
Figure 21. Rest of Asia Pacific Corn Native Starches Revenue (USD Million) By Country (2021-2032)
Figure 22. Middle East and Africa Corn Native Starches Revenue (USD Million) By Region (2021-2032)
Figure 23. Saudi Arabia Corn Native Starches Revenue (USD Million) By Region (2021-2032)
Figure 24. The UAE Corn Native Starches Revenue (USD Million) By Region (2021-2032)
Figure 25. Rest of Middle East Corn Native Starches Revenue (USD Million) By Region (2021-2032)
Figure 26. South Africa Corn Native Starches Revenue (USD Million) By Region (2021-2032)
Figure 27. Africa Corn Native Starches Revenue (USD Million) By Region (2021-2032)
Figure 28. North America Corn Native Starches Revenue (USD Million) By Type (2021-2032)
Figure 29. North America Corn Native Starches Revenue (USD Million) By Application (2021-2032)
Figure 30. North America Corn Native Starches Revenue (USD Million) By Product (2021-2032)
Figure 31. Europe Corn Native Starches Revenue (USD Million) By Type (2021-2032)
Figure 32. Europe Corn Native Starches Revenue (USD Million) By Application (2021-2032)
Figure 33. Europe Corn Native Starches Revenue (USD Million) By Product (2021-2032)
Figure 34. Asia Pacific Corn Native Starches Revenue (USD Million) By Type (2021-2032)
Figure 35. Asia Pacific Corn Native Starches Revenue (USD Million) By Application (2021-2032)
Figure 36. Asia Pacific Corn Native Starches Revenue (USD Million) By Product (2021-2032)
Figure 37. South America Corn Native Starches Revenue (USD Million) By Type (2021-2032)
Figure 38. South America Corn Native Starches Revenue (USD Million) By Application (2021-2032)
Figure 39. South America Corn Native Starches Revenue (USD Million) By Product (2021-2032)
Figure 40. Middle East and Africa Corn Native Starches Revenue (USD Million) By Type (2021-2032)
Figure 41. Middle East and Africa Corn Native Starches Revenue (USD Million) By Application (2021-2032)
Figure 42. Middle East and Africa Corn Native Starches Revenue (USD Million) By Product (2021-2032)
By Type
Food Grade
Industrial Grade
By Application
Food
Medicine
Personal Care
Textile
Others
Countries Analyzed
North America (US, Canada, Mexico)
Europe (Germany, UK, France, Spain, Italy, Russia, Rest of Europe)
Asia Pacific (China, India, Japan, South Korea, Australia, South East Asia, Rest of Asia)
South America (Brazil, Argentina, Rest of South America)
Middle East and Africa (Saudi Arabia, UAE, Rest of Middle East, South Africa, Egypt, Rest of Africa)
