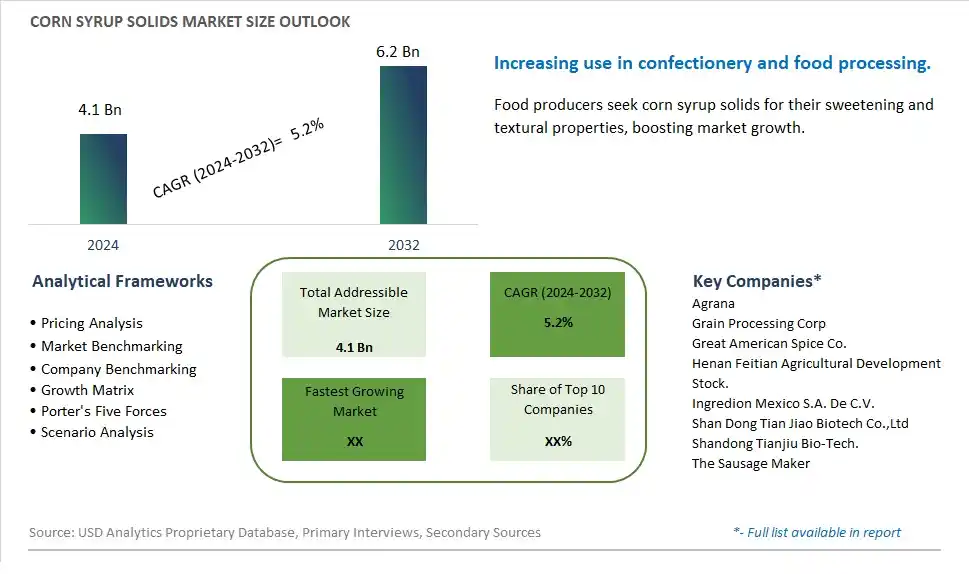
Global Corn Syrup Solids Market Size is valued at $4.1 Billion in 2024 and is forecast to register a growth rate (CAGR) of 5.2% to reach $6.2 Billion by 2032.
The global Corn Syrup Solids Market Comprehensive Study analyzes and forecasts the market size across 6 regions and 24 countries for diverse segments -By Type (Corn Syrup Solids, low calorie corn syrup solid, Corn Syrup Solid Maltodextrin), By Application (Personal Use, Companies, Restaurant, Coffeehouse, Convenience Stores, Others)
An Introduction to Corn Syrup Solids Market
The Corn Syrup Solids market in 2024 is expanding rapidly, driven by the increasing demand for versatile sweeteners and functional ingredients in the food and beverage industry. Corn syrup solids, made from dehydrated corn syrup, are used to provide sweetness, improve texture, and enhance moisture retention in various products such as baked goods, confections, and beverages. The market is supported by the growing trend towards convenient and shelf-stable ingredients. Advances in corn syrup processing and drying technologies are enhancing the quality, consistency, and application versatility of corn syrup solids. The market is also benefiting from the trend towards clean-label and natural sweeteners, appealing to manufacturers and consumers seeking reliable and functional sugar alternatives.
Corn Syrup Solids Competitive Landscape
The market report analyses the leading companies in the industry including Agrana, Grain Processing Corp, Great American Spice Co., Henan Feitian Agricultural Development Stock., Ingredion Mexico S.A. De C.V., Shan Dong Tian Jiao Biotech Co.,Ltd, Shandong Tianjiu Bio-Tech., The Sausage Maker, and Others.
Corn Syrup Solids Market Dynamics
Corn Syrup Solids Market Trend: Shift Towards Natural Sweeteners
A prominent market trend for Corn Syrup Solids is the shift towards natural sweeteners in the food and beverage industry. With increasing health awareness and concerns about artificial ingredients, consumers are seeking natural alternatives to traditional sweeteners like sugar and corn syrup. This trend is driving the demand for corn syrup solids derived from non-GMO corn sources, which are perceived as more natural and healthier options.
Corn Syrup Solids Market Driver: Demand for Processed Foods and Beverages
The market driver for Corn Syrup Solids is the growing demand for processed foods and beverages. Corn syrup solids are widely used as sweeteners, thickeners, and stabilizers in various food and beverage applications such as baked goods, confectionery products, dairy products, and sauces. The convenience, functionality, and cost-effectiveness of corn syrup solids make them essential ingredients for manufacturers looking to enhance texture, sweetness, and shelf life in their products.
Corn Syrup Solids Market Opportunity: Clean Label Formulations and Health-Conscious Products
An opportunity within the Corn Syrup Solids market lies in clean label formulations and health-conscious products. Manufacturers can capitalize on the trend towards clean label ingredients by offering corn syrup solids derived from non-GMO corn and promoting them as natural sweeteners without artificial additives. Additionally, there is an opportunity to develop healthier product options by using corn syrup solids in reduced-sugar or sugar-free formulations, catering to consumers' preferences for lower-sugar and healthier alternatives. By focusing on clean label attributes and health-conscious trends, companies can differentiate their offerings and capture market share in the growing natural sweeteners segment.
Corn Syrup Solids Market Share Analysis: Corn Syrup Solids segment generated the highest revenue share in the industry
The Corn Syrup Solids segment is the largest in the Corn Syrup Solids Market by type. This segment's dominance is attributed to the widespread use of corn syrup solids in various industries, including food and beverage, pharmaceuticals, personal care, and industrial applications. Corn syrup solids are a concentrated form of corn syrup, processed to remove water content and create a dry, powdered form. They serve as versatile ingredients, functioning as sweeteners, bulking agents, thickeners, and stabilizers in food formulations such as baked goods, beverages, dairy products, confectionery items, and processed foods. The low-calorie corn syrup solid variant caters to health-conscious consumers seeking reduced-calorie alternatives without compromising on sweetness or texture. Additionally, corn syrup solids are utilized in pharmaceutical formulations, personal care products like cosmetics and toiletries, and industrial applications such as adhesives and coatings. The Corn Syrup Solids segment's market leadership is further bolstered by their cost-effectiveness, long shelf life, ease of handling, and compatibility with various production processes. As a result, corn syrup solids maintain their status as essential ingredients across multiple industries, driving the growth of the Corn Syrup Solids Market.
Corn Syrup Solids Market Share Analysis: Restaurant is the fastest growing segment over the forecast period to 2032
The Restaurant segment is projected to be the fastest-growing application in the Corn Syrup Solids Market by 2032. This rapid growth is driven by several factors that highlight the increasing demand for corn syrup solids in restaurant operations and foodservice establishments. Corn syrup solids are commonly used in the restaurant industry as ingredients in various food and beverage preparations. They serve as sweeteners, thickeners, and stabilizers in sauces, dressings, marinades, desserts, beverages, and other culinary creations. The Restaurant segment's fast growth is fueled by the expansion of the global restaurant industry, rising consumer preference for convenience foods, and the incorporation of corn syrup solids into diverse menu offerings to enhance flavor profiles, texture, and shelf stability. Additionally, the versatility, cost-effectiveness, and ease of use of corn syrup solids make them attractive ingredients for restaurant chefs and foodservice professionals seeking efficient solutions for recipe formulation and menu development. As restaurant chains, coffeehouses, and dining establishments continue to innovate and cater to evolving consumer tastes, the demand for corn syrup solids in the Restaurant segment is expected to surge, contributing significantly to the overall growth of the Corn Syrup Solids Market.
Corn Syrup Solids Market Segmentation
By Type
Corn Syrup Solids
low calorie corn syrup solid
Corn Syrup Solid Maltodextrin
By Application
Personal Use
Companies
Restaurant
Coffeehouse
Convenience Stores
Others
Countries Analyzed
North America (US, Canada, Mexico)
Europe (Germany, UK, France, Spain, Italy, Russia, Rest of Europe)
Asia Pacific (China, India, Japan, South Korea, Australia, South East Asia, Rest of Asia)
South America (Brazil, Argentina, Rest of South America)
Middle East and Africa (Saudi Arabia, UAE, Rest of Middle East, South Africa, Egypt, Rest of Africa)
Corn Syrup Solids Companies Profiled in the Study
Agrana
Grain Processing Corp
Great American Spice Co.
Henan Feitian Agricultural Development Stock.
Ingredion Mexico S.A. De C.V.
Shan Dong Tian Jiao Biotech Co.,Ltd
Shandong Tianjiu Bio-Tech.
The Sausage Maker
*- List Not Exhaustive
Chapter 1. TABLE OF CONTENTS
Chapter 2. Introduction to Corn Syrup Solids Market
2.1. Market Overview
2.2. Key Statistics and Report Highlights
2.3. Scope of the Comprehensive Study
2.3.1. Market Definition
2.3.2 Countries and Regions Covered
2.3.3 Research Objective
2.3.4 Units, Currency, and Conversions
2.3.5 Industry Value Chain
2.4. Key Market Segments
2.5. Key Companies
2.6. Study Period
Chapter 3. Strategic Analysis Review
3.1. Corn Syrup Solids Pricing Analysis and Forecast
3.2. Porter’s Five Forces
3.3. Market Ecosystem
3.4. SWOT Analysis
3.5. Regulatory Scenario
3.3. Effects of Inflation, Russia-Ukraine War, moderating economic growth, and other macroeconomic factors
Chapter 4. Competitive Landscape
4.1. Market Share Analysis
4.1.1. Global Corn Syrup Solids Market Share by Company, 2023
4.1.2. Product Offerings of Leading Corn Syrup Solids Companies
4.2. Market Entropy
4.2.1. New Product Launches in the Industry
4.2.2. Mergers, Acquisitions, Joint ventures, and Partnerships
4.3. Key Strategies and Best Practices
Chapter 5. Global Market Projections: Best, Reference, and Low Case Scenarios
5.1. Growth Analysis- Case Scenario Definitions
5.2. Low Growth Case Scenario Forecasts
5.3. Reference Growth Case Scenario Forecasts
5.4. High Growth Case Scenario Forecasts
Chapter 6. Market Dynamics
6.1. Corn Syrup Solids Market Drivers
6.2. Corn Syrup Solids Market Challenges
6.6. Corn Syrup Solids Market Opportunities
6.4. Corn Syrup Solids Market Trends
Chapter 7. Global Corn Syrup Solids Market Outlook Trends
7.1. Global Corn Syrup Solids Revenue (USD Million) and CAGR (%) by Type (2021-2032)
7.2. Global Corn Syrup Solids Revenue (USD Million) and CAGR (%) by Application (2021-2032)
7.3. Global Corn Syrup Solids Revenue (USD Million) and CAGR (%) by Product (2021-2032)
By Type
Corn Syrup Solids
low calorie corn syrup solid
Corn Syrup Solid Maltodextrin
By Application
Personal Use
Companies
Restaurant
Coffeehouse
Convenience Stores
Others
Chapter 8. Global Corn Syrup Solids Regional Analysis and Outlook
8.1. Global Corn Syrup Solids Revenue (USD Million) By Regions (2021- 2032)
8.2. North America Corn Syrup Solids Revenue (USD Million) by Country (2021-2032)
8.2.1. United States Corn Syrup Solids Regional Analysis and Outlook
8.2.2. Canada Corn Syrup Solids Regional Analysis and Outlook
8.2.3. Mexico Corn Syrup Solids Regional Analysis and Outlook
8.3. Europe Corn Syrup Solids Revenue (USD Million), by Country (2021-2032)
8.3.1. Germany Corn Syrup Solids Regional Analysis and Outlook
8.3.2. France Corn Syrup Solids Regional Analysis and Outlook
8.3.3. United Kingdom Corn Syrup Solids Regional Analysis and Outlook
8.3.4. Spain Corn Syrup Solids Regional Analysis and Outlook
8.3.5. Italy Corn Syrup Solids Regional Analysis and Outlook
8.3.6. Russia Corn Syrup Solids Regional Analysis and Outlook
8.3.7. Rest of Europe Corn Syrup Solids Regional Analysis and Outlook
8.4. Asia Pacific Corn Syrup Solids Revenue (USD Million) by Country (2021-2032)
8.4.1. China Corn Syrup Solids Regional Analysis and Outlook
8.4.2. Japan Corn Syrup Solids Regional Analysis and Outlook
8.4.3. India Corn Syrup Solids Regional Analysis and Outlook
8.4.4. South Korea Corn Syrup Solids Regional Analysis and Outlook
8.4.5. Australia Corn Syrup Solids Regional Analysis and Outlook
8.4.6. South East Asia Corn Syrup Solids Regional Analysis and Outlook
8.4.7. Rest of Asia Pacific Corn Syrup Solids Regional Analysis and Outlook
8.5. South America Corn Syrup Solids Revenue (USD Million), by Country (2021-2032)
8.5.1. Brazil Corn Syrup Solids Regional Analysis and Outlook
8.5.2. Argentina Corn Syrup Solids Regional Analysis and Outlook
8.5.3. Rest of South America Corn Syrup Solids Regional Analysis and Outlook
8.6. Middle East and Africa Corn Syrup Solids Revenue (USD Million) by Country (2021-2032)
8.6.1. Middle East Corn Syrup Solids Regional Analysis and Outlook
8.6.2. Africa Corn Syrup Solids Regional Analysis and Outlook
Chapter 9. North America Corn Syrup Solids Analysis and Outlook
9.1. North America Corn Syrup Solids Revenue (USD Million) by Segments (2021-2032)
9.1.1. North America Corn Syrup Solids Revenue (USD Million) by Type (2021-2032)
9.1.2. North America Corn Syrup Solids Revenue (USD Million) by Application (2021-2032)
9.1.3. North America Corn Syrup Solids Revenue (USD Million) by Product (2021-2032)
By Type
Corn Syrup Solids
low calorie corn syrup solid
Corn Syrup Solid Maltodextrin
By Application
Personal Use
Companies
Restaurant
Coffeehouse
Convenience Stores
Others
Chapter 10. Europe Corn Syrup Solids Analysis and Outlook
10.1. Europe Corn Syrup Solids Revenue (USD Million), by Segments (USD Million) (2021-2032)
10.1.1. Europe Corn Syrup Solids Revenue (USD Million) by Type (2021-2032)
10.1.2. Europe Corn Syrup Solids Revenue (USD Million) by Application (2021-2032)
10.1.3. Europe Corn Syrup Solids Revenue (USD Million) by Product (2021-2032)
By Type
Corn Syrup Solids
low calorie corn syrup solid
Corn Syrup Solid Maltodextrin
By Application
Personal Use
Companies
Restaurant
Coffeehouse
Convenience Stores
Others
Chapter 11. Asia Pacific Corn Syrup Solids Analysis and Outlook
11.1. Asia Pacific Corn Syrup Solids Revenue (USD Million), and Revenue (USD Million) by Segments (2021-2032)
11.1.1. Asia Pacific Corn Syrup Solids Revenue (USD Million) by Type (2021-2032)
11.1.2. Asia Pacific Corn Syrup Solids Revenue (USD Million) by Application (2021-2032)
11.1.3. Asia Pacific Corn Syrup Solids Revenue (USD Million) by Product (2021-2032)
By Type
Corn Syrup Solids
low calorie corn syrup solid
Corn Syrup Solid Maltodextrin
By Application
Personal Use
Companies
Restaurant
Coffeehouse
Convenience Stores
Others
Chapter 12. South America Corn Syrup Solids Analysis and Outlook
12.1. South America Corn Syrup Solids Revenue (USD Million), by Segments (2021-2032)
12.1.1. South America Corn Syrup Solids Revenue (USD Million) by Type (2021-2032)
12.1.2. South America Corn Syrup Solids Revenue (USD Million) by Application (2021-2032)
12.1.3. South America Corn Syrup Solids Revenue (USD Million) by Product (2021-2032)
By Type
Corn Syrup Solids
low calorie corn syrup solid
Corn Syrup Solid Maltodextrin
By Application
Personal Use
Companies
Restaurant
Coffeehouse
Convenience Stores
Others
Chapter 13. Middle East and Africa Corn Syrup Solids Analysis and Outlook
13.1. Middle East and Africa Corn Syrup Solids Revenue (USD Million), by Segments (2021-2032)
13.1.1. Middle East and Africa Corn Syrup Solids Revenue (USD Million) by Type (2021-2032)
13.1.2. Middle East and Africa Corn Syrup Solids Revenue (USD Million) by Application (2021-2032)
13.1.3. Middle East and Africa Corn Syrup Solids Revenue (USD Million) by Product (2021-2032)
By Type
Corn Syrup Solids
low calorie corn syrup solid
Corn Syrup Solid Maltodextrin
By Application
Personal Use
Companies
Restaurant
Coffeehouse
Convenience Stores
Others
Chapter 14. Corn Syrup Solids Company Profiles
14.1 Business Overview
14.2 Product Profiles
14.3 SWOT Profiles
14.5 Recent Developments
14.6 Financial Profile
List of Companies
Agrana
Grain Processing Corp
Great American Spice Co.
Henan Feitian Agricultural Development Stock.
Ingredion Mexico S.A. De C.V.
Shan Dong Tian Jiao Biotech Co.,Ltd
Shandong Tianjiu Bio-Tech.
The Sausage Maker
15. Methodology and Data Sources
15.1 Customization Offerings
15.2 Subscription Services
15.3 Related Reports
15.4 Publisher Expertise
LIST OF TABLES
Table 1 Market Segmentation Analysis
Table 2 Global Corn Syrup Solids Market Share of Leading Companies, 2023
Table 3 Product Offerings of Leading Companies
Table 4 Low Growth Scenario Forecasts
Table 5 Reference Case Growth Scenario
Table 6 High Growth Case Scenario
Table 7 Global Corn Syrup Solids Revenue (USD Million) And CAGR (%) By Type (2021-2032)
Table 8 Global Corn Syrup Solids Revenue (USD Million) And CAGR (%) By Application (2021-2032)
Table 9 Global Corn Syrup Solids Revenue (USD Million) And CAGR (%) By Product (2021-2032)
Table 10 Global Corn Syrup Solids Market Revenue (USD Million) By Regions (2021-2032)
Table 11 Global Corn Syrup Solids Market Share (%) By Regions (2021-2032)
Table 12 North America Corn Syrup Solids Revenue (USD Million) By Country (2021-2032)
Table 13 Europe Corn Syrup Solids Revenue (USD Million) By Country (2021-2032)
Table 14 Asia Pacific Corn Syrup Solids Revenue (USD Million) By Country (2021-2032)
Table 15 South America Corn Syrup Solids Revenue (USD Million) By Country (2021-2032)
Table 16 Middle East and Africa Corn Syrup Solids Revenue (USD Million) By Region (2021-2032)
Table 17 North America Corn Syrup Solids Revenue (USD Million) By Type (2021-2032)
Table 18 North America Corn Syrup Solids Revenue (USD Million) By Application (2021-2032)
Table 19 North America Corn Syrup Solids Revenue (USD Million) By Product (2021-2032)
Table 20 Europe Corn Syrup Solids Revenue (USD Million) By Type (2021-2032)
Table 21 Europe Corn Syrup Solids Revenue (USD Million) By Application (2021-2032)
Table 22 Europe Corn Syrup Solids Revenue (USD Million) By Product (2021-2032)
Table 23 Asia Pacific Corn Syrup Solids Revenue (USD Million) By Type (2021-2032)
Table 24 Asia Pacific Corn Syrup Solids Revenue (USD Million) By Application (2021-2032)
Table 25 Asia Pacific Corn Syrup Solids Revenue (USD Million) By Product (2021-2032)
Table 26 South America Corn Syrup Solids Revenue (USD Million) By Type (2021-2032)
Table 27 South America Corn Syrup Solids Revenue (USD Million) By Application (2021-2032)
Table 28 South America Corn Syrup Solids Revenue (USD Million) By Product (2021-2032)
Table 29 Middle East and Africa Corn Syrup Solids Revenue (USD Million) By Type (2021-2032)
Table 30 Middle East and Africa Corn Syrup Solids Revenue (USD Million) By Application (2021-2032)
Table 31 Middle East and Africa Corn Syrup Solids Revenue (USD Million) By Product (2021-2032)
LIST OF FIGURES
Figure 1. Market Scope
Figure 2. Pricing Forecasts Per Unit, 2023- 2032
Figure 3. Porter’s Five Forces
Figure 4. Global Corn Syrup Solids Market Revenue (USD Million) By Regions (2021-2032)
Figure 5. Global Corn Syrup Solids Market Share (%) By Regions (2023)
Figure 6. North America Corn Syrup Solids Revenue (USD Million) By Country (2021-2032)
Figure 7. United States Corn Syrup Solids Revenue (USD Million) By Country (2021-2032)
Figure 8. Canada Corn Syrup Solids Revenue (USD Million) By Country (2021-2032)
Figure 9. Mexico Corn Syrup Solids Revenue (USD Million) By Country (2021-2032)
Figure 10. Europe Corn Syrup Solids Revenue (USD Million) By Country (2021-2032)
Figure 11. Germany Corn Syrup Solids Revenue (USD Million) By Country (2021-2032)
Figure 12. France Corn Syrup Solids Revenue (USD Million) By Country (2021-2032)
Figure 13. United Kingdom Corn Syrup Solids Revenue (USD Million) By Country (2021-2032)
Figure 14. Spain Corn Syrup Solids Revenue (USD Million) By Country (2021-2032)
Figure 15. Italy Corn Syrup Solids Revenue (USD Million) By Country (2021-2032)
Figure 16. Russia Corn Syrup Solids Revenue (USD Million) By Country (2021-2032)
Figure 17. Rest of Europe Corn Syrup Solids Revenue (USD Million) By Country (2021-2032)
Figure 11. Asia Pacific Corn Syrup Solids Revenue (USD Million) By Country (2021-2032)
Figure 12. China Corn Syrup Solids Revenue (USD Million) By Country (2021-2032)
Figure 13. Japan Corn Syrup Solids Revenue (USD Million) By Country (2021-2032)
Figure 14. India Corn Syrup Solids Revenue (USD Million) By Country (2021-2032)
Figure 15. South Korea Corn Syrup Solids Revenue (USD Million) By Country (2021-2032)
Figure 16. Australia Corn Syrup Solids Revenue (USD Million) By Country (2021-2032)
Figure 17. South East Asia Corn Syrup Solids Revenue (USD Million) By Country (2021-2032)
Figure 18. South America Corn Syrup Solids Revenue (USD Million) By Country (2021-2032)
Figure 19. Brazil Corn Syrup Solids Revenue (USD Million) By Country (2021-2032)
Figure 20. Argentina Corn Syrup Solids Revenue (USD Million) By Country (2021-2032)
Figure 21. Rest of Asia Pacific Corn Syrup Solids Revenue (USD Million) By Country (2021-2032)
Figure 22. Middle East and Africa Corn Syrup Solids Revenue (USD Million) By Region (2021-2032)
Figure 23. Saudi Arabia Corn Syrup Solids Revenue (USD Million) By Region (2021-2032)
Figure 24. The UAE Corn Syrup Solids Revenue (USD Million) By Region (2021-2032)
Figure 25. Rest of Middle East Corn Syrup Solids Revenue (USD Million) By Region (2021-2032)
Figure 26. South Africa Corn Syrup Solids Revenue (USD Million) By Region (2021-2032)
Figure 27. Africa Corn Syrup Solids Revenue (USD Million) By Region (2021-2032)
Figure 28. North America Corn Syrup Solids Revenue (USD Million) By Type (2021-2032)
Figure 29. North America Corn Syrup Solids Revenue (USD Million) By Application (2021-2032)
Figure 30. North America Corn Syrup Solids Revenue (USD Million) By Product (2021-2032)
Figure 31. Europe Corn Syrup Solids Revenue (USD Million) By Type (2021-2032)
Figure 32. Europe Corn Syrup Solids Revenue (USD Million) By Application (2021-2032)
Figure 33. Europe Corn Syrup Solids Revenue (USD Million) By Product (2021-2032)
Figure 34. Asia Pacific Corn Syrup Solids Revenue (USD Million) By Type (2021-2032)
Figure 35. Asia Pacific Corn Syrup Solids Revenue (USD Million) By Application (2021-2032)
Figure 36. Asia Pacific Corn Syrup Solids Revenue (USD Million) By Product (2021-2032)
Figure 37. South America Corn Syrup Solids Revenue (USD Million) By Type (2021-2032)
Figure 38. South America Corn Syrup Solids Revenue (USD Million) By Application (2021-2032)
Figure 39. South America Corn Syrup Solids Revenue (USD Million) By Product (2021-2032)
Figure 40. Middle East and Africa Corn Syrup Solids Revenue (USD Million) By Type (2021-2032)
Figure 41. Middle East and Africa Corn Syrup Solids Revenue (USD Million) By Application (2021-2032)
Figure 42. Middle East and Africa Corn Syrup Solids Revenue (USD Million) By Product (2021-2032)
By Type
Corn Syrup Solids
low calorie corn syrup solid
Corn Syrup Solid Maltodextrin
By Application
Personal Use
Companies
Restaurant
Coffeehouse
Convenience Stores
Others
Countries Analyzed
North America (US, Canada, Mexico)
Europe (Germany, UK, France, Spain, Italy, Russia, Rest of Europe)
Asia Pacific (China, India, Japan, South Korea, Australia, South East Asia, Rest of Asia)
South America (Brazil, Argentina, Rest of South America)
Middle East and Africa (Saudi Arabia, UAE, Rest of Middle East, South Africa, Egypt, Rest of Africa)
