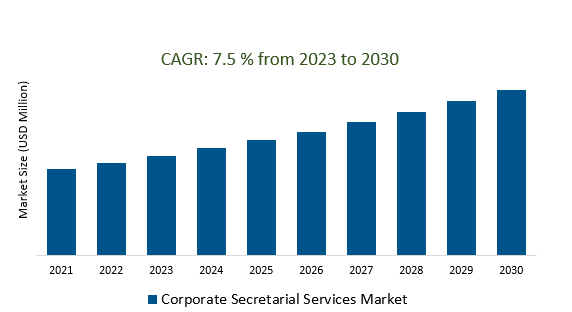
The Corporate Secretarial Services Market Size is estimated to register 7.5% growth over the forecast period from 2023 to 2030.
Corporate Secretarial Services Market Overview
The incorporation of technology-driven solutions and automation tools in corporate secretarial services is a significant driver. Companies expanding their operations globally are seeking corporate secretarial services that specialize in managing multi-jurisdictional compliance, understanding diverse legal frameworks, and facilitating seamless cross-border operations. As companies grow and become complex, there's an increased demand for specialized corporate secretarial services. With the increasing focus on data security and privacy regulations, corporate secretarial services are expected to ensure the confidentiality and security of sensitive corporate information while complying with data protection laws. Incorporating robust measures to ensure confidentiality, data security, and compliance with data protection regulations while handling sensitive corporate information are driving the market growth.
Corporate Secretarial Services Market Dynamics
Market Trends- Escalating Regulatory Compliance Requirements in Corporate Secretarial Services Market.
Stringent data protection laws, such as the GDPR, enforce strict requirements for data security and privacy, prompting businesses to seek adept corporate secretarial services to ensure compliance.
Industry-specific expertise to navigate and manage compliance within sectors like finance, healthcare, technology, and others, each with its unique regulatory landscape are fueling the demand.
Companies are increasingly integrating compliance functions into broader risk management strategies leading to a rise in the market.
Market Driver- Complexities of mergers and acquisitions (M&A) and other corporate transactions demand market growth.
Navigation of complex regulatory landscapes by ensuring compliance with legal and governance frameworks, facilitating smoother transaction processes are the key factors. Handling legal documentation like drafting, reviewing, and managing documentation, ensuring accuracy and compliance with regulatory standards are driving the market growth. Additionally, addressing cross-border complexities, overseeing due diligence processes, and supporting post-merger integration efforts by corporate secretarial services are driving the market growth.
Market Opportunity- Rising Demand for ESG Reporting and Disclosure drives corporate Secretarial Services Market.
Environmental, social, and governance (ESG) factors are becoming increasingly important to investors, customers, and other stakeholders. Companies are increasingly integrating ESG considerations into their core business strategies. Further, Effective ESG reporting helps mitigate risks associated with environmental, social, and governance issues. The development of standardized ESG frameworks, such as the Global Reporting Initiative (GRI) and Sustainability Accounting Standards Board (SASB) are influencing businesses to adopt consistent reporting practices, driving the demand for specialized expertise.
Market Share Analysis- Compliance Services will register the fastest growth.
The Corporate Secretarial Services Market is analyzed across Company and Subsidiaries Formation, Compliance Services, Statutory Record Maintenance, Corporate Housekeeping, Share Capital Assistance, Advice and Assistance & Others. Compliance Services is poised to register the fastest growth. These services cater to the evolving landscape of compliance requirements across industries and geographies. They typically involve comprehensive support in navigating and fulfilling statutory obligations, ensuring businesses meet regulatory standards and avoid legal pitfalls. They often include regulatory filings, ensuring adherence to corporate governance codes, managing documentation for meetings and resolutions, and ensuring timely compliance with various legal requirements. Additionally, compliance services extend support in conducting due diligence, risk assessment, and implementing robust compliance programs tailored to the organization's specific needs.
Market Share Analysis- Listed Companies held a significant market share in 2023.
The Corporate Secretarial Services Market is analyzed across Academy Schools, Charity Companies, Listed Companies & Non-listed PLCs. Listed Companies held a significant market share in 2023. Listed Companies represent entities whose shares are traded on public stock exchanges, subjecting them to rigorous regulatory compliance and transparency obligations. Corporate secretarial services for listed entities involve managing and overseeing regulatory filings, such as annual reports, financial statements, and disclosures mandated by regulatory bodies and stock exchanges. They play a pivotal role in ensuring timely and accurate submissions to maintain regulatory compliance and meet disclosure requirements. Further, they involve facilitating communication between the board of directors and shareholders, organizing, and managing shareholder meetings, and ensuring compliance with voting procedures. T
Corporate Secretarial Services Market Segmentation
By Type
- Company and Subsidiaries Formation
- Compliance Services
- Statutory Record Maintenance
- Corporate Housekeeping
- Share Capital Assistance
- Advice and Assistance
- Others
By Application
- Academy Schools
- Charity Companies
- Listed Companies
- Non-listed PLCs
By Region
- North America (United States, Canada, Mexico)
- Europe (Germany, France, United Kingdom, Spain, Italy, Others)
- Asia Pacific (China, India, Japan, South Korea, Australia, Others)
- Latin America (Brazil, Argentina, Others)
- Middle East and Africa (Saudi Arabia, UAE, Kuwait, Other Middle East, South Africa, Nigeria, Other Africa)
Corporate Secretarial Services Market Companies
- Vistra (Switzerland)
- Deloitte (United Kingdom)
- TMF Group (Netherlands)
- KPMG (Netherlands)
- PwC (United Kingdom)
- Mazars Group (France)
- ECOVIS (Germany)
- MSP Secretaries (United Kingdom)
- Elemental CoSec (United Kingdom)
- Luther Corporate Services (Germany)
- A.1 Business Pte Ltd. (Singapore)
- Rodl & Partner (Germany)
- Conpak CPA Limited (Hong Kong)
- Grant Thornton (United States)
- BDO International (Belgium)
- J&T Bank and Trust (West Indies)
- Eversheds Sutherland (United Kingdom)
- Equiniti (United Kingdom)
- Dillon Eustace (Ireland)
- RSM International (United Kingdom)
- COGENCY GLOBAL (United States)
- UHY Hacker Young (United Kingdom)
- DP Information Network (Singapore)
- French Duncan (Scotland)
- PKF (United Kingdom)
*List not exhaustive
Corporate Secretarial Services Market Outlook 2023
1 Market Overview
1.1 Introduction to the Corporate Secretarial Services Market
1.2 Scope of the Study
1.3 Research Objective
1.3.1 Key Market Scope and Segments
1.3.2 Players Covered
1.3.3 Years Considered
2 Executive Summary
2.1 2023 Corporate Secretarial Services Industry- Market Statistics
3 Market Dynamics
3.1 Market Drivers
3.2 Market Challenges
3.3 Market Opportunities
3.4 Market Trends
4 Market Factor Analysis
4.1 Porter’s Five Forces
4.2 Market Entropy
4.2.1 Global Corporate Secretarial Services Market Companies with Area Served
4.2.2 Products Offerings Global Corporate Secretarial Services Market
5 COVID-19 Impact Analysis and Outlook Scenarios
5.1.1 Covid-19 Impact Analysis
5.1.2 post-COVID-19 Scenario- Low Growth Case
5.1.3 post-COVID-19 Scenario- Reference Growth Case
5.1.4 post-COVID-19 Scenario- Low Growth Case
6 Global Corporate Secretarial Services Market Trends
6.1 Global Corporate Secretarial Services Revenue (USD Million) and CAGR (%) by Type (2018-2030)
6.2 Global Corporate Secretarial Services Revenue (USD Million) and CAGR (%) by Applications (2018-2030)
6.3 Global Corporate Secretarial Services Revenue (USD Million) and CAGR (%) by regions (2018-2030)
7 Global Corporate Secretarial Services Market Revenue (USD Million) by Type, and Applications (2018-2022)
7.1 Global Corporate Secretarial Services Revenue (USD Million) by Type (2018-2022)
7.1.1 Global Corporate Secretarial Services Revenue (USD Million), Market Share (%) by Type (2018-2022)
7.2 Global Corporate Secretarial Services Revenue (USD Million) by Applications (2018-2022)
7.2.1 Global Corporate Secretarial Services Revenue (USD Million), Market Share (%) by Applications (2018-2022)
8 Global Corporate Secretarial Services Development Regional Status and Outlook
8.1 Global Corporate Secretarial Services Revenue (USD Million) By Regions (2018-2022)
8.2 North America Corporate Secretarial Services Revenue (USD Million) by Type, and Application (2018-2022)
8.2.1 North America Corporate Secretarial Services Revenue (USD Million) by Country (2018-2022)
8.2.2 North America Corporate Secretarial Services Revenue (USD Million) by Type (2018-2022)
8.2.3 North America Corporate Secretarial Services Revenue (USD Million) by Applications (2018-2022)
8.3 Europe Corporate Secretarial Services Revenue (USD Million), by Type, and Applications (USD Million) (2018-2022)
8.3.1 Europe Corporate Secretarial Services Revenue (USD Million), by Country (2018-2022)
8.3.2 Europe Corporate Secretarial Services Revenue (USD Million) by Type (2018-2022)
8.3.3 Europe Corporate Secretarial Services Revenue (USD Million) by Applications (2018-2022)
8.4 Asia Pacific Corporate Secretarial Services Revenue (USD Million), and Revenue (USD Million) by Type, and Applications (2018-2022)
8.4.1 Asia Pacific Corporate Secretarial Services Revenue (USD Million) by Country (2018-2022)
8.4.2 Asia Pacific Corporate Secretarial Services Revenue (USD Million) by Type (2018-2022)
8.4.3 Asia Pacific Corporate Secretarial Services Revenue (USD Million) by Applications (2018-2022)
8.5 South America Corporate Secretarial Services Revenue (USD Million), by Type, and Applications (2018-2022)
8.5.1 South America Corporate Secretarial Services Revenue (USD Million), by Country (2018-2022)
8.5.2 South America Corporate Secretarial Services Revenue (USD Million) by Type (2018-2022)
8.5.3 South America Corporate Secretarial Services Revenue (USD Million) by Applications (2018-2022)
8.6 Middle East and Africa Corporate Secretarial Services Revenue (USD Million), by Type, Technology, Application, Thickness (2018-2022)
8.6.1 Middle East and Africa Corporate Secretarial Services Revenue (USD Million) by Country (2018-2022)
8.6.2 Middle East and Africa Corporate Secretarial Services Revenue (USD Million) by Type (2018-2022)
8.6.3 Middle East and Africa Corporate Secretarial Services Revenue (USD Million) by Applications (2018-2022)
9 Company Profiles
10 Global Corporate Secretarial Services Market Revenue (USD Million), by Type, and Applications (2023-2030)
10.1 Global Corporate Secretarial Services Revenue (USD Million) and Market Share (%) by Type (2023-2030)
10.1.1 Global Corporate Secretarial Services Revenue (USD Million), and Market Share (%) by Type (2023-2030)
10.2 Global Corporate Secretarial Services Revenue (USD Million) and Market Share (%) by Applications (2023-2030)
10.2.1 Global Corporate Secretarial Services Revenue (USD Million), and Market Share (%) by Applications (2023-2030)
11 Global Corporate Secretarial Services Development Regional Status and Outlook Forecast
11.1 Global Corporate Secretarial Services Revenue (USD Million) By Regions (2023-2030)
11.2 North America Corporate Secretarial Services Revenue (USD Million) by Type, and Applications (2023-2030)
11.2.1 North America Corporate Secretarial Services Revenue (USD) Million by Country (2023-2030)
11.2.2 North America Corporate Secretarial Services Revenue (USD Million), by Type (2023-2030)
11.2.3 North America Corporate Secretarial Services Revenue (USD Million), Market Share (%) by Applications (2023-2030)
11.3 Europe Corporate Secretarial Services Revenue (USD Million), by Type, and Applications (2023-2030)
11.3.1 Europe Corporate Secretarial Services Revenue (USD Million), by Country (2023-2030)
11.3.2 Europe Corporate Secretarial Services Revenue (USD Million), by Type (2023-2030)
11.3.3 Europe Corporate Secretarial Services Revenue (USD Million), by Applications (2023-2030)
11.4 Asia Pacific Corporate Secretarial Services Revenue (USD Million) by Type, and Applications (2023-2030)
11.4.1 Asia Pacific Corporate Secretarial Services Revenue (USD Million), by Country (2023-2030)
11.4.2 Asia Pacific Corporate Secretarial Services Revenue (USD Million), by Type (2023-2030)
11.4.3 Asia Pacific Corporate Secretarial Services Revenue (USD Million), by Applications (2023-2030)
11.5 South America Corporate Secretarial Services Revenue (USD Million), by Type, and Applications (2023-2030)
11.5.1 South America Corporate Secretarial Services Revenue (USD Million), by Country (2023-2030)
11.5.2 South America Corporate Secretarial Services Revenue (USD Million), by Type (2023-2030)
11.5.3 South America Corporate Secretarial Services Revenue (USD Million), by Applications (2023-2030)
11.6 Middle East and Africa Corporate Secretarial Services Revenue (USD Million), by Type, and Applications (2023-2030)
11.6.1 Middle East and Africa Corporate Secretarial Services Revenue (USD Million), by region (2023-2030)
11.6.2 Middle East and Africa Corporate Secretarial Services Revenue (USD Million), by Type (2023-2030)
11.6.3 Middle East and Africa Corporate Secretarial Services Revenue (USD Million), by Applications (2023-2030)
12 Methodology and Data Sources
12.1 Methodology/Research Approach
12.1.1 Research Programs/Design
12.1.2 Market Size Estimation
12.1.3 Market Breakdown and Data Triangulation
12.2 Data Sources
12.2.1 Secondary Sources
12.2.2 Primary Sources
12.3 Disclaimer
List of Tables
Table 1 Market Segmentation Analysis
Table 2 Global Corporate Secretarial Services Market Companies with Areas Served
Table 3 Products Offerings Global Corporate Secretarial Services Market
Table 4 Low Growth Scenario Forecasts
Table 5 Reference Case Growth Scenario
Table 6 High Growth Case Scenario
Table 7 Global Corporate Secretarial Services Revenue (USD Million) And CAGR (%) By Type (2018-2030)
Table 8 Global Corporate Secretarial Services Revenue (USD Million) And CAGR (%) By Applications (2018-2030)
Table 9 Global Corporate Secretarial Services Revenue (USD Million) And CAGR (%) By Regions (2018-2030)
Table 10 Global Corporate Secretarial Services Revenue (USD Million) By Type (2018-2022)
Table 11 Global Corporate Secretarial Services Revenue Market Share (%) By Type (2018-2022)
Table 12 Global Corporate Secretarial Services Revenue (USD Million) By Applications (2018-2022)
Table 13 Global Corporate Secretarial Services Revenue Market Share (%) By Applications (2018-2022)
Table 14 Global Corporate Secretarial Services Market Revenue (USD Million) By Regions (2018-2022)
Table 15 Global Corporate Secretarial Services Market Share (%) By Regions (2018-2022)
Table 16 North America Corporate Secretarial Services Revenue (USD Million) By Country (2018-2022)
Table 17 North America Corporate Secretarial Services Revenue (USD Million) By Type (2018-2022)
Table 18 North America Corporate Secretarial Services Revenue (USD Million) By Applications (2018-2022)
Table 19 Europe Corporate Secretarial Services Revenue (USD Million) By Country (2018-2022)
Table 20 Europe Corporate Secretarial Services Revenue (USD Million) By Type (2018-2022)
Table 21 Europe Corporate Secretarial Services Revenue (USD Million) By Applications (2018-2022)
Table 22 Asia Pacific Corporate Secretarial Services Revenue (USD Million) By Country (2018-2022)
Table 23 Asia Pacific Corporate Secretarial Services Revenue (USD Million) By Type (2018-2022)
Table 24 Asia Pacific Corporate Secretarial Services Revenue (USD Million) By Applications (2018-2022)
Table 25 South America Corporate Secretarial Services Revenue (USD Million) By Country (2018-2022)
Table 26 South America Corporate Secretarial Services Revenue (USD Million) By Type (2018-2022)
Table 27 South America Corporate Secretarial Services Revenue (USD Million) By Applications (2018-2022)
Table 28 Middle East and Africa Corporate Secretarial Services Revenue (USD Million) By Region (2018-2022)
Table 29 Middle East and Africa Corporate Secretarial Services Revenue (USD Million) By Type (2018-2022)
Table 30 Middle East and Africa Corporate Secretarial Services Revenue (USD Million) By Applications (2018-2022)
Table 31 Financial Analysis
Table 32 Global Corporate Secretarial Services Revenue (USD Million) By Type (2023-2030)
Table 33 Global Corporate Secretarial Services Revenue Market Share (%) By Type (2023-2030)
Table 34 Global Corporate Secretarial Services Revenue (USD Million) By Applications (2023-2030)
Table 35 Global Corporate Secretarial Services Revenue Market Share (%) By Applications (2023-2030)
Table 36 Global Corporate Secretarial Services Market Revenue (USD Million), And Revenue (USD Million) By Regions (2023-2030)
Table 37 North America Corporate Secretarial Services Revenue (USD)By Country (2023-2030)
Table 38 North America Corporate Secretarial Services Revenue (USD Million) By Type (2023-2030)
Table 39 North America Corporate Secretarial Services Revenue (USD Million) By Applications (2023-2030)
Table 40 Europe Corporate Secretarial Services Revenue (USD Million) By Country (2023-2030)
Table 41 Europe Corporate Secretarial Services Revenue (USD Million) By Type (2023-2030)
Table 42 Europe Corporate Secretarial Services Revenue (USD Million) By Applications (2023-2030)
Table 43 Asia Pacific Corporate Secretarial Services Revenue (USD Million) By Country (2023-2030)
Table 44 Asia Pacific Corporate Secretarial Services Revenue (USD Million) By Type (2023-2030)
Table 45 Asia Pacific Corporate Secretarial Services Revenue (USD Million) By Applications (2023-2030)
Table 46 South America Corporate Secretarial Services Revenue (USD Million) By Country (2023-2030)
Table 47 South America Corporate Secretarial Services Revenue (USD Million) By Type (2023-2030)
Table 48 South America Corporate Secretarial Services Revenue (USD Million) By Applications (2023-2030)
Table 49 Middle East and Africa Corporate Secretarial Services Revenue (USD Million) By Region (2023-2030)
Table 50 Middle East and Africa Corporate Secretarial Services Revenue (USD Million) By Region (2023-2030)
Table 51 Middle East and Africa Corporate Secretarial Services Revenue (USD Million) By Type (2023-2030)
Table 52 Middle East and Africa Corporate Secretarial Services Revenue (USD Million) By Applications (2023-2030)
Table 53 Research Programs/Design for This Report
Table 54 Key Data Information from Secondary Sources
Table 55 Key Data Information from Primary Sources
List of Figures
Figure 1 Market Scope
Figure 2 Porter’s Five Forces
Figure 3 Global Corporate Secretarial Services Revenue (USD Million) By Type (2018-2022)
Figure 4 Global Corporate Secretarial Services Revenue Market Share (%) By Type (2022)
Figure 5 Global Corporate Secretarial Services Revenue (USD Million) By Applications (2018-2022)
Figure 6 Global Corporate Secretarial Services Revenue Market Share (%) By Applications (2022)
Figure 7 Global Corporate Secretarial Services Market Revenue (USD Million) By Regions (2018-2022)
Figure 8 Global Corporate Secretarial Services Market Share (%) By Regions (2022)
Figure 9 North America Corporate Secretarial Services Revenue (USD Million) By Country (2018-2022)
Figure 10 North America Corporate Secretarial Services Revenue (USD Million) By Type (2018-2022)
Figure 11 North America Corporate Secretarial Services Revenue (USD Million) By Applications (2018-2022)
Figure 12 Europe Corporate Secretarial Services Revenue (USD Million) By Country (2018-2022)
Figure 13 Europe Corporate Secretarial Services Revenue (USD Million) By Type (2018-2022)
Figure 14 Europe Corporate Secretarial Services Revenue (USD Million) By Applications (2018-2022)
Figure 15 Asia Pacific Corporate Secretarial Services Revenue (USD Million) By Country (2018-2022)
Figure 16 Asia Pacific Corporate Secretarial Services Revenue (USD Million) By Type (2018-2022)
Figure 17 Asia Pacific Corporate Secretarial Services Revenue (USD Million) By Applications (2018-2022)
Figure 18 South America Corporate Secretarial Services Revenue (USD Million) By Country (2018-2022)
Figure 19 South America Corporate Secretarial Services Revenue (USD Million) By Type (2018-2022)
Figure 20 South America Corporate Secretarial Services Revenue (USD Million) By Applications (2018-2022)
Figure 21 Middle East and Africa Corporate Secretarial Services Revenue (USD Million) By Region (2018-2022)
Figure 22 Middle East and Africa Corporate Secretarial Services Revenue (USD Million) By Type (2018-2022)
Figure 23 Middle East and Africa Corporate Secretarial Services Revenue (USD Million) By Applications (2018-2022)
Figure 24 Global Corporate Secretarial Services Revenue (USD Million) By Type (2023-2030)
Figure 25 Global Corporate Secretarial Services Revenue Market Share (%) By Type (2030)
Figure 26 Global Corporate Secretarial Services Revenue (USD Million) By Applications (2023-2030)
Figure 27 Global Corporate Secretarial Services Revenue Market Share (%) By Applications (2030)
Figure 28 Global Corporate Secretarial Services Market Revenue (USD Million) By Regions (2023-2030)
Figure 29 North America Corporate Secretarial Services Revenue (USD Million) By Country (2023-2030)
Figure 30 North America Corporate Secretarial Services Revenue (USD Million) By Type (2023-2030)
Figure 31 North America Corporate Secretarial Services Revenue (USD Million) By Applications (2023-2030)
Figure 32 Europe Corporate Secretarial Services Revenue (USD Million) By Country (2023-2030)
Figure 33 Europe Corporate Secretarial Services Revenue (USD Million) By Type (2023-2030)
Figure 34 Europe Corporate Secretarial Services Revenue (USD Million) By Applications (2023-2030)
Figure 35 Asia Pacific Corporate Secretarial Services Revenue (USD Million) By Country (2023-2030)
Figure 36 Asia Pacific Corporate Secretarial Services Revenue (USD Million) By Type (2023-2030)
Figure 37 Asia Pacific Corporate Secretarial Services Revenue (USD Million) By Applications (2023-2030)
Figure 38 South America Corporate Secretarial Services Revenue (USD Million) By Country (2023-2030)
Figure 39 South America Corporate Secretarial Services Revenue (USD Million) By Type (2023-2030)
Figure 40 South America Corporate Secretarial Services Revenue (USD Million) By Applications (2023-2030)
Figure 41 Middle East and Africa Corporate Secretarial Services Revenue (USD Million) By Region (2023-2030)
Figure 42 Middle East and Africa Corporate Secretarial Services Revenue (USD Million) By Region (2023-2030)
Figure 43 Middle East and Africa Corporate Secretarial Services Revenue (USD Million) By Type (2023-2030)
Figure 44 Middle East and Africa Corporate Secretarial Services Revenue (USD Million) By Applications (2023-2030)
Figure 45 Bottom-Up and Top-Down Approaches for This Report
Figure 46 Data Triangulation
