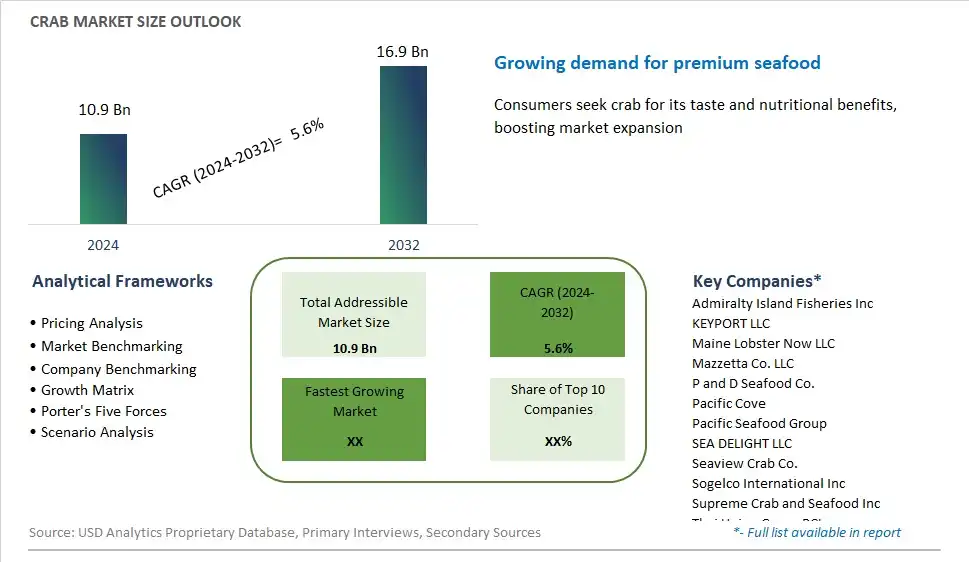
Global Crab Market Size is valued at $10.9 Billion in 2024 and is forecast to register a growth rate (CAGR) of 5.6% to reach $16.9 Billion by 2032.
The global Crab Market Comprehensive Study analyzes and forecasts the market size across 6 regions and 24 countries for diverse segments -By Type (Blue Crab, Chinese Mitten, Gazami Crab, Others), By Form (Frozen, Canned, Others), By End-User (Foodservice, Retail), By Environment (Aquaculture, Capture fisheries)
An Introduction to Crab Market
In 2024, the market for crab continues to be a significant segment of the seafood industry, driven by its popularity as a versatile and delicious culinary ingredient worldwide. Crab meat, prized for its delicate flavor, tender texture, and nutritional value, is consumed in various forms such as whole crab, crab legs, crab cakes, crab salads, and crab soups. The market is fueled by factors such as increasing demand for seafood, changing dietary preferences, and the growing popularity of global cuisine. Moreover, advancements in seafood processing, packaging, and distribution ensure that crab products meet quality standards, safety regulations, and consumer expectations for freshness and flavor. As consumers seek out healthy and sustainable protein sources, the crab market presents opportunities for fisheries, aquaculture producers, and seafood retailers to innovate, diversify, and capture market share in a competitive and evolving industry landscape. Additionally, the rising demand for premium and value-added crab products, as well as the exploration of new markets and distribution channels, further contribute to the growth and expansion of the crab market in 2024.
Crab Competitive Landscape
The market report analyses the leading companies in the industry including Admiralty Island Fisheries Inc, KEYPORT LLC, Maine Lobster Now LLC, Mazzetta Co. LLC, P and D Seafood Co., Pacific Cove, Pacific Seafood Group, SEA DELIGHT LLC, Seaview Crab Co., Sogelco International Inc, Supreme Crab and Seafood Inc, Thai Union Group PCL, and Others.
Crab Market Dynamics
Crab Market Trend: Growing Demand for Sustainable Seafood
A prominent market trend in the Crab industry is the growing demand for sustainable seafood. As consumers become more environmentally conscious, there is increasing awareness about the importance of sustainable fishing practices and the preservation of marine ecosystems. This trend is driving demand for crab products sourced from well-managed fisheries or certified sustainable sources. Consumers are seeking assurances that their seafood choices align with principles of sustainability, leading to the popularity of eco-labels and certifications indicating responsibly sourced crab products.
Market Driver: Health Benefits and Nutritional Value
A significant market driver for Crab is its perceived health benefits and nutritional value. Crab is a rich source of protein, vitamins, and minerals, including omega-3 fatty acids, vitamin B12, and selenium. As consumers prioritize health and wellness, there is growing interest in incorporating nutrient-dense foods like crab into their diets. The nutritional profile of crab, coupled with its low-calorie content and potential health benefits such as supporting heart health and boosting immunity, drives its consumption. Health-conscious consumers seeking alternatives to red meat or processed foods perceive crab as a nutritious and flavorful option.
Market Opportunity: Diversification of Product Offerings and Value-Added Products
An opportunity in the Crab market lies in the diversification of product offerings and the development of value-added products. While traditional crab products such as whole crab, crab legs, and crab meat remain popular, there is room for innovation and expansion into new product categories. Brands can explore opportunities to create value-added products such as pre-packaged crab cakes, crab dips, crab-stuffed pasta, and ready-to-eat crab snacks. Additionally, there is potential for the development of convenience-oriented products like frozen or pre-cooked crab options to cater to busy lifestyles and convenience-seeking consumers. By tapping into these opportunities, companies can expand their market reach and appeal to a broader consumer base seeking convenient yet nutritious seafood options.
Crab Market Share Analysis: Blue Crab held the dominant market share in 2024
In the Crab Market segmented by type, the largest segment is Blue Crab, owing to its widespread availability, culinary versatility, and popularity among consumers worldwide. Blue crabs are highly sought after for their sweet, tender meat and are widely used in various cuisines, ranging from seafood boils to crab cakes and sushi. Their abundance along coastal regions and estuaries, coupled with efficient fishing practices, ensures a steady supply to meet consumer demand. Further, blue crabs are favored by seafood enthusiasts for their succulent texture and rich flavor profile, making them a staple in seafood markets and restaurants. While Chinese Mitten, Gazami, and other crab varieties also contribute to the market, the Blue Crab segment maintains its dominance, reflecting its significance in the global seafood industry and consumers' enduring preference for its delectable taste and culinary versatility.
Crab Market Share Analysis: Frozen market is poised to register the fastest growth rae over the forecast period to 2032
In the Crab Market segmented by form, the fastest-growing segment is Frozen, driven by several factors including convenience, extended shelf life, and technological advancements in food preservation. Frozen crab offers consumers the flexibility to store and use crab meat at their convenience, eliminating concerns about freshness and availability. Additionally, frozen crab retains its quality and flavor, often surpassing the quality of canned crab. The freezing process preserves the natural texture and taste of crab meat, appealing to consumers seeking high-quality seafood products. Further, frozen crab is increasingly favored by foodservice establishments and seafood processors due to its ease of handling and extended storage capabilities. The growing demand for frozen crab reflects changing consumer lifestyles, preferences for convenience, and the desire for access to premium seafood products year-round. While canned crab and other forms also contribute to the market, the Frozen segment demonstrates rapid growth, driven by its convenience and superior product quality.
Crab Market Share Analysis: Retail held the dominant market share in 2024
In the Crab Market segmented by end-user, the largest segment is Retail, owing to the widespread consumption of crab products by individual consumers through supermarkets, specialty seafood markets, and online retailers. Retail channels cater to the demand from households seeking fresh or frozen crab for home cooking and dining. Crab is a highly sought-after seafood delicacy, prized for its succulent meat and versatility in various culinary preparations. Retail outlets offer a wide range of crab products, including whole crabs, crab legs, crab meat, and crab cakes, to meet the diverse preferences of consumers. Additionally, retail channels provide consumers with the option to select crab products based on freshness, size, and price, enhancing their shopping experience. While foodservice establishments such as restaurants, hotels, and caterers also contribute significantly to the crab market, the Retail segment maintains its dominance, reflecting consumers' preference for purchasing crab products for home consumption and culinary exploration.
Crab Market Segmentation
By Type
Blue Crab
Chinese Mitten
Gazami Crab
Others
By Form
Frozen
Canned
Others
By End-User
Foodservice
Retail
By Environment
Aquaculture
Capture fisheries
Countries Analyzed
North America (US, Canada, Mexico)
Europe (Germany, UK, France, Spain, Italy, Russia, Rest of Europe)
Asia Pacific (China, India, Japan, South Korea, Australia, South East Asia, Rest of Asia)
South America (Brazil, Argentina, Rest of South America)
Middle East and Africa (Saudi Arabia, UAE, Rest of Middle East, South Africa, Egypt, Rest of Africa)
Crab Companies Profiled in the Study
Admiralty Island Fisheries Inc
KEYPORT LLC
Maine Lobster Now LLC
Mazzetta Co. LLC
P and D Seafood Co.
Pacific Cove
Pacific Seafood Group
SEA DELIGHT LLC
Seaview Crab Co.
Sogelco International Inc
Supreme Crab and Seafood Inc
Thai Union Group PCL
*- List Not Exhaustive
Chapter 1. TABLE OF CONTENTS
Chapter 2. Introduction to Crab Market
2.1. Market Overview
2.2. Key Statistics and Report Highlights
2.3. Scope of the Comprehensive Study
2.3.1. Market Definition
2.3.2 Countries and Regions Covered
2.3.3 Research Objective
2.3.4 Units, Currency, and Conversions
2.3.5 Industry Value Chain
2.4. Key Market Segments
2.5. Key Companies
2.6. Study Period
Chapter 3. Strategic Analysis Review
3.1. Crab Pricing Analysis and Forecast
3.2. Porter’s Five Forces
3.3. Market Ecosystem
3.4. SWOT Analysis
3.5. Regulatory Scenario
3.3. Effects of Inflation, Russia-Ukraine War, moderating economic growth, and other macroeconomic factors
Chapter 4. Competitive Landscape
4.1. Market Share Analysis
4.1.1. Global Crab Market Share by Company, 2023
4.1.2. Product Offerings of Leading Crab Companies
4.2. Market Entropy
4.2.1. New Product Launches in the Industry
4.2.2. Mergers, Acquisitions, Joint ventures, and Partnerships
4.3. Key Strategies and Best Practices
Chapter 5. Global Market Projections: Best, Reference, and Low Case Scenarios
5.1. Growth Analysis- Case Scenario Definitions
5.2. Low Growth Case Scenario Forecasts
5.3. Reference Growth Case Scenario Forecasts
5.4. High Growth Case Scenario Forecasts
Chapter 6. Market Dynamics
6.1. Crab Market Drivers
6.2. Crab Market Challenges
6.6. Crab Market Opportunities
6.4. Crab Market Trends
Chapter 7. Global Crab Market Outlook Trends
7.1. Global Crab Revenue (USD Million) and CAGR (%) by Type (2021-2032)
7.2. Global Crab Revenue (USD Million) and CAGR (%) by Application (2021-2032)
7.3. Global Crab Revenue (USD Million) and CAGR (%) by Product (2021-2032)
By Type
Blue Crab
Chinese Mitten
Gazami Crab
Others
By Form
Frozen
Canned
Others
By End-User
Foodservice
Retail
By Environment
Aquaculture
Capture fisheries
Chapter 8. Global Crab Regional Analysis and Outlook
8.1. Global Crab Revenue (USD Million) By Regions (2021- 2032)
8.2. North America Crab Revenue (USD Million) by Country (2021-2032)
8.2.1. United States Crab Regional Analysis and Outlook
8.2.2. Canada Crab Regional Analysis and Outlook
8.2.3. Mexico Crab Regional Analysis and Outlook
8.3. Europe Crab Revenue (USD Million), by Country (2021-2032)
8.3.1. Germany Crab Regional Analysis and Outlook
8.3.2. France Crab Regional Analysis and Outlook
8.3.3. United Kingdom Crab Regional Analysis and Outlook
8.3.4. Spain Crab Regional Analysis and Outlook
8.3.5. Italy Crab Regional Analysis and Outlook
8.3.6. Russia Crab Regional Analysis and Outlook
8.3.7. Rest of Europe Crab Regional Analysis and Outlook
8.4. Asia Pacific Crab Revenue (USD Million) by Country (2021-2032)
8.4.1. China Crab Regional Analysis and Outlook
8.4.2. Japan Crab Regional Analysis and Outlook
8.4.3. India Crab Regional Analysis and Outlook
8.4.4. South Korea Crab Regional Analysis and Outlook
8.4.5. Australia Crab Regional Analysis and Outlook
8.4.6. South East Asia Crab Regional Analysis and Outlook
8.4.7. Rest of Asia Pacific Crab Regional Analysis and Outlook
8.5. South America Crab Revenue (USD Million), by Country (2021-2032)
8.5.1. Brazil Crab Regional Analysis and Outlook
8.5.2. Argentina Crab Regional Analysis and Outlook
8.5.3. Rest of South America Crab Regional Analysis and Outlook
8.6. Middle East and Africa Crab Revenue (USD Million) by Country (2021-2032)
8.6.1. Middle East Crab Regional Analysis and Outlook
8.6.2. Africa Crab Regional Analysis and Outlook
Chapter 9. North America Crab Analysis and Outlook
9.1. North America Crab Revenue (USD Million) by Segments (2021-2032)
9.1.1. North America Crab Revenue (USD Million) by Type (2021-2032)
9.1.2. North America Crab Revenue (USD Million) by Application (2021-2032)
9.1.3. North America Crab Revenue (USD Million) by Product (2021-2032)
By Type
Blue Crab
Chinese Mitten
Gazami Crab
Others
By Form
Frozen
Canned
Others
By End-User
Foodservice
Retail
By Environment
Aquaculture
Capture fisheries
Chapter 10. Europe Crab Analysis and Outlook
10.1. Europe Crab Revenue (USD Million), by Segments (USD Million) (2021-2032)
10.1.1. Europe Crab Revenue (USD Million) by Type (2021-2032)
10.1.2. Europe Crab Revenue (USD Million) by Application (2021-2032)
10.1.3. Europe Crab Revenue (USD Million) by Product (2021-2032)
By Type
Blue Crab
Chinese Mitten
Gazami Crab
Others
By Form
Frozen
Canned
Others
By End-User
Foodservice
Retail
By Environment
Aquaculture
Capture fisheries
Chapter 11. Asia Pacific Crab Analysis and Outlook
11.1. Asia Pacific Crab Revenue (USD Million), and Revenue (USD Million) by Segments (2021-2032)
11.1.1. Asia Pacific Crab Revenue (USD Million) by Type (2021-2032)
11.1.2. Asia Pacific Crab Revenue (USD Million) by Application (2021-2032)
11.1.3. Asia Pacific Crab Revenue (USD Million) by Product (2021-2032)
By Type
Blue Crab
Chinese Mitten
Gazami Crab
Others
By Form
Frozen
Canned
Others
By End-User
Foodservice
Retail
By Environment
Aquaculture
Capture fisheries
Chapter 12. South America Crab Analysis and Outlook
12.1. South America Crab Revenue (USD Million), by Segments (2021-2032)
12.1.1. South America Crab Revenue (USD Million) by Type (2021-2032)
12.1.2. South America Crab Revenue (USD Million) by Application (2021-2032)
12.1.3. South America Crab Revenue (USD Million) by Product (2021-2032)
By Type
Blue Crab
Chinese Mitten
Gazami Crab
Others
By Form
Frozen
Canned
Others
By End-User
Foodservice
Retail
By Environment
Aquaculture
Capture fisheries
Chapter 13. Middle East and Africa Crab Analysis and Outlook
13.1. Middle East and Africa Crab Revenue (USD Million), by Segments (2021-2032)
13.1.1. Middle East and Africa Crab Revenue (USD Million) by Type (2021-2032)
13.1.2. Middle East and Africa Crab Revenue (USD Million) by Application (2021-2032)
13.1.3. Middle East and Africa Crab Revenue (USD Million) by Product (2021-2032)
By Type
Blue Crab
Chinese Mitten
Gazami Crab
Others
By Form
Frozen
Canned
Others
By End-User
Foodservice
Retail
By Environment
Aquaculture
Capture fisheries
Chapter 14. Crab Company Profiles
14.1 Business Overview
14.2 Product Profiles
14.3 SWOT Profiles
14.5 Recent Developments
14.6 Financial Profile
List of Companies
Admiralty Island Fisheries Inc
KEYPORT LLC
Maine Lobster Now LLC
Mazzetta Co. LLC
P and D Seafood Co.
Pacific Cove
Pacific Seafood Group
SEA DELIGHT LLC
Seaview Crab Co.
Sogelco International Inc
Supreme Crab and Seafood Inc
Thai Union Group PCL
15. Methodology and Data Sources
15.1 Customization Offerings
15.2 Subscription Services
15.3 Related Reports
15.4 Publisher Expertise
LIST OF TABLES
Table 1 Market Segmentation Analysis
Table 2 Global Crab Market Share of Leading Companies, 2023
Table 3 Product Offerings of Leading Companies
Table 4 Low Growth Scenario Forecasts
Table 5 Reference Case Growth Scenario
Table 6 High Growth Case Scenario
Table 7 Global Crab Revenue (USD Million) And CAGR (%) By Type (2021-2032)
Table 8 Global Crab Revenue (USD Million) And CAGR (%) By Application (2021-2032)
Table 9 Global Crab Revenue (USD Million) And CAGR (%) By Product (2021-2032)
Table 10 Global Crab Market Revenue (USD Million) By Regions (2021-2032)
Table 11 Global Crab Market Share (%) By Regions (2021-2032)
Table 12 North America Crab Revenue (USD Million) By Country (2021-2032)
Table 13 Europe Crab Revenue (USD Million) By Country (2021-2032)
Table 14 Asia Pacific Crab Revenue (USD Million) By Country (2021-2032)
Table 15 South America Crab Revenue (USD Million) By Country (2021-2032)
Table 16 Middle East and Africa Crab Revenue (USD Million) By Region (2021-2032)
Table 17 North America Crab Revenue (USD Million) By Type (2021-2032)
Table 18 North America Crab Revenue (USD Million) By Application (2021-2032)
Table 19 North America Crab Revenue (USD Million) By Product (2021-2032)
Table 20 Europe Crab Revenue (USD Million) By Type (2021-2032)
Table 21 Europe Crab Revenue (USD Million) By Application (2021-2032)
Table 22 Europe Crab Revenue (USD Million) By Product (2021-2032)
Table 23 Asia Pacific Crab Revenue (USD Million) By Type (2021-2032)
Table 24 Asia Pacific Crab Revenue (USD Million) By Application (2021-2032)
Table 25 Asia Pacific Crab Revenue (USD Million) By Product (2021-2032)
Table 26 South America Crab Revenue (USD Million) By Type (2021-2032)
Table 27 South America Crab Revenue (USD Million) By Application (2021-2032)
Table 28 South America Crab Revenue (USD Million) By Product (2021-2032)
Table 29 Middle East and Africa Crab Revenue (USD Million) By Type (2021-2032)
Table 30 Middle East and Africa Crab Revenue (USD Million) By Application (2021-2032)
Table 31 Middle East and Africa Crab Revenue (USD Million) By Product (2021-2032)
LIST OF FIGURES
Figure 1. Market Scope
Figure 2. Pricing Forecasts Per Unit, 2023- 2032
Figure 3. Porter’s Five Forces
Figure 4. Global Crab Market Revenue (USD Million) By Regions (2021-2032)
Figure 5. Global Crab Market Share (%) By Regions (2023)
Figure 6. North America Crab Revenue (USD Million) By Country (2021-2032)
Figure 7. United States Crab Revenue (USD Million) By Country (2021-2032)
Figure 8. Canada Crab Revenue (USD Million) By Country (2021-2032)
Figure 9. Mexico Crab Revenue (USD Million) By Country (2021-2032)
Figure 10. Europe Crab Revenue (USD Million) By Country (2021-2032)
Figure 11. Germany Crab Revenue (USD Million) By Country (2021-2032)
Figure 12. France Crab Revenue (USD Million) By Country (2021-2032)
Figure 13. United Kingdom Crab Revenue (USD Million) By Country (2021-2032)
Figure 14. Spain Crab Revenue (USD Million) By Country (2021-2032)
Figure 15. Italy Crab Revenue (USD Million) By Country (2021-2032)
Figure 16. Russia Crab Revenue (USD Million) By Country (2021-2032)
Figure 17. Rest of Europe Crab Revenue (USD Million) By Country (2021-2032)
Figure 11. Asia Pacific Crab Revenue (USD Million) By Country (2021-2032)
Figure 12. China Crab Revenue (USD Million) By Country (2021-2032)
Figure 13. Japan Crab Revenue (USD Million) By Country (2021-2032)
Figure 14. India Crab Revenue (USD Million) By Country (2021-2032)
Figure 15. South Korea Crab Revenue (USD Million) By Country (2021-2032)
Figure 16. Australia Crab Revenue (USD Million) By Country (2021-2032)
Figure 17. South East Asia Crab Revenue (USD Million) By Country (2021-2032)
Figure 18. South America Crab Revenue (USD Million) By Country (2021-2032)
Figure 19. Brazil Crab Revenue (USD Million) By Country (2021-2032)
Figure 20. Argentina Crab Revenue (USD Million) By Country (2021-2032)
Figure 21. Rest of Asia Pacific Crab Revenue (USD Million) By Country (2021-2032)
Figure 22. Middle East and Africa Crab Revenue (USD Million) By Region (2021-2032)
Figure 23. Saudi Arabia Crab Revenue (USD Million) By Region (2021-2032)
Figure 24. The UAE Crab Revenue (USD Million) By Region (2021-2032)
Figure 25. Rest of Middle East Crab Revenue (USD Million) By Region (2021-2032)
Figure 26. South Africa Crab Revenue (USD Million) By Region (2021-2032)
Figure 27. Africa Crab Revenue (USD Million) By Region (2021-2032)
Figure 28. North America Crab Revenue (USD Million) By Type (2021-2032)
Figure 29. North America Crab Revenue (USD Million) By Application (2021-2032)
Figure 30. North America Crab Revenue (USD Million) By Product (2021-2032)
Figure 31. Europe Crab Revenue (USD Million) By Type (2021-2032)
Figure 32. Europe Crab Revenue (USD Million) By Application (2021-2032)
Figure 33. Europe Crab Revenue (USD Million) By Product (2021-2032)
Figure 34. Asia Pacific Crab Revenue (USD Million) By Type (2021-2032)
Figure 35. Asia Pacific Crab Revenue (USD Million) By Application (2021-2032)
Figure 36. Asia Pacific Crab Revenue (USD Million) By Product (2021-2032)
Figure 37. South America Crab Revenue (USD Million) By Type (2021-2032)
Figure 38. South America Crab Revenue (USD Million) By Application (2021-2032)
Figure 39. South America Crab Revenue (USD Million) By Product (2021-2032)
Figure 40. Middle East and Africa Crab Revenue (USD Million) By Type (2021-2032)
Figure 41. Middle East and Africa Crab Revenue (USD Million) By Application (2021-2032)
Figure 42. Middle East and Africa Crab Revenue (USD Million) By Product (2021-2032)
By Type
Blue Crab
Chinese Mitten
Gazami Crab
Others
By Form
Frozen
Canned
Others
By End-User
Foodservice
Retail
By Environment
Aquaculture
Capture fisheries
Countries Analyzed
North America (US, Canada, Mexico)
Europe (Germany, UK, France, Spain, Italy, Russia, Rest of Europe)
Asia Pacific (China, India, Japan, South Korea, Australia, South East Asia, Rest of Asia)
South America (Brazil, Argentina, Rest of South America)
Middle East and Africa (Saudi Arabia, UAE, Rest of Middle East, South Africa, Egypt, Rest of Africa)
