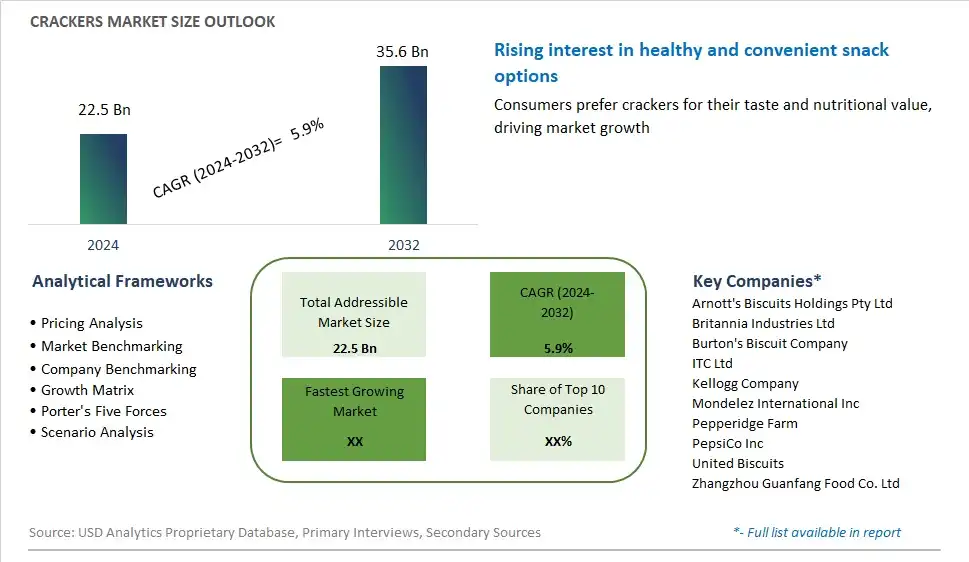
Global Crackers Market Size is valued at $22.5 Billion in 2024 and is forecast to register a growth rate (CAGR) of 5.9% to reach $35.6 Billion by 2032.
The global Crackers Market Comprehensive Study analyzes and forecasts the market size across 6 regions and 24 countries for diverse segments -By Product (Salty Crackers, Sweet Crackers, Gluten-free Crackers, Organic and Natural Crackers), By Distribution Channel (Supermarkets/Hypermarkets, Convenience Stores, Online Retail, Specialty Stores), By Flavor (Classic Flavors, Cheese and Savory Flavors, Sweet and Dessert Flavors, Spicy and Bold Flavors)
An Introduction to Crackers Market
In 2024, the market for crackers continues to flourish as consumers embrace these versatile snacks for their convenience, variety, and appeal as a satisfying between-meal option. Crackers, crispy baked snacks made from flour, water, and seasoning, come in a wide range of flavors, textures, and shapes, catering to diverse taste preferences and dietary needs. The market is driven by factors such as the growing demand for on-the-go snacks, the popularity of snacking occasions, and the increasing consumer interest in healthier and more flavorful alternatives to traditional snack options. Manufacturers are responding to market trends by introducing innovative cracker varieties, including gluten-free, whole grain, low-sodium, and plant-based options, as well as incorporating unique ingredients such as seeds, herbs, and spices for added flavor and nutrition. Moreover, advancements in production technologies, packaging formats, and shelf-life extension techniques ensure that crackers meet quality standards, freshness, and convenience for consumers seeking portable and satisfying snack solutions. As consumers continue to prioritize convenience, taste, and health-conscious snacking, the crackers market presents opportunities for manufacturers to innovate, differentiate, and capture market share in a competitive and dynamic snacking landscape.
Crackers Competitive Landscape
The market report analyses the leading companies in the industry including Arnott's Biscuits Holdings Pty Ltd, Britannia Industries Ltd, Burton's Biscuit Company, ITC Ltd, Kellogg Company, Mondelez International Inc, Pepperidge Farm, PepsiCo Inc, United Biscuits, Zhangzhou Guanfang Food Co. Ltd, and Others.
Crackers Market Dynamics
Crackers Market Trend: Health-Conscious Snacking
A prominent market trend in the Crackers industry is the increasing demand for health-conscious snacking options. Consumers are seeking snacks that not only taste good but also offer nutritional benefits. As a result, there's a growing preference for crackers made from whole grains, seeds, and other wholesome ingredients. Crackers that are low in sodium, free from artificial flavors or preservatives, and labeled as gluten-free or organic are gaining popularity among health-conscious consumers. Brands are responding to this trend by introducing healthier variants of crackers fortified with vitamins, minerals, and fiber, aligning with consumers' desire for nutritious snacking options.
Market Driver: Convenience and On-the-Go Consumption
A significant market driver for Crackers is their convenience and suitability for on-the-go consumption. Crackers are a convenient snack option that can be easily packed into lunchboxes, enjoyed as a quick bite between meals, or served as appetizers at social gatherings. Their portability and longer shelf life make them a preferred choice for busy individuals, students, office workers, and travelers looking for convenient snacking solutions. The versatility of crackers also allows for various serving options, such as pairing with cheese, dips, or spreads, further enhancing their appeal as a convenient and customizable snack option.
Market Opportunity: Flavor Innovation and Premiumization
An opportunity in the Crackers market lies in flavor innovation and premiumization. While traditional flavors like plain, salted, or cheese crackers remain popular, there is growing consumer interest in unique and exotic flavor profiles. Brands can capitalize on this opportunity by introducing innovative flavors inspired by global cuisines, herbs, spices, or gourmet ingredients. Additionally, there's potential for premiumization through the use of high-quality ingredients, artisanal crafting techniques, and upscale packaging to position crackers as a premium snack offering. By tapping into flavor innovation and premiumization, brands can attract discerning consumers seeking elevated snacking experiences and differentiate themselves in the competitive crackers market.
Crackers Market Share Analysis: Salty Crackers held the dominant market share in 2024
In the Crackers Market segmented by product, the largest segment is Salty Crackers, owing to their widespread popularity, versatile flavor profiles, and suitability for various consumption occasions. Salty crackers are a staple snack item enjoyed by consumers of all ages, offering a savory and satisfying crunch that complements a wide range of toppings and accompaniments, including cheese, dips, and spreads. The salty flavor profile appeals to a broad spectrum of consumers and pairs well with both savory and sweet toppings, making salty crackers a versatile option for snacking, appetizers, and meal accompaniments. Further, the convenience and portability of salty crackers make them a convenient on-the-go snack option for busy consumers. While sweet crackers, gluten-free crackers, and organic and natural crackers also cater to specific dietary preferences and consumer segments, the Salty Crackers segment maintains its dominance, reflecting its widespread acceptance and versatility in meeting diverse consumer snacking needs.
Crackers Market Share Analysis: Online Retail market is poised to register the fastest growth rae over the forecast period to 2032
In the Crackers Market segmented by distribution channel, the fastest-growing segment is Online Retail, driven by the increasing popularity of e-commerce platforms and the convenience they offer to consumers. Online retail channels provide consumers with a convenient and hassle-free shopping experience, allowing them to browse through a wide selection of crackers from the comfort of their homes and to conveniently purchase their preferred products with just a few clicks. Further, the COVID-19 pandemic has accelerated the shift towards online shopping as consumers prioritize safety and social distancing measures. Additionally, online retail platforms often offer a broader range of cracker varieties and flavors compared to physical stores, providing consumers with more choices and opportunities to discover new products. The convenience of doorstep delivery and the availability of subscription services further contribute to the growth of online retail in the crackers market. While supermarkets/hypermarkets, convenience stores, and specialty stores remain significant distribution channels, the Online Retail segment demonstrates rapid expansion, reflecting evolving consumer preferences and the digital transformation of the retail landscape.
Crackers Market Share Analysis: Cheese and Savory Flavors held the dominant market share in 2024
In the Crackers Market segmented by flavor, the largest segment is Cheese and Savory Flavors, owing to their widespread appeal, versatility, and ability to satisfy savory cravings among consumers. Cheese and savory-flavored crackers offer a rich and indulgent taste experience, often featuring a combination of cheese, herbs, spices, and other savory ingredients that tantalize the taste buds. These crackers are highly versatile and can be enjoyed on their own as a satisfying snack or paired with various toppings such as cheese, dips, spreads, or meats for appetizers or party platters. Further, the savory flavor profile makes cheese crackers a popular choice for consumers of all ages and preferences, contributing to their widespread acceptance in the market. While classic flavors, sweet and dessert flavors, and spicy and bold flavors also cater to specific taste preferences, the Cheese and Savory Flavors segment maintains its dominance, reflecting its enduring popularity and versatility in meeting diverse consumer snacking needs.
Crackers Market Segmentation
By Product
Salty Crackers
Sweet Crackers
Gluten-free Crackers
Organic and Natural Crackers
By Distribution Channel
Supermarkets/Hypermarkets
Convenience Stores
Online Retail
Specialty Stores
By Flavor
Classic Flavors
Cheese and Savory Flavors
Sweet and Dessert Flavors
Spicy and Bold Flavors
Countries Analyzed
North America (US, Canada, Mexico)
Europe (Germany, UK, France, Spain, Italy, Russia, Rest of Europe)
Asia Pacific (China, India, Japan, South Korea, Australia, South East Asia, Rest of Asia)
South America (Brazil, Argentina, Rest of South America)
Middle East and Africa (Saudi Arabia, UAE, Rest of Middle East, South Africa, Egypt, Rest of Africa)
Crackers Companies Profiled in the Study
Arnott's Biscuits Holdings Pty Ltd
Britannia Industries Ltd
Burton's Biscuit Company
ITC Ltd
Kellogg Company
Mondelez International Inc
Pepperidge Farm
PepsiCo Inc
United Biscuits
Zhangzhou Guanfang Food Co. Ltd
*- List Not Exhaustive
Chapter 1. TABLE OF CONTENTS
Chapter 2. Introduction to Crackers Market
2.1. Market Overview
2.2. Key Statistics and Report Highlights
2.3. Scope of the Comprehensive Study
2.3.1. Market Definition
2.3.2 Countries and Regions Covered
2.3.3 Research Objective
2.3.4 Units, Currency, and Conversions
2.3.5 Industry Value Chain
2.4. Key Market Segments
2.5. Key Companies
2.6. Study Period
Chapter 3. Strategic Analysis Review
3.1. Crackers Pricing Analysis and Forecast
3.2. Porter’s Five Forces
3.3. Market Ecosystem
3.4. SWOT Analysis
3.5. Regulatory Scenario
3.3. Effects of Inflation, Russia-Ukraine War, moderating economic growth, and other macroeconomic factors
Chapter 4. Competitive Landscape
4.1. Market Share Analysis
4.1.1. Global Crackers Market Share by Company, 2023
4.1.2. Product Offerings of Leading Crackers Companies
4.2. Market Entropy
4.2.1. New Product Launches in the Industry
4.2.2. Mergers, Acquisitions, Joint ventures, and Partnerships
4.3. Key Strategies and Best Practices
Chapter 5. Global Market Projections: Best, Reference, and Low Case Scenarios
5.1. Growth Analysis- Case Scenario Definitions
5.2. Low Growth Case Scenario Forecasts
5.3. Reference Growth Case Scenario Forecasts
5.4. High Growth Case Scenario Forecasts
Chapter 6. Market Dynamics
6.1. Crackers Market Drivers
6.2. Crackers Market Challenges
6.6. Crackers Market Opportunities
6.4. Crackers Market Trends
Chapter 7. Global Crackers Market Outlook Trends
7.1. Global Crackers Revenue (USD Million) and CAGR (%) by Type (2021-2032)
7.2. Global Crackers Revenue (USD Million) and CAGR (%) by Application (2021-2032)
7.3. Global Crackers Revenue (USD Million) and CAGR (%) by Product (2021-2032)
By Product
Salty Crackers
Sweet Crackers
Gluten-free Crackers
Organic and Natural Crackers
By Distribution Channel
Supermarkets/Hypermarkets
Convenience Stores
Online Retail
Specialty Stores
By Flavor
Classic Flavors
Cheese and Savory Flavors
Sweet and Dessert Flavors
Spicy and Bold Flavors
Chapter 8. Global Crackers Regional Analysis and Outlook
8.1. Global Crackers Revenue (USD Million) By Regions (2021- 2032)
8.2. North America Crackers Revenue (USD Million) by Country (2021-2032)
8.2.1. United States Crackers Regional Analysis and Outlook
8.2.2. Canada Crackers Regional Analysis and Outlook
8.2.3. Mexico Crackers Regional Analysis and Outlook
8.3. Europe Crackers Revenue (USD Million), by Country (2021-2032)
8.3.1. Germany Crackers Regional Analysis and Outlook
8.3.2. France Crackers Regional Analysis and Outlook
8.3.3. United Kingdom Crackers Regional Analysis and Outlook
8.3.4. Spain Crackers Regional Analysis and Outlook
8.3.5. Italy Crackers Regional Analysis and Outlook
8.3.6. Russia Crackers Regional Analysis and Outlook
8.3.7. Rest of Europe Crackers Regional Analysis and Outlook
8.4. Asia Pacific Crackers Revenue (USD Million) by Country (2021-2032)
8.4.1. China Crackers Regional Analysis and Outlook
8.4.2. Japan Crackers Regional Analysis and Outlook
8.4.3. India Crackers Regional Analysis and Outlook
8.4.4. South Korea Crackers Regional Analysis and Outlook
8.4.5. Australia Crackers Regional Analysis and Outlook
8.4.6. South East Asia Crackers Regional Analysis and Outlook
8.4.7. Rest of Asia Pacific Crackers Regional Analysis and Outlook
8.5. South America Crackers Revenue (USD Million), by Country (2021-2032)
8.5.1. Brazil Crackers Regional Analysis and Outlook
8.5.2. Argentina Crackers Regional Analysis and Outlook
8.5.3. Rest of South America Crackers Regional Analysis and Outlook
8.6. Middle East and Africa Crackers Revenue (USD Million) by Country (2021-2032)
8.6.1. Middle East Crackers Regional Analysis and Outlook
8.6.2. Africa Crackers Regional Analysis and Outlook
Chapter 9. North America Crackers Analysis and Outlook
9.1. North America Crackers Revenue (USD Million) by Segments (2021-2032)
9.1.1. North America Crackers Revenue (USD Million) by Type (2021-2032)
9.1.2. North America Crackers Revenue (USD Million) by Application (2021-2032)
9.1.3. North America Crackers Revenue (USD Million) by Product (2021-2032)
By Product
Salty Crackers
Sweet Crackers
Gluten-free Crackers
Organic and Natural Crackers
By Distribution Channel
Supermarkets/Hypermarkets
Convenience Stores
Online Retail
Specialty Stores
By Flavor
Classic Flavors
Cheese and Savory Flavors
Sweet and Dessert Flavors
Spicy and Bold Flavors
Chapter 10. Europe Crackers Analysis and Outlook
10.1. Europe Crackers Revenue (USD Million), by Segments (USD Million) (2021-2032)
10.1.1. Europe Crackers Revenue (USD Million) by Type (2021-2032)
10.1.2. Europe Crackers Revenue (USD Million) by Application (2021-2032)
10.1.3. Europe Crackers Revenue (USD Million) by Product (2021-2032)
By Product
Salty Crackers
Sweet Crackers
Gluten-free Crackers
Organic and Natural Crackers
By Distribution Channel
Supermarkets/Hypermarkets
Convenience Stores
Online Retail
Specialty Stores
By Flavor
Classic Flavors
Cheese and Savory Flavors
Sweet and Dessert Flavors
Spicy and Bold Flavors
Chapter 11. Asia Pacific Crackers Analysis and Outlook
11.1. Asia Pacific Crackers Revenue (USD Million), and Revenue (USD Million) by Segments (2021-2032)
11.1.1. Asia Pacific Crackers Revenue (USD Million) by Type (2021-2032)
11.1.2. Asia Pacific Crackers Revenue (USD Million) by Application (2021-2032)
11.1.3. Asia Pacific Crackers Revenue (USD Million) by Product (2021-2032)
By Product
Salty Crackers
Sweet Crackers
Gluten-free Crackers
Organic and Natural Crackers
By Distribution Channel
Supermarkets/Hypermarkets
Convenience Stores
Online Retail
Specialty Stores
By Flavor
Classic Flavors
Cheese and Savory Flavors
Sweet and Dessert Flavors
Spicy and Bold Flavors
Chapter 12. South America Crackers Analysis and Outlook
12.1. South America Crackers Revenue (USD Million), by Segments (2021-2032)
12.1.1. South America Crackers Revenue (USD Million) by Type (2021-2032)
12.1.2. South America Crackers Revenue (USD Million) by Application (2021-2032)
12.1.3. South America Crackers Revenue (USD Million) by Product (2021-2032)
By Product
Salty Crackers
Sweet Crackers
Gluten-free Crackers
Organic and Natural Crackers
By Distribution Channel
Supermarkets/Hypermarkets
Convenience Stores
Online Retail
Specialty Stores
By Flavor
Classic Flavors
Cheese and Savory Flavors
Sweet and Dessert Flavors
Spicy and Bold Flavors
Chapter 13. Middle East and Africa Crackers Analysis and Outlook
13.1. Middle East and Africa Crackers Revenue (USD Million), by Segments (2021-2032)
13.1.1. Middle East and Africa Crackers Revenue (USD Million) by Type (2021-2032)
13.1.2. Middle East and Africa Crackers Revenue (USD Million) by Application (2021-2032)
13.1.3. Middle East and Africa Crackers Revenue (USD Million) by Product (2021-2032)
By Product
Salty Crackers
Sweet Crackers
Gluten-free Crackers
Organic and Natural Crackers
By Distribution Channel
Supermarkets/Hypermarkets
Convenience Stores
Online Retail
Specialty Stores
By Flavor
Classic Flavors
Cheese and Savory Flavors
Sweet and Dessert Flavors
Spicy and Bold Flavors
Chapter 14. Crackers Company Profiles
14.1 Business Overview
14.2 Product Profiles
14.3 SWOT Profiles
14.5 Recent Developments
14.6 Financial Profile
List of Companies
Arnott's Biscuits Holdings Pty Ltd
Britannia Industries Ltd
Burton's Biscuit Company
ITC Ltd
Kellogg Company
Mondelez International Inc
Pepperidge Farm
PepsiCo Inc
United Biscuits
Zhangzhou Guanfang Food Co. Ltd
15. Methodology and Data Sources
15.1 Customization Offerings
15.2 Subscription Services
15.3 Related Reports
15.4 Publisher Expertise
LIST OF TABLES
Table 1 Market Segmentation Analysis
Table 2 Global Crackers Market Share of Leading Companies, 2023
Table 3 Product Offerings of Leading Companies
Table 4 Low Growth Scenario Forecasts
Table 5 Reference Case Growth Scenario
Table 6 High Growth Case Scenario
Table 7 Global Crackers Revenue (USD Million) And CAGR (%) By Type (2021-2032)
Table 8 Global Crackers Revenue (USD Million) And CAGR (%) By Application (2021-2032)
Table 9 Global Crackers Revenue (USD Million) And CAGR (%) By Product (2021-2032)
Table 10 Global Crackers Market Revenue (USD Million) By Regions (2021-2032)
Table 11 Global Crackers Market Share (%) By Regions (2021-2032)
Table 12 North America Crackers Revenue (USD Million) By Country (2021-2032)
Table 13 Europe Crackers Revenue (USD Million) By Country (2021-2032)
Table 14 Asia Pacific Crackers Revenue (USD Million) By Country (2021-2032)
Table 15 South America Crackers Revenue (USD Million) By Country (2021-2032)
Table 16 Middle East and Africa Crackers Revenue (USD Million) By Region (2021-2032)
Table 17 North America Crackers Revenue (USD Million) By Type (2021-2032)
Table 18 North America Crackers Revenue (USD Million) By Application (2021-2032)
Table 19 North America Crackers Revenue (USD Million) By Product (2021-2032)
Table 20 Europe Crackers Revenue (USD Million) By Type (2021-2032)
Table 21 Europe Crackers Revenue (USD Million) By Application (2021-2032)
Table 22 Europe Crackers Revenue (USD Million) By Product (2021-2032)
Table 23 Asia Pacific Crackers Revenue (USD Million) By Type (2021-2032)
Table 24 Asia Pacific Crackers Revenue (USD Million) By Application (2021-2032)
Table 25 Asia Pacific Crackers Revenue (USD Million) By Product (2021-2032)
Table 26 South America Crackers Revenue (USD Million) By Type (2021-2032)
Table 27 South America Crackers Revenue (USD Million) By Application (2021-2032)
Table 28 South America Crackers Revenue (USD Million) By Product (2021-2032)
Table 29 Middle East and Africa Crackers Revenue (USD Million) By Type (2021-2032)
Table 30 Middle East and Africa Crackers Revenue (USD Million) By Application (2021-2032)
Table 31 Middle East and Africa Crackers Revenue (USD Million) By Product (2021-2032)
LIST OF FIGURES
Figure 1. Market Scope
Figure 2. Pricing Forecasts Per Unit, 2023- 2032
Figure 3. Porter’s Five Forces
Figure 4. Global Crackers Market Revenue (USD Million) By Regions (2021-2032)
Figure 5. Global Crackers Market Share (%) By Regions (2023)
Figure 6. North America Crackers Revenue (USD Million) By Country (2021-2032)
Figure 7. United States Crackers Revenue (USD Million) By Country (2021-2032)
Figure 8. Canada Crackers Revenue (USD Million) By Country (2021-2032)
Figure 9. Mexico Crackers Revenue (USD Million) By Country (2021-2032)
Figure 10. Europe Crackers Revenue (USD Million) By Country (2021-2032)
Figure 11. Germany Crackers Revenue (USD Million) By Country (2021-2032)
Figure 12. France Crackers Revenue (USD Million) By Country (2021-2032)
Figure 13. United Kingdom Crackers Revenue (USD Million) By Country (2021-2032)
Figure 14. Spain Crackers Revenue (USD Million) By Country (2021-2032)
Figure 15. Italy Crackers Revenue (USD Million) By Country (2021-2032)
Figure 16. Russia Crackers Revenue (USD Million) By Country (2021-2032)
Figure 17. Rest of Europe Crackers Revenue (USD Million) By Country (2021-2032)
Figure 11. Asia Pacific Crackers Revenue (USD Million) By Country (2021-2032)
Figure 12. China Crackers Revenue (USD Million) By Country (2021-2032)
Figure 13. Japan Crackers Revenue (USD Million) By Country (2021-2032)
Figure 14. India Crackers Revenue (USD Million) By Country (2021-2032)
Figure 15. South Korea Crackers Revenue (USD Million) By Country (2021-2032)
Figure 16. Australia Crackers Revenue (USD Million) By Country (2021-2032)
Figure 17. South East Asia Crackers Revenue (USD Million) By Country (2021-2032)
Figure 18. South America Crackers Revenue (USD Million) By Country (2021-2032)
Figure 19. Brazil Crackers Revenue (USD Million) By Country (2021-2032)
Figure 20. Argentina Crackers Revenue (USD Million) By Country (2021-2032)
Figure 21. Rest of Asia Pacific Crackers Revenue (USD Million) By Country (2021-2032)
Figure 22. Middle East and Africa Crackers Revenue (USD Million) By Region (2021-2032)
Figure 23. Saudi Arabia Crackers Revenue (USD Million) By Region (2021-2032)
Figure 24. The UAE Crackers Revenue (USD Million) By Region (2021-2032)
Figure 25. Rest of Middle East Crackers Revenue (USD Million) By Region (2021-2032)
Figure 26. South Africa Crackers Revenue (USD Million) By Region (2021-2032)
Figure 27. Africa Crackers Revenue (USD Million) By Region (2021-2032)
Figure 28. North America Crackers Revenue (USD Million) By Type (2021-2032)
Figure 29. North America Crackers Revenue (USD Million) By Application (2021-2032)
Figure 30. North America Crackers Revenue (USD Million) By Product (2021-2032)
Figure 31. Europe Crackers Revenue (USD Million) By Type (2021-2032)
Figure 32. Europe Crackers Revenue (USD Million) By Application (2021-2032)
Figure 33. Europe Crackers Revenue (USD Million) By Product (2021-2032)
Figure 34. Asia Pacific Crackers Revenue (USD Million) By Type (2021-2032)
Figure 35. Asia Pacific Crackers Revenue (USD Million) By Application (2021-2032)
Figure 36. Asia Pacific Crackers Revenue (USD Million) By Product (2021-2032)
Figure 37. South America Crackers Revenue (USD Million) By Type (2021-2032)
Figure 38. South America Crackers Revenue (USD Million) By Application (2021-2032)
Figure 39. South America Crackers Revenue (USD Million) By Product (2021-2032)
Figure 40. Middle East and Africa Crackers Revenue (USD Million) By Type (2021-2032)
Figure 41. Middle East and Africa Crackers Revenue (USD Million) By Application (2021-2032)
Figure 42. Middle East and Africa Crackers Revenue (USD Million) By Product (2021-2032)
By Product
Salty Crackers
Sweet Crackers
Gluten-free Crackers
Organic and Natural Crackers
By Distribution Channel
Supermarkets/Hypermarkets
Convenience Stores
Online Retail
Specialty Stores
By Flavor
Classic Flavors
Cheese and Savory Flavors
Sweet and Dessert Flavors
Spicy and Bold Flavors
Countries Analyzed
North America (US, Canada, Mexico)
Europe (Germany, UK, France, Spain, Italy, Russia, Rest of Europe)
Asia Pacific (China, India, Japan, South Korea, Australia, South East Asia, Rest of Asia)
South America (Brazil, Argentina, Rest of South America)
Middle East and Africa (Saudi Arabia, UAE, Rest of Middle East, South Africa, Egypt, Rest of Africa)
