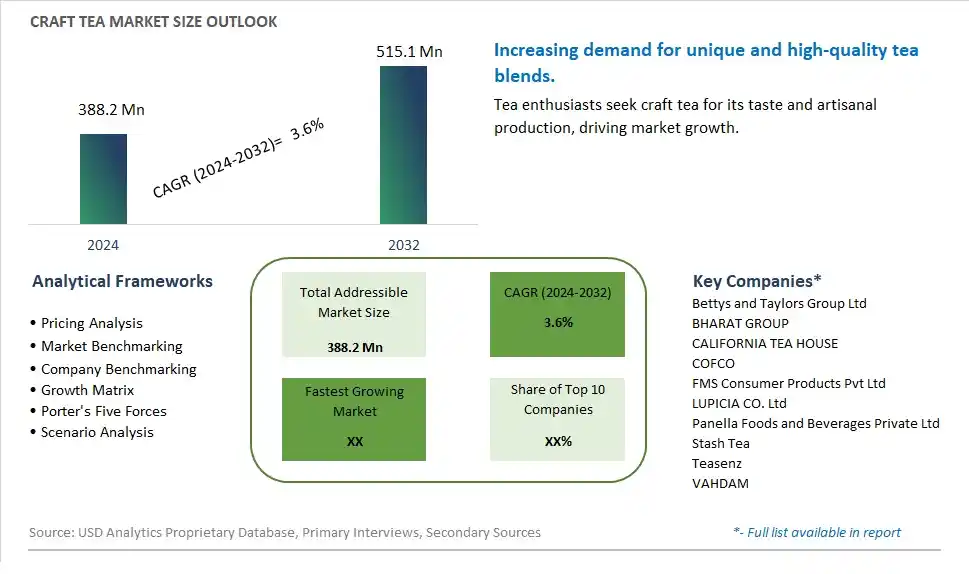
Global Craft Tea Market Size is valued at $388.2 Million in 2024 and is forecast to register a growth rate (CAGR) of 3.6% to reach $515.1 Million by 2032.
The global Craft Tea Market Comprehensive Study analyzes and forecasts the market size across 6 regions and 24 countries for diverse segments -By Distribution Channel (Supermarkets/Hypermarkets, Convenience Stores, Online Retail, Others), By Product (Blooming craft tea, Active craft tea, Floating floss craft tea), By End-User (Commercial, Individual)
An Introduction to Craft Tea Market
In 2024, the Craft Tea market is witnessing robust growth, driven by the increasing demand for high-quality and unique tea experiences. Craft tea, produced by small-scale tea artisans, is valued for its exceptional flavors, traditional processing methods, and use of high-quality tea leaves. The market is supported by the growing trend towards premium and specialty beverages. Advances in tea cultivation, processing, and blending techniques are enhancing the flavor, aroma, and quality of craft teas. The market is also benefiting from the trend towards clean-label, organic, and sustainably sourced teas, appealing to tea enthusiasts seeking high-quality and authentic tea experiences.
Craft Tea Competitive Landscape
The market report analyses the leading companies in the industry including Bettys and Taylors Group Ltd, BHARAT GROUP, CALIFORNIA TEA HOUSE, COFCO, FMS Consumer Products Pvt Ltd, LUPICIA CO. Ltd, Panella Foods and Beverages Private Ltd, Stash Tea, Teasenz, VAHDAM, and Others.
Craft Tea Market Dynamics
Craft Tea Market Trend: Growing Demand for Specialty and Artisanal Tea
One prominent market trend for Craft Tea is the growing demand for specialty and artisanal tea products. Consumers are increasingly seeking unique tea blends, organic options, and teas with health benefits. This trend is driven by a desire for premium quality, sustainability, and diverse flavor experiences, creating opportunities for craft tea producers to innovate and capture a share of the specialty tea market.
Craft Tea Market Driver: Health and Wellness Consciousness
The market driver for Craft Tea is the increasing health and wellness consciousness among consumers. Many people are turning to tea as a healthier alternative to sugary beverages, and they are interested in teas that offer functional benefits like antioxidants, stress relief, or energy boost. Craft tea producers can capitalize on this driver by offering teas with natural ingredients, herbal blends, and wellness-focused formulations.
Craft Tea Market Opportunity: Creative Tea Blends and Packaging
An opportunity within the Craft Tea market lies in creating creative tea blends and innovative packaging. Craft tea producers can differentiate themselves by developing unique flavor combinations, experimenting with herbs, spices, and botanicals, and offering customizable tea blends. Additionally, innovative and eco-friendly packaging solutions can enhance the brand's appeal and attract environmentally conscious consumers.
Craft Tea Market Share Analysis: Supermarkets/Hypermarkets segment generated the highest revenue share in the industry
The Supermarkets/Hypermarkets segment is the largest in the Craft Tea Market by distribution channel. This segment's dominance is driven by several factors that contribute to its substantial market share and strong presence in the craft tea industry. Supermarkets and hypermarkets offer a wide range of products under one roof, including various types and flavors of craft tea, providing consumers with convenience and accessibility. The extensive shelf space allocated to tea products in these retail outlets allows craft tea brands to showcase their offerings effectively, attract consumer attention, and capitalize on impulse purchases. Additionally, supermarkets and hypermarkets often run promotional campaigns, discounts, and special offers on craft tea products, further driving sales volume and consumer engagement. The segment's ability to reach a broad customer base, leverage established retail infrastructure, and provide a diverse selection of craft teas positions it as the largest and most influential distribution channel in the Craft Tea Market.
Craft Tea Market Share Analysis: Blooming Craft Tea is the fastest growing segment over the forecast period to 2032
The Blooming Craft Tea segment is anticipated to experience the fastest growth in the Craft Tea Market by 2032. This surge in popularity can be attributed to several factors that contribute to the segment's rapid expansion and consumer appeal. Blooming craft tea, also known as flowering tea, is an artisanal tea variety that features hand-tied tea leaves and edible flowers that unfurl into a visually stunning display when steeped in hot water. This unique and aesthetically pleasing presentation, coupled with the health benefits associated with tea consumption, has captured the interest of tea enthusiasts, gift seekers, and wellness-conscious consumers alike. The Blooming Craft Tea segment's growth is further propelled by its social media appeal, where visually captivating tea preparations often garner attention and drive curiosity among potential consumers. As consumers increasingly seek novel tea experiences, sensory enjoyment, and wellness-oriented products, the Blooming Craft Tea segment emerges as a frontrunner in the Craft Tea Market's growth trajectory.
Craft Tea Market Share Analysis: Individual segment generated the highest revenue share in the industry
The Individual segment is the largest in the Craft Tea Market by end-user. This segment's prominence stems from several key factors that contribute to its substantial market share and robust growth trajectory. As consumers increasingly prioritize health-conscious choices, unique flavor experiences, and artisanal products, the demand for craft tea among individual consumers has surged significantly. Individual consumers, including tea enthusiasts, health-conscious individuals, and those seeking premium and exotic tea varieties, drive substantial consumption of craft teas across various forms, flavors, and blends. Furthermore, the rise of specialty tea cafes, tea boutiques, and online platforms catering to individual consumers has further bolstered the segment's growth. The Individual segment's ability to cater to diverse tastes, preferences, and lifestyle choices positions it as the largest and most influential end-user segment in the Craft Tea Market, driving innovation, product differentiation, and market expansion.
Craft Tea Market Segmentation
By Distribution Channel
Supermarkets/Hypermarkets
Convenience Stores
Online Retail
Others
By Product
Blooming craft tea
Active craft tea
Floating floss craft tea
By End-User
Commercial
Individual
Countries Analyzed
North America (US, Canada, Mexico)
Europe (Germany, UK, France, Spain, Italy, Russia, Rest of Europe)
Asia Pacific (China, India, Japan, South Korea, Australia, South East Asia, Rest of Asia)
South America (Brazil, Argentina, Rest of South America)
Middle East and Africa (Saudi Arabia, UAE, Rest of Middle East, South Africa, Egypt, Rest of Africa)
Craft Tea Companies Profiled in the Study
Bettys and Taylors Group Ltd
BHARAT GROUP
CALIFORNIA TEA HOUSE
COFCO
FMS Consumer Products Pvt Ltd
LUPICIA CO. Ltd
Panella Foods and Beverages Private Ltd
Stash Tea
Teasenz
VAHDAM
*- List Not Exhaustive
Chapter 1. TABLE OF CONTENTS
Chapter 2. Introduction to Craft Tea Market
2.1. Market Overview
2.2. Key Statistics and Report Highlights
2.3. Scope of the Comprehensive Study
2.3.1. Market Definition
2.3.2 Countries and Regions Covered
2.3.3 Research Objective
2.3.4 Units, Currency, and Conversions
2.3.5 Industry Value Chain
2.4. Key Market Segments
2.5. Key Companies
2.6. Study Period
Chapter 3. Strategic Analysis Review
3.1. Craft Tea Pricing Analysis and Forecast
3.2. Porter’s Five Forces
3.3. Market Ecosystem
3.4. SWOT Analysis
3.5. Regulatory Scenario
3.3. Effects of Inflation, Russia-Ukraine War, moderating economic growth, and other macroeconomic factors
Chapter 4. Competitive Landscape
4.1. Market Share Analysis
4.1.1. Global Craft Tea Market Share by Company, 2023
4.1.2. Product Offerings of Leading Craft Tea Companies
4.2. Market Entropy
4.2.1. New Product Launches in the Industry
4.2.2. Mergers, Acquisitions, Joint ventures, and Partnerships
4.3. Key Strategies and Best Practices
Chapter 5. Global Market Projections: Best, Reference, and Low Case Scenarios
5.1. Growth Analysis- Case Scenario Definitions
5.2. Low Growth Case Scenario Forecasts
5.3. Reference Growth Case Scenario Forecasts
5.4. High Growth Case Scenario Forecasts
Chapter 6. Market Dynamics
6.1. Craft Tea Market Drivers
6.2. Craft Tea Market Challenges
6.6. Craft Tea Market Opportunities
6.4. Craft Tea Market Trends
Chapter 7. Global Craft Tea Market Outlook Trends
7.1. Global Craft Tea Revenue (USD Million) and CAGR (%) by Type (2021-2032)
7.2. Global Craft Tea Revenue (USD Million) and CAGR (%) by Application (2021-2032)
7.3. Global Craft Tea Revenue (USD Million) and CAGR (%) by Product (2021-2032)
By Distribution Channel
Supermarkets/Hypermarkets
Convenience Stores
Online Retail
Others
By Product
Blooming craft tea
Active craft tea
Floating floss craft tea
By End-User
Commercial
Individual
Chapter 8. Global Craft Tea Regional Analysis and Outlook
8.1. Global Craft Tea Revenue (USD Million) By Regions (2021- 2032)
8.2. North America Craft Tea Revenue (USD Million) by Country (2021-2032)
8.2.1. United States Craft Tea Regional Analysis and Outlook
8.2.2. Canada Craft Tea Regional Analysis and Outlook
8.2.3. Mexico Craft Tea Regional Analysis and Outlook
8.3. Europe Craft Tea Revenue (USD Million), by Country (2021-2032)
8.3.1. Germany Craft Tea Regional Analysis and Outlook
8.3.2. France Craft Tea Regional Analysis and Outlook
8.3.3. United Kingdom Craft Tea Regional Analysis and Outlook
8.3.4. Spain Craft Tea Regional Analysis and Outlook
8.3.5. Italy Craft Tea Regional Analysis and Outlook
8.3.6. Russia Craft Tea Regional Analysis and Outlook
8.3.7. Rest of Europe Craft Tea Regional Analysis and Outlook
8.4. Asia Pacific Craft Tea Revenue (USD Million) by Country (2021-2032)
8.4.1. China Craft Tea Regional Analysis and Outlook
8.4.2. Japan Craft Tea Regional Analysis and Outlook
8.4.3. India Craft Tea Regional Analysis and Outlook
8.4.4. South Korea Craft Tea Regional Analysis and Outlook
8.4.5. Australia Craft Tea Regional Analysis and Outlook
8.4.6. South East Asia Craft Tea Regional Analysis and Outlook
8.4.7. Rest of Asia Pacific Craft Tea Regional Analysis and Outlook
8.5. South America Craft Tea Revenue (USD Million), by Country (2021-2032)
8.5.1. Brazil Craft Tea Regional Analysis and Outlook
8.5.2. Argentina Craft Tea Regional Analysis and Outlook
8.5.3. Rest of South America Craft Tea Regional Analysis and Outlook
8.6. Middle East and Africa Craft Tea Revenue (USD Million) by Country (2021-2032)
8.6.1. Middle East Craft Tea Regional Analysis and Outlook
8.6.2. Africa Craft Tea Regional Analysis and Outlook
Chapter 9. North America Craft Tea Analysis and Outlook
9.1. North America Craft Tea Revenue (USD Million) by Segments (2021-2032)
9.1.1. North America Craft Tea Revenue (USD Million) by Type (2021-2032)
9.1.2. North America Craft Tea Revenue (USD Million) by Application (2021-2032)
9.1.3. North America Craft Tea Revenue (USD Million) by Product (2021-2032)
By Distribution Channel
Supermarkets/Hypermarkets
Convenience Stores
Online Retail
Others
By Product
Blooming craft tea
Active craft tea
Floating floss craft tea
By End-User
Commercial
Individual
Chapter 10. Europe Craft Tea Analysis and Outlook
10.1. Europe Craft Tea Revenue (USD Million), by Segments (USD Million) (2021-2032)
10.1.1. Europe Craft Tea Revenue (USD Million) by Type (2021-2032)
10.1.2. Europe Craft Tea Revenue (USD Million) by Application (2021-2032)
10.1.3. Europe Craft Tea Revenue (USD Million) by Product (2021-2032)
By Distribution Channel
Supermarkets/Hypermarkets
Convenience Stores
Online Retail
Others
By Product
Blooming craft tea
Active craft tea
Floating floss craft tea
By End-User
Commercial
Individual
Chapter 11. Asia Pacific Craft Tea Analysis and Outlook
11.1. Asia Pacific Craft Tea Revenue (USD Million), and Revenue (USD Million) by Segments (2021-2032)
11.1.1. Asia Pacific Craft Tea Revenue (USD Million) by Type (2021-2032)
11.1.2. Asia Pacific Craft Tea Revenue (USD Million) by Application (2021-2032)
11.1.3. Asia Pacific Craft Tea Revenue (USD Million) by Product (2021-2032)
By Distribution Channel
Supermarkets/Hypermarkets
Convenience Stores
Online Retail
Others
By Product
Blooming craft tea
Active craft tea
Floating floss craft tea
By End-User
Commercial
Individual
Chapter 12. South America Craft Tea Analysis and Outlook
12.1. South America Craft Tea Revenue (USD Million), by Segments (2021-2032)
12.1.1. South America Craft Tea Revenue (USD Million) by Type (2021-2032)
12.1.2. South America Craft Tea Revenue (USD Million) by Application (2021-2032)
12.1.3. South America Craft Tea Revenue (USD Million) by Product (2021-2032)
By Distribution Channel
Supermarkets/Hypermarkets
Convenience Stores
Online Retail
Others
By Product
Blooming craft tea
Active craft tea
Floating floss craft tea
By End-User
Commercial
Individual
Chapter 13. Middle East and Africa Craft Tea Analysis and Outlook
13.1. Middle East and Africa Craft Tea Revenue (USD Million), by Segments (2021-2032)
13.1.1. Middle East and Africa Craft Tea Revenue (USD Million) by Type (2021-2032)
13.1.2. Middle East and Africa Craft Tea Revenue (USD Million) by Application (2021-2032)
13.1.3. Middle East and Africa Craft Tea Revenue (USD Million) by Product (2021-2032)
By Distribution Channel
Supermarkets/Hypermarkets
Convenience Stores
Online Retail
Others
By Product
Blooming craft tea
Active craft tea
Floating floss craft tea
By End-User
Commercial
Individual
Chapter 14. Craft Tea Company Profiles
14.1 Business Overview
14.2 Product Profiles
14.3 SWOT Profiles
14.5 Recent Developments
14.6 Financial Profile
List of Companies
Bettys and Taylors Group Ltd
BHARAT GROUP
CALIFORNIA TEA HOUSE
COFCO
FMS Consumer Products Pvt Ltd
LUPICIA CO. Ltd
Panella Foods and Beverages Private Ltd
Stash Tea
Teasenz
VAHDAM
15. Methodology and Data Sources
15.1 Customization Offerings
15.2 Subscription Services
15.3 Related Reports
15.4 Publisher Expertise
LIST OF TABLES
Table 1 Market Segmentation Analysis
Table 2 Global Craft Tea Market Share of Leading Companies, 2023
Table 3 Product Offerings of Leading Companies
Table 4 Low Growth Scenario Forecasts
Table 5 Reference Case Growth Scenario
Table 6 High Growth Case Scenario
Table 7 Global Craft Tea Revenue (USD Million) And CAGR (%) By Type (2021-2032)
Table 8 Global Craft Tea Revenue (USD Million) And CAGR (%) By Application (2021-2032)
Table 9 Global Craft Tea Revenue (USD Million) And CAGR (%) By Product (2021-2032)
Table 10 Global Craft Tea Market Revenue (USD Million) By Regions (2021-2032)
Table 11 Global Craft Tea Market Share (%) By Regions (2021-2032)
Table 12 North America Craft Tea Revenue (USD Million) By Country (2021-2032)
Table 13 Europe Craft Tea Revenue (USD Million) By Country (2021-2032)
Table 14 Asia Pacific Craft Tea Revenue (USD Million) By Country (2021-2032)
Table 15 South America Craft Tea Revenue (USD Million) By Country (2021-2032)
Table 16 Middle East and Africa Craft Tea Revenue (USD Million) By Region (2021-2032)
Table 17 North America Craft Tea Revenue (USD Million) By Type (2021-2032)
Table 18 North America Craft Tea Revenue (USD Million) By Application (2021-2032)
Table 19 North America Craft Tea Revenue (USD Million) By Product (2021-2032)
Table 20 Europe Craft Tea Revenue (USD Million) By Type (2021-2032)
Table 21 Europe Craft Tea Revenue (USD Million) By Application (2021-2032)
Table 22 Europe Craft Tea Revenue (USD Million) By Product (2021-2032)
Table 23 Asia Pacific Craft Tea Revenue (USD Million) By Type (2021-2032)
Table 24 Asia Pacific Craft Tea Revenue (USD Million) By Application (2021-2032)
Table 25 Asia Pacific Craft Tea Revenue (USD Million) By Product (2021-2032)
Table 26 South America Craft Tea Revenue (USD Million) By Type (2021-2032)
Table 27 South America Craft Tea Revenue (USD Million) By Application (2021-2032)
Table 28 South America Craft Tea Revenue (USD Million) By Product (2021-2032)
Table 29 Middle East and Africa Craft Tea Revenue (USD Million) By Type (2021-2032)
Table 30 Middle East and Africa Craft Tea Revenue (USD Million) By Application (2021-2032)
Table 31 Middle East and Africa Craft Tea Revenue (USD Million) By Product (2021-2032)
LIST OF FIGURES
Figure 1. Market Scope
Figure 2. Pricing Forecasts Per Unit, 2023- 2032
Figure 3. Porter’s Five Forces
Figure 4. Global Craft Tea Market Revenue (USD Million) By Regions (2021-2032)
Figure 5. Global Craft Tea Market Share (%) By Regions (2023)
Figure 6. North America Craft Tea Revenue (USD Million) By Country (2021-2032)
Figure 7. United States Craft Tea Revenue (USD Million) By Country (2021-2032)
Figure 8. Canada Craft Tea Revenue (USD Million) By Country (2021-2032)
Figure 9. Mexico Craft Tea Revenue (USD Million) By Country (2021-2032)
Figure 10. Europe Craft Tea Revenue (USD Million) By Country (2021-2032)
Figure 11. Germany Craft Tea Revenue (USD Million) By Country (2021-2032)
Figure 12. France Craft Tea Revenue (USD Million) By Country (2021-2032)
Figure 13. United Kingdom Craft Tea Revenue (USD Million) By Country (2021-2032)
Figure 14. Spain Craft Tea Revenue (USD Million) By Country (2021-2032)
Figure 15. Italy Craft Tea Revenue (USD Million) By Country (2021-2032)
Figure 16. Russia Craft Tea Revenue (USD Million) By Country (2021-2032)
Figure 17. Rest of Europe Craft Tea Revenue (USD Million) By Country (2021-2032)
Figure 11. Asia Pacific Craft Tea Revenue (USD Million) By Country (2021-2032)
Figure 12. China Craft Tea Revenue (USD Million) By Country (2021-2032)
Figure 13. Japan Craft Tea Revenue (USD Million) By Country (2021-2032)
Figure 14. India Craft Tea Revenue (USD Million) By Country (2021-2032)
Figure 15. South Korea Craft Tea Revenue (USD Million) By Country (2021-2032)
Figure 16. Australia Craft Tea Revenue (USD Million) By Country (2021-2032)
Figure 17. South East Asia Craft Tea Revenue (USD Million) By Country (2021-2032)
Figure 18. South America Craft Tea Revenue (USD Million) By Country (2021-2032)
Figure 19. Brazil Craft Tea Revenue (USD Million) By Country (2021-2032)
Figure 20. Argentina Craft Tea Revenue (USD Million) By Country (2021-2032)
Figure 21. Rest of Asia Pacific Craft Tea Revenue (USD Million) By Country (2021-2032)
Figure 22. Middle East and Africa Craft Tea Revenue (USD Million) By Region (2021-2032)
Figure 23. Saudi Arabia Craft Tea Revenue (USD Million) By Region (2021-2032)
Figure 24. The UAE Craft Tea Revenue (USD Million) By Region (2021-2032)
Figure 25. Rest of Middle East Craft Tea Revenue (USD Million) By Region (2021-2032)
Figure 26. South Africa Craft Tea Revenue (USD Million) By Region (2021-2032)
Figure 27. Africa Craft Tea Revenue (USD Million) By Region (2021-2032)
Figure 28. North America Craft Tea Revenue (USD Million) By Type (2021-2032)
Figure 29. North America Craft Tea Revenue (USD Million) By Application (2021-2032)
Figure 30. North America Craft Tea Revenue (USD Million) By Product (2021-2032)
Figure 31. Europe Craft Tea Revenue (USD Million) By Type (2021-2032)
Figure 32. Europe Craft Tea Revenue (USD Million) By Application (2021-2032)
Figure 33. Europe Craft Tea Revenue (USD Million) By Product (2021-2032)
Figure 34. Asia Pacific Craft Tea Revenue (USD Million) By Type (2021-2032)
Figure 35. Asia Pacific Craft Tea Revenue (USD Million) By Application (2021-2032)
Figure 36. Asia Pacific Craft Tea Revenue (USD Million) By Product (2021-2032)
Figure 37. South America Craft Tea Revenue (USD Million) By Type (2021-2032)
Figure 38. South America Craft Tea Revenue (USD Million) By Application (2021-2032)
Figure 39. South America Craft Tea Revenue (USD Million) By Product (2021-2032)
Figure 40. Middle East and Africa Craft Tea Revenue (USD Million) By Type (2021-2032)
Figure 41. Middle East and Africa Craft Tea Revenue (USD Million) By Application (2021-2032)
Figure 42. Middle East and Africa Craft Tea Revenue (USD Million) By Product (2021-2032)
By Distribution Channel
Supermarkets/Hypermarkets
Convenience Stores
Online Retail
Others
By Product
Blooming craft tea
Active craft tea
Floating floss craft tea
By End-User
Commercial
Individual
Countries Analyzed
North America (US, Canada, Mexico)
Europe (Germany, UK, France, Spain, Italy, Russia, Rest of Europe)
Asia Pacific (China, India, Japan, South Korea, Australia, South East Asia, Rest of Asia)
South America (Brazil, Argentina, Rest of South America)
Middle East and Africa (Saudi Arabia, UAE, Rest of Middle East, South Africa, Egypt, Rest of Africa)
