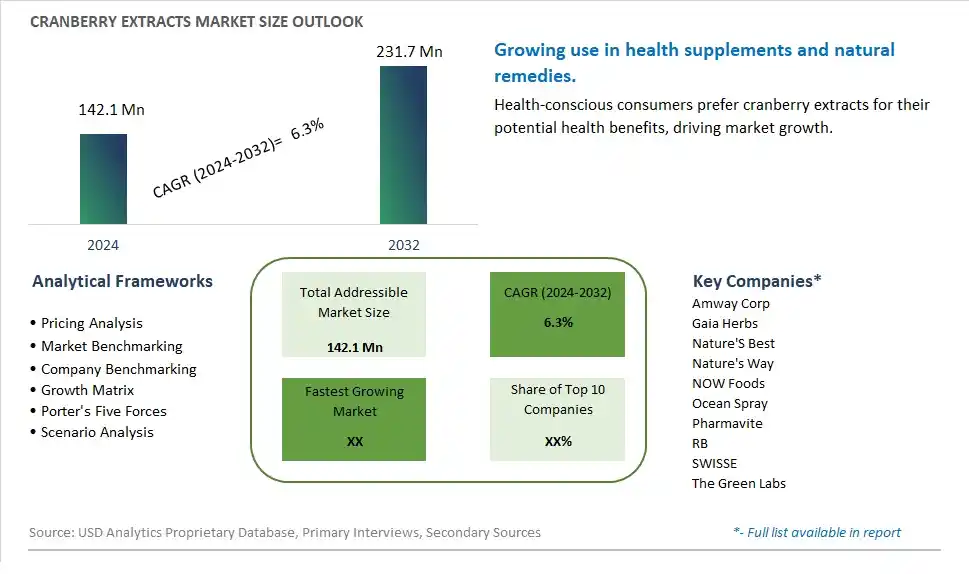
Global Cranberry Extracts Market Size is valued at $142.1 Million in 2024 and is forecast to register a growth rate (CAGR) of 6.3% to reach $231.7 Million by 2032.
The global Cranberry Extracts Market Comprehensive Study analyzes and forecasts the market size across 6 regions and 24 countries for diverse segments -By Type (Liquid, Dried, Powder), By Application (Food And Beverages, Pharmaceuticals, Nutraceuticals, Confectionary, Personal Care, Beauty Products, Others)
An Introduction to Cranberry Extracts Market
In 2024, the Cranberry Extracts market is witnessing significant growth, driven by the increasing demand for natural health supplements and functional ingredients. Cranberry extracts, rich in antioxidants, vitamins, and phytonutrients, are valued for their potential benefits in urinary tract health, immune support, and cardiovascular health. The market is supported by the growing trend towards clean-label and scientifically backed supplements. Advances in extraction and formulation technologies are enhancing the potency, purity, and bioavailability of cranberry extracts. The market is also benefiting from the trend towards natural and plant-based health products, appealing to health-conscious consumers seeking effective and natural remedies.
Cranberry Extracts Competitive Landscape
The market report analyses the leading companies in the industry including Amway Corp, Gaia Herbs, Nature'S Best, Nature's Way, NOW Foods, Ocean Spray, Pharmavite, RB, SWISSE, The Green Labs, and Others.
Cranberry Extracts Market Dynamics
Cranberry Extracts Market Trend: Growing Demand for Natural Health Supplements
One prominent market trend for Cranberry Extracts is the increasing demand for natural health supplements. Consumers are becoming more health-conscious and are seeking natural alternatives to traditional medicines. Cranberry extracts are known for their potential health benefits, such as supporting urinary tract health and providing antioxidants, which align with the growing trend of using natural remedies for wellness.
Cranberry Extracts Market Driver: Rise in Preventive Healthcare Practices
The market driver for Cranberry Extracts is the rise in preventive healthcare practices. With a focus on maintaining overall well-being and preventing health issues, consumers are incorporating dietary supplements like cranberry extracts into their daily routines. The awareness of cranberry's potential benefits for urinary tract health and antioxidant properties is driving the demand for products containing cranberry extracts.
Cranberry Extracts Market Opportunity: Expansion into Functional Food and Beverage Applications
An opportunity within the Cranberry Extracts market is the expansion into functional food and beverage applications. Cranberry extracts can be incorporated into a wide range of products, including juices, teas, snacks, and functional foods. Producers can capitalize on this opportunity by developing innovative formulations that cater to consumers looking for convenient ways to consume cranberry extracts as part of their diet. Collaborations with food and beverage companies for product development can also open up new avenues for market growth.
Cranberry Extracts Market Share Analysis: Liquid segment generated the highest revenue share in the industry
The Liquid segment stands out as the largest in the Cranberry Extracts Market by type. Its dominance is attributed to several factors contributing to its significant market share and robust growth outlook. Liquid cranberry extracts are highly versatile and convenient, making them popular among consumers and manufacturers alike. They are widely used in various applications such as beverages, dietary supplements, cosmetics, and pharmaceuticals due to their ease of incorporation and potential for higher bioavailability compared to other forms. Further, the Liquid segment offers the advantage of easy dosage control and faster absorption, making it a preferred choice for consumers seeking the health benefits associated with cranberry extracts. The segment's growth is further fueled by increasing consumer awareness of cranberry's health benefits, including urinary tract health, antioxidant properties, and potential anti-inflammatory effects. As demand for natural and functional ingredients continues to rise, the Liquid segment is poised to maintain its leading position in the Cranberry Extracts Market, driving innovation and market expansion.
Cranberry Extracts Market Share Analysis: Nutraceuticals is the fastest growing segment over the forecast period to 2032
The Nutraceuticals segment emerges as the fastest-growing segment in the Cranberry Extracts Market by application, poised for significant expansion and market influence by 2032. This rapid growth is driven by several key factors shaping the nutraceutical industry and consumer preferences. Nutraceutical products, encompassing dietary supplements, functional foods, and wellness-focused formulations, have witnessed a surge in demand globally as consumers prioritize preventive healthcare and holistic wellness approaches. Cranberry extracts are renowned for their potential health benefits, including urinary tract health, antioxidant properties, and potential cardiovascular and immune system support. The Nutraceuticals segment leverages these health attributes to cater to a growing market of health-conscious consumers seeking natural and functional ingredients. Additionally, the segment benefits from increased research and development efforts, product innovations, and strategic collaborations between manufacturers and healthcare professionals, further propelling its growth trajectory. As the demand for natural and science-backed nutritional solutions continues to rise, the Nutraceuticals segment is positioned for substantial growth and market prominence in the Cranberry Extracts Market.
Cranberry Extracts Market Segmentation
By Type
Liquid
Dried
Powder
By Application
Food And Beverages
Pharmaceuticals
Nutraceuticals
Confectionary
Personal Care
Beauty Products
Others
Countries Analyzed
North America (US, Canada, Mexico)
Europe (Germany, UK, France, Spain, Italy, Russia, Rest of Europe)
Asia Pacific (China, India, Japan, South Korea, Australia, South East Asia, Rest of Asia)
South America (Brazil, Argentina, Rest of South America)
Middle East and Africa (Saudi Arabia, UAE, Rest of Middle East, South Africa, Egypt, Rest of Africa)
Cranberry Extracts Companies Profiled in the Study
Amway Corp
Gaia Herbs
Nature'S Best
Nature's Way
NOW Foods
Ocean Spray
Pharmavite
RB
SWISSE
The Green Labs
*- List Not Exhaustive
Chapter 1. TABLE OF CONTENTS
Chapter 2. Introduction to Cranberry Extracts Market
2.1. Market Overview
2.2. Key Statistics and Report Highlights
2.3. Scope of the Comprehensive Study
2.3.1. Market Definition
2.3.2 Countries and Regions Covered
2.3.3 Research Objective
2.3.4 Units, Currency, and Conversions
2.3.5 Industry Value Chain
2.4. Key Market Segments
2.5. Key Companies
2.6. Study Period
Chapter 3. Strategic Analysis Review
3.1. Cranberry Extracts Pricing Analysis and Forecast
3.2. Porter’s Five Forces
3.3. Market Ecosystem
3.4. SWOT Analysis
3.5. Regulatory Scenario
3.3. Effects of Inflation, Russia-Ukraine War, moderating economic growth, and other macroeconomic factors
Chapter 4. Competitive Landscape
4.1. Market Share Analysis
4.1.1. Global Cranberry Extracts Market Share by Company, 2023
4.1.2. Product Offerings of Leading Cranberry Extracts Companies
4.2. Market Entropy
4.2.1. New Product Launches in the Industry
4.2.2. Mergers, Acquisitions, Joint ventures, and Partnerships
4.3. Key Strategies and Best Practices
Chapter 5. Global Market Projections: Best, Reference, and Low Case Scenarios
5.1. Growth Analysis- Case Scenario Definitions
5.2. Low Growth Case Scenario Forecasts
5.3. Reference Growth Case Scenario Forecasts
5.4. High Growth Case Scenario Forecasts
Chapter 6. Market Dynamics
6.1. Cranberry Extracts Market Drivers
6.2. Cranberry Extracts Market Challenges
6.6. Cranberry Extracts Market Opportunities
6.4. Cranberry Extracts Market Trends
Chapter 7. Global Cranberry Extracts Market Outlook Trends
7.1. Global Cranberry Extracts Revenue (USD Million) and CAGR (%) by Type (2021-2032)
7.2. Global Cranberry Extracts Revenue (USD Million) and CAGR (%) by Application (2021-2032)
7.3. Global Cranberry Extracts Revenue (USD Million) and CAGR (%) by Product (2021-2032)
By Type
Liquid
Dried
Powder
By Application
Food And Beverages
Pharmaceuticals
Nutraceuticals
Confectionary
Personal Care
Beauty Products
Others
Chapter 8. Global Cranberry Extracts Regional Analysis and Outlook
8.1. Global Cranberry Extracts Revenue (USD Million) By Regions (2021- 2032)
8.2. North America Cranberry Extracts Revenue (USD Million) by Country (2021-2032)
8.2.1. United States Cranberry Extracts Regional Analysis and Outlook
8.2.2. Canada Cranberry Extracts Regional Analysis and Outlook
8.2.3. Mexico Cranberry Extracts Regional Analysis and Outlook
8.3. Europe Cranberry Extracts Revenue (USD Million), by Country (2021-2032)
8.3.1. Germany Cranberry Extracts Regional Analysis and Outlook
8.3.2. France Cranberry Extracts Regional Analysis and Outlook
8.3.3. United Kingdom Cranberry Extracts Regional Analysis and Outlook
8.3.4. Spain Cranberry Extracts Regional Analysis and Outlook
8.3.5. Italy Cranberry Extracts Regional Analysis and Outlook
8.3.6. Russia Cranberry Extracts Regional Analysis and Outlook
8.3.7. Rest of Europe Cranberry Extracts Regional Analysis and Outlook
8.4. Asia Pacific Cranberry Extracts Revenue (USD Million) by Country (2021-2032)
8.4.1. China Cranberry Extracts Regional Analysis and Outlook
8.4.2. Japan Cranberry Extracts Regional Analysis and Outlook
8.4.3. India Cranberry Extracts Regional Analysis and Outlook
8.4.4. South Korea Cranberry Extracts Regional Analysis and Outlook
8.4.5. Australia Cranberry Extracts Regional Analysis and Outlook
8.4.6. South East Asia Cranberry Extracts Regional Analysis and Outlook
8.4.7. Rest of Asia Pacific Cranberry Extracts Regional Analysis and Outlook
8.5. South America Cranberry Extracts Revenue (USD Million), by Country (2021-2032)
8.5.1. Brazil Cranberry Extracts Regional Analysis and Outlook
8.5.2. Argentina Cranberry Extracts Regional Analysis and Outlook
8.5.3. Rest of South America Cranberry Extracts Regional Analysis and Outlook
8.6. Middle East and Africa Cranberry Extracts Revenue (USD Million) by Country (2021-2032)
8.6.1. Middle East Cranberry Extracts Regional Analysis and Outlook
8.6.2. Africa Cranberry Extracts Regional Analysis and Outlook
Chapter 9. North America Cranberry Extracts Analysis and Outlook
9.1. North America Cranberry Extracts Revenue (USD Million) by Segments (2021-2032)
9.1.1. North America Cranberry Extracts Revenue (USD Million) by Type (2021-2032)
9.1.2. North America Cranberry Extracts Revenue (USD Million) by Application (2021-2032)
9.1.3. North America Cranberry Extracts Revenue (USD Million) by Product (2021-2032)
By Type
Liquid
Dried
Powder
By Application
Food And Beverages
Pharmaceuticals
Nutraceuticals
Confectionary
Personal Care
Beauty Products
Others
Chapter 10. Europe Cranberry Extracts Analysis and Outlook
10.1. Europe Cranberry Extracts Revenue (USD Million), by Segments (USD Million) (2021-2032)
10.1.1. Europe Cranberry Extracts Revenue (USD Million) by Type (2021-2032)
10.1.2. Europe Cranberry Extracts Revenue (USD Million) by Application (2021-2032)
10.1.3. Europe Cranberry Extracts Revenue (USD Million) by Product (2021-2032)
By Type
Liquid
Dried
Powder
By Application
Food And Beverages
Pharmaceuticals
Nutraceuticals
Confectionary
Personal Care
Beauty Products
Others
Chapter 11. Asia Pacific Cranberry Extracts Analysis and Outlook
11.1. Asia Pacific Cranberry Extracts Revenue (USD Million), and Revenue (USD Million) by Segments (2021-2032)
11.1.1. Asia Pacific Cranberry Extracts Revenue (USD Million) by Type (2021-2032)
11.1.2. Asia Pacific Cranberry Extracts Revenue (USD Million) by Application (2021-2032)
11.1.3. Asia Pacific Cranberry Extracts Revenue (USD Million) by Product (2021-2032)
By Type
Liquid
Dried
Powder
By Application
Food And Beverages
Pharmaceuticals
Nutraceuticals
Confectionary
Personal Care
Beauty Products
Others
Chapter 12. South America Cranberry Extracts Analysis and Outlook
12.1. South America Cranberry Extracts Revenue (USD Million), by Segments (2021-2032)
12.1.1. South America Cranberry Extracts Revenue (USD Million) by Type (2021-2032)
12.1.2. South America Cranberry Extracts Revenue (USD Million) by Application (2021-2032)
12.1.3. South America Cranberry Extracts Revenue (USD Million) by Product (2021-2032)
By Type
Liquid
Dried
Powder
By Application
Food And Beverages
Pharmaceuticals
Nutraceuticals
Confectionary
Personal Care
Beauty Products
Others
Chapter 13. Middle East and Africa Cranberry Extracts Analysis and Outlook
13.1. Middle East and Africa Cranberry Extracts Revenue (USD Million), by Segments (2021-2032)
13.1.1. Middle East and Africa Cranberry Extracts Revenue (USD Million) by Type (2021-2032)
13.1.2. Middle East and Africa Cranberry Extracts Revenue (USD Million) by Application (2021-2032)
13.1.3. Middle East and Africa Cranberry Extracts Revenue (USD Million) by Product (2021-2032)
By Type
Liquid
Dried
Powder
By Application
Food And Beverages
Pharmaceuticals
Nutraceuticals
Confectionary
Personal Care
Beauty Products
Others
Chapter 14. Cranberry Extracts Company Profiles
14.1 Business Overview
14.2 Product Profiles
14.3 SWOT Profiles
14.5 Recent Developments
14.6 Financial Profile
List of Companies
Amway Corp
Gaia Herbs
Nature'S Best
Nature's Way
NOW Foods
Ocean Spray
Pharmavite
RB
SWISSE
The Green Labs
15. Methodology and Data Sources
15.1 Customization Offerings
15.2 Subscription Services
15.3 Related Reports
15.4 Publisher Expertise
LIST OF TABLES
Table 1 Market Segmentation Analysis
Table 2 Global Cranberry Extracts Market Share of Leading Companies, 2023
Table 3 Product Offerings of Leading Companies
Table 4 Low Growth Scenario Forecasts
Table 5 Reference Case Growth Scenario
Table 6 High Growth Case Scenario
Table 7 Global Cranberry Extracts Revenue (USD Million) And CAGR (%) By Type (2021-2032)
Table 8 Global Cranberry Extracts Revenue (USD Million) And CAGR (%) By Application (2021-2032)
Table 9 Global Cranberry Extracts Revenue (USD Million) And CAGR (%) By Product (2021-2032)
Table 10 Global Cranberry Extracts Market Revenue (USD Million) By Regions (2021-2032)
Table 11 Global Cranberry Extracts Market Share (%) By Regions (2021-2032)
Table 12 North America Cranberry Extracts Revenue (USD Million) By Country (2021-2032)
Table 13 Europe Cranberry Extracts Revenue (USD Million) By Country (2021-2032)
Table 14 Asia Pacific Cranberry Extracts Revenue (USD Million) By Country (2021-2032)
Table 15 South America Cranberry Extracts Revenue (USD Million) By Country (2021-2032)
Table 16 Middle East and Africa Cranberry Extracts Revenue (USD Million) By Region (2021-2032)
Table 17 North America Cranberry Extracts Revenue (USD Million) By Type (2021-2032)
Table 18 North America Cranberry Extracts Revenue (USD Million) By Application (2021-2032)
Table 19 North America Cranberry Extracts Revenue (USD Million) By Product (2021-2032)
Table 20 Europe Cranberry Extracts Revenue (USD Million) By Type (2021-2032)
Table 21 Europe Cranberry Extracts Revenue (USD Million) By Application (2021-2032)
Table 22 Europe Cranberry Extracts Revenue (USD Million) By Product (2021-2032)
Table 23 Asia Pacific Cranberry Extracts Revenue (USD Million) By Type (2021-2032)
Table 24 Asia Pacific Cranberry Extracts Revenue (USD Million) By Application (2021-2032)
Table 25 Asia Pacific Cranberry Extracts Revenue (USD Million) By Product (2021-2032)
Table 26 South America Cranberry Extracts Revenue (USD Million) By Type (2021-2032)
Table 27 South America Cranberry Extracts Revenue (USD Million) By Application (2021-2032)
Table 28 South America Cranberry Extracts Revenue (USD Million) By Product (2021-2032)
Table 29 Middle East and Africa Cranberry Extracts Revenue (USD Million) By Type (2021-2032)
Table 30 Middle East and Africa Cranberry Extracts Revenue (USD Million) By Application (2021-2032)
Table 31 Middle East and Africa Cranberry Extracts Revenue (USD Million) By Product (2021-2032)
LIST OF FIGURES
Figure 1. Market Scope
Figure 2. Pricing Forecasts Per Unit, 2023- 2032
Figure 3. Porter’s Five Forces
Figure 4. Global Cranberry Extracts Market Revenue (USD Million) By Regions (2021-2032)
Figure 5. Global Cranberry Extracts Market Share (%) By Regions (2023)
Figure 6. North America Cranberry Extracts Revenue (USD Million) By Country (2021-2032)
Figure 7. United States Cranberry Extracts Revenue (USD Million) By Country (2021-2032)
Figure 8. Canada Cranberry Extracts Revenue (USD Million) By Country (2021-2032)
Figure 9. Mexico Cranberry Extracts Revenue (USD Million) By Country (2021-2032)
Figure 10. Europe Cranberry Extracts Revenue (USD Million) By Country (2021-2032)
Figure 11. Germany Cranberry Extracts Revenue (USD Million) By Country (2021-2032)
Figure 12. France Cranberry Extracts Revenue (USD Million) By Country (2021-2032)
Figure 13. United Kingdom Cranberry Extracts Revenue (USD Million) By Country (2021-2032)
Figure 14. Spain Cranberry Extracts Revenue (USD Million) By Country (2021-2032)
Figure 15. Italy Cranberry Extracts Revenue (USD Million) By Country (2021-2032)
Figure 16. Russia Cranberry Extracts Revenue (USD Million) By Country (2021-2032)
Figure 17. Rest of Europe Cranberry Extracts Revenue (USD Million) By Country (2021-2032)
Figure 11. Asia Pacific Cranberry Extracts Revenue (USD Million) By Country (2021-2032)
Figure 12. China Cranberry Extracts Revenue (USD Million) By Country (2021-2032)
Figure 13. Japan Cranberry Extracts Revenue (USD Million) By Country (2021-2032)
Figure 14. India Cranberry Extracts Revenue (USD Million) By Country (2021-2032)
Figure 15. South Korea Cranberry Extracts Revenue (USD Million) By Country (2021-2032)
Figure 16. Australia Cranberry Extracts Revenue (USD Million) By Country (2021-2032)
Figure 17. South East Asia Cranberry Extracts Revenue (USD Million) By Country (2021-2032)
Figure 18. South America Cranberry Extracts Revenue (USD Million) By Country (2021-2032)
Figure 19. Brazil Cranberry Extracts Revenue (USD Million) By Country (2021-2032)
Figure 20. Argentina Cranberry Extracts Revenue (USD Million) By Country (2021-2032)
Figure 21. Rest of Asia Pacific Cranberry Extracts Revenue (USD Million) By Country (2021-2032)
Figure 22. Middle East and Africa Cranberry Extracts Revenue (USD Million) By Region (2021-2032)
Figure 23. Saudi Arabia Cranberry Extracts Revenue (USD Million) By Region (2021-2032)
Figure 24. The UAE Cranberry Extracts Revenue (USD Million) By Region (2021-2032)
Figure 25. Rest of Middle East Cranberry Extracts Revenue (USD Million) By Region (2021-2032)
Figure 26. South Africa Cranberry Extracts Revenue (USD Million) By Region (2021-2032)
Figure 27. Africa Cranberry Extracts Revenue (USD Million) By Region (2021-2032)
Figure 28. North America Cranberry Extracts Revenue (USD Million) By Type (2021-2032)
Figure 29. North America Cranberry Extracts Revenue (USD Million) By Application (2021-2032)
Figure 30. North America Cranberry Extracts Revenue (USD Million) By Product (2021-2032)
Figure 31. Europe Cranberry Extracts Revenue (USD Million) By Type (2021-2032)
Figure 32. Europe Cranberry Extracts Revenue (USD Million) By Application (2021-2032)
Figure 33. Europe Cranberry Extracts Revenue (USD Million) By Product (2021-2032)
Figure 34. Asia Pacific Cranberry Extracts Revenue (USD Million) By Type (2021-2032)
Figure 35. Asia Pacific Cranberry Extracts Revenue (USD Million) By Application (2021-2032)
Figure 36. Asia Pacific Cranberry Extracts Revenue (USD Million) By Product (2021-2032)
Figure 37. South America Cranberry Extracts Revenue (USD Million) By Type (2021-2032)
Figure 38. South America Cranberry Extracts Revenue (USD Million) By Application (2021-2032)
Figure 39. South America Cranberry Extracts Revenue (USD Million) By Product (2021-2032)
Figure 40. Middle East and Africa Cranberry Extracts Revenue (USD Million) By Type (2021-2032)
Figure 41. Middle East and Africa Cranberry Extracts Revenue (USD Million) By Application (2021-2032)
Figure 42. Middle East and Africa Cranberry Extracts Revenue (USD Million) By Product (2021-2032)
By Type
Liquid
Dried
Powder
By Application
Food And Beverages
Pharmaceuticals
Nutraceuticals
Confectionary
Personal Care
Beauty Products
Others
Countries Analyzed
North America (US, Canada, Mexico)
Europe (Germany, UK, France, Spain, Italy, Russia, Rest of Europe)
Asia Pacific (China, India, Japan, South Korea, Australia, South East Asia, Rest of Asia)
South America (Brazil, Argentina, Rest of South America)
Middle East and Africa (Saudi Arabia, UAE, Rest of Middle East, South Africa, Egypt, Rest of Africa)
